Abstract
Interaction of diagnostic ultrasound with gas bodies produces a useful contrast effect in medical images, but the same interaction also represents a mechanism for bioeffects. Anesthetized hairless mice were scanned by using a 2.5-MHz transducer (610-ns pulses with 3.6-kHz repetition frequency and 61-Hz frame rate) after injection of Optison and Evans blue dye. Petechial hemorrhages (PHs) in intestine and abdominal muscle were counted 15 min after exposure to characterize capillary rupture, and Evans blue extravasation was evaluated in samples of muscle tissue. For 5 ml⋅kg-1 contrast agent and exposure to 10 alternating 10-s on and off periods, PH counts in muscle were approximately proportional to the square of peak negative pressure amplitude and were statistically significant above 0.64 MPa. PH counts in intestine and Evans blue extravasation into muscle tissue were significant above 1.0 MPa. The PH effect in muscle was proportional to contrast dose and was statistically significant for the lowest dose of 0.05 ml⋅kg-1. The effects decreased nearly to sham levels if the exposure was delayed 5 min. The PH effect in abdominal muscle was significant and statistically indistinguishable for uninterrupted 100-s exposure, 10-s exposure, 100 scans repeated at 1 Hz, and even for a single scan. The results confirms a previous report of PH induction by diagnostic ultrasound with contrast agent in mammalian skeletal muscle [Skyba, D. M., Price, R. J., Linka, A. Z., Skalak, T. C. & Kaul, S. (1998) Circulation 98, 290–293].
Diagnostic ultrasound scanners form images by sending trains of pulses into the body and processing the echoes for display. Most tissues provide satisfactory return of ultrasonic energy to form a textured image; however, blood has low echogenicity and blood-filled spaces often appear empty. Doppler mode display processes the low return from blood in terms of Doppler frequency shifts, partly alleviating the low signal problem, when sufficient blood motion is present in a suitable direction. Various contrast agents have been developed to enhance the echogenicity of blood and other fluid-filled regions of the body (1, 2). To be effective in the circulation, most contrast agents for use in clinical diagnostic ultrasound contain stabilized gas bodies. The gas bodies are a few microns in diameter, a size that not only allows them to pass through the circulation, but also produces strong echos. For example, Optison (Mallinckrodt) contains about 5⋅108 ml-1 gas bodies 2–4.5 μm in diameter, which are filled with perfluoropropane and stabilized by approximately 15-nm thick albumin shells (3). Several other gas body-based agents have been developed with somewhat different stabilization strategies and internal gases (4).
Medical diagnostic scanners typically produce moderate pressure amplitudes, which are sufficient to excite strong echoes from the contrast agent gas bodies. After derating from measured water values at 0.3 dB/cm per MHz (to estimate resulting in situ levels), temporal average intensities up to 720 mW⋅cm-2 and peak negative pressure amplitudes up to 1.9/f-1/2 MPa⋅MHz-1/2 [i.e., a value of the Mechanical Index (MI), which is an on-screen indicator of ultrasound output, of 1.9] for center frequency f are allowed under track 3 in 510(k) submissions for premarket clearance (5). The interaction of ultrasound with the contrast agent gas bodies sets them into oscillation (gas body activation) and can destabilize them to allow pulsation of resulting free bubbles (cavitation nucleation) (6, 7). This strong interaction is responsible for the contrast effect in medical images (1, 2). However, both gas body activation and ultrasound cavitation have been recognized as potential mechanisms for biological effects of diagnostic ultrasound (8, 9). Thus, use of these agents appears to introduce risk factors not normally considered in clinical drug trials, related to the ultrasonic activation of the stabilized gas bodies. The bioeffects potential of diagnostic ultrasound contrast agents is presently not well understood and has been the subject of recent bioeffects research (10–12).
In vitro ultrasound exposures with gas bodies present are clearly capable of inducing biologically significant effects under conditions relevant to diagnostic use. The activation of contrast agent gas bodies can cause hemolysis in whole blood (13, 14). Agents with improved persistence enhance effects obtained with pulsed ultrasound (15). For cells in monolayer culture, interaction of low-level ultrasound with gas bodies in contact with cells results in membrane damage, which is correlated with nonlinear emission from the destabilized agent (16). This membrane damage includes sonoporation by relatively low-level exposure of Optison from a medical diagnostic scanner (17). Erosion and lysis of monolayer cells from the substrate also has been demonstrated at exposure levels within the range of diagnostic ultrasound (18).
In vivo, significant effects have been found for therapeutic ultrasound and laboratory exposure systems. For shock wave lithotriptsy, the addition of contrast agents to the circulation enhances vascular damage induced by the shock waves in mouse intestine and other organs, and this enhancement persists for several hours after injection of Albunex (an agent similar to Optison, but containing air) (19, 20). The contrast-agent-related effects can be highly biologically significant: 24-h survival of mice was significantly reduced by exposure to 800 lithotripter shock waves together with a 1 ml/kg Albunex dose (21). At lower levels of pulsed ultrasound, the induction of petechiae in mouse intestine is clearly related to the presence of contrast agent gas bodies in the circulation (in the absence of significant heating), and the numbers of petechiae observed is proportional to the dose of contrast agent (22). Newer contrast agents with improved persistence appear to reduce thresholds and lead to greater effects for a given dosage than older agents (e.g., Optison relative to Albunex) (23).
Efforts to detect bioeffects induced by actual diagnostic ultrasound instruments with contrast agents in laboratory animals have led to mixed results. Pulsed ultrasound with contrast agent has been shown to cause hemolysis in vivo at levels near those used for diagnostic instruments (24), but other tests for induction of hemolysis with an actual diagnostic scanner were negative (25). During intravital microscopy, microvessel rupture has been observed to occur within the rat spinotrapezius muscle with Optison gas bodies sonicated with a diagnostic ultrasound scanner (26, 27). Extravasation of red blood cells and production of nonviable cells were observed for 2.3-MHz ultrasound for MI values as low as 0.4. This result unequivocally shows a biologically significant effect produced by a diagnostic scanner combined with contrast agent, although the dosimetry for the intravital setup was somewhat uncertain. The MI values were lower in that study (26) than in the research with mouse intestine, for which the effect had an apparent threshold of 1.4 equivalent MI (23).
The purpose of this study was to extend previous work (22, 23) on induction of petechial hemorrhage (PH) in mouse intestine under the hypothesis that clinical diagnostic ultrasound exposure (i.e., not an experimental laboratory system) could produce this effect with Optison gas bodies. In addition, the study was intended to independently scrutinize the previously reported induction of in vivo PHs at relatively low MI values (26), in a more standard exposure arrangement with definitive dosimetry. The research methods were extended to include observation of petechiae and extravasation in samples of abdominal muscle. The PH effects were manifest, which confirms the previous findings in skeletal muscle (26, 27). Together, these studies present independently confirmed examples of the induction of mammalian bioeffects by medical diagnostic ultrasound devices with contrast agents.
Methods
Methods for this research were similar to previous studies in hairless male mice (Charles River Breeding Laboratories, SK-H1) (22, 23). All animal procedures were in accordance with institutional Animal Care Committee guidelines. For ultrasound exposure, a mouse was anesthetized with an intramuscular injection of 100 mg/kg ketamine (Ketaset, Aveco, Fort Dodge IA) and 20 mg/kg xylazine (Rompun, Mobay Chemical). The mouse then was mounted face down on a plastic board with Velcro strips. The abdomen, coated with ultrasound coupling gel, was positioned over a 4-cm by 6-cm hole in the board against a sheet of Tegaderm (3M Co.) for passage of the ultrasound beam. The board then was mounted at a 45° incline in a 37°C bath filled with degassed water, which was filtered continuously through a 0.2-μm filter. Rectal temperature was checked with a thermocouple probe (RET-3, Harvard Apparatus), and exposure commenced only when the mouse temperature was within 1°C of the bath temperature. The ultrasound transducer also was mounted in the bath, aimed upward at a 45° angle to direct the beam for normal incidence on the mouse abdomen.
Before ultrasound exposure, 10 ml⋅kg-1 of an agent mixture was introduced into the mouse by retroorbital injection with a 25-gauge needle. The agent mixture was prepared in a 1-ml syringe and consisted of 50% each of 10 mg⋅ml-1 Evans blue dye in PBS and contrast agent. The dye provides an indicator of microvascular permeability by producing blue-colored regions in tissue (28). The contrast agent portion of the mixture consisted of Optison and sterile 1% BSA (Sigma) in PBS. The dosage was 5 ml⋅kg-1 for 100% Optison, decreasing to zero (i.e., a gas body-free blank) for 100% albumin solution. A fresh vial of Optison was used each day, and the desired dosage was withdrawn by using an Optispike dispensing pin (Mallinckrodt). To maintain the composition of the head space gas during the day, a bag containing perfluoropropane gas was attached to the inlet side of the dispensing pin.
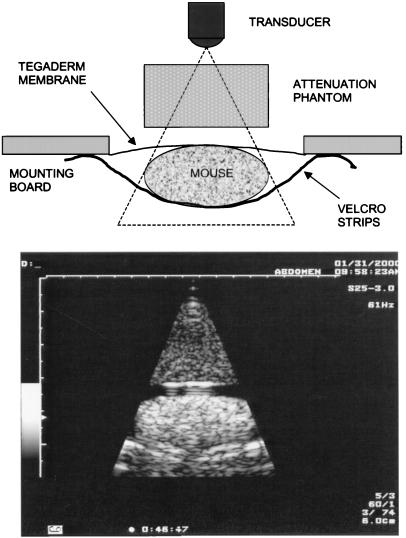
A Toshiba 6000 Powervision ultrasound machine (model SSA-370A, Toshiba, Tokyo, Japan) was used for the exposures. A 2.5-MHz transducer (model PSM-25AT) was operated in two-dimensional scanning mode with narrow field of view, giving a 61-Hz frame rate and 6-cm depth with 4.2-cm focus. The distance between the surface of the transducer and the mouse abdomen was 3.5 cm. The instrument display included a readout of the MI, but this readout was not used to characterize the exposures because of uncertainties about its accuracy for the specific machine and laboratory situation. The ultrasound field was characterized by measurements with a bilaminar-shielded hydrophone with a 0.4-mm sensitive spot (model 805, Perceptron, Hatboro, PA) at the position of the mouse (but in its absence). The beam scan was as wide as the mouse and had an approximate −6-dB width (based on temporal peak negative pressure) of 4.5 mm. At 3.5 cm from the transducer, the hydrophone detected a complex modulation sequence. The scans occurring approximately each 16.7 ms consisted of one maximum amplitude pulse, with pulses of decreasing amplitude before and after the main pulse (at the center of the scan). The 610-ns duration pulses had a pulse repetition frequency of 3.6 kHz (278 μs between pulses). A 2.4-cm path-length phantom was constructed by using evaporated milk (29). This phantom produced an attenuation factor of 0.78 dB⋅cm-1⋅MHz-1, which was equivalent to about 0.53 dB⋅cm-1⋅MHz-1 if averaged over the 3.5-cm range (i.e., 1.1 cm of water and 2.4 cm of phantom). The phantom allowed the pulse waveform at the abdomen to simulate the waveform that would occur at depth in tissue (e.g., as might occur in a patient). Fig. 1 shows an ultrasound image (from video) of a mouse obtained with the phantom. A diagram of the apparatus is included on Fig. 1 to aid in identifying the features in the ultrasound image. In addition to attenuation by the phantom, an acoustic power control on the instrument was used to vary the exposure in approximately 3-dB increments. The measured pressure amplitudes used in this study are listed in Table 1. Equivalent MI values, which were calculated by dividing the measured peak negative pressure amplitude by the square root of 2.5 MHz, also are given in the table. Calculated values of the pulse average intensity also are listed. All results are specified in terms of the actual measured peak-negative pressure amplitude for each exposure level.
Figure 1.
(Upper) The experimental setup. (Lower) The ultrasound image obtained during exposure with the attenuation phantom.
Table 1.
Spatial peak pressure amplitudes and equivalent MI values (i.e., the negative pressure amplitude divided by the square root of 2.5 MHz) produced at the position of the mouse abdomen for the power adjustments and phantom attenuation used in this study
| Power | Attenuation phantom
|
Water 0 | ||||
|---|---|---|---|---|---|---|
| −12 | −9 | −6 | −3 | 0 | ||
| Positive | 0.3 | 0.5 | 0.84 | 1.55 | 2.9 | 5.8 |
| Mean | 0.3 | 0.5 | 0.82 | 1.40 | 2.4 | 4.3 |
| Negative | 0.3 | 0.5 | 0.78 | 1.25 | 1.9 | 2.8 |
| Equivalent MI | 0.2 | 0.3 | 0.5 | 0.8 | 1.2 | 1.8 |
| IPA | 2.8 | 7.0 | 19 | 57 | 157 | 488 |
The pulse-average intensities (IPA, W cm−2) calculated from the pressure waveforms also are listed.
After exposure, the mouse was removed from the holder, dried, and placed in a warmed holding container for 15 min before being killed by CO2 asphyxiation. The intestines were scored blind by inspection under a stereo microscope. The number of petechiae, which were visible as small (0.1–1.0 mm) bright-red spots, were counted separately in the intestinal wall and in the Peyer's patches. The entire intestine was made noticeably bluish by the injected dye, which was of no value for evaluating this tissue. A portion of the abdominal muscle about 2 cm high by 4 cm wide was removed and separated from the skin. This thin tissue was translucent and was scored by separately counting petechiae in the muscle tissue (where they appeared as red streaks) and in the associated fat (where they appeared as red circles around fat cells). For the final results, the separate counts were combined, because the separate counts were highly variable and seemed to follow similar trends. The counts in the intestinal wall and Peyer's patches were added to obtain the intestine result, and the counts in the abdominal muscle and fat were combined to obtain the muscle result. Often, the scanned muscle tissue appeared bluish because of extravasation of the Evans blue into the tissue. To quantify this extravasation, a sample roughly 1 cm by 3 cm was cut out and placed in 2 ml formamide for extraction of the dye from the tissue. After about 24 h at 60°C, the samples were removed to room temperature until measurement. The absorbance of the formamide samples was measured at 620 nm and calibrated by comparison to samples of Evans blue diluted first in 1% albumin solution, and then in formamide. Results are reported as the mean and standard error of six repeated measurements in different mice. Student's t tests were performed to compare results, with statistically significant difference assumed at P < 0.05 (two-sided test).
Results
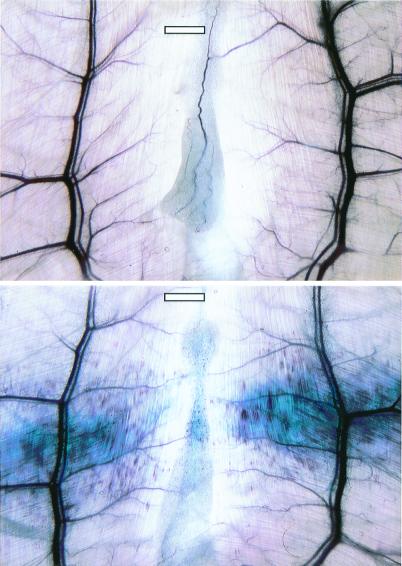
To maximize effects, most exposures were performed as 10 intermittent exposures with alternating 10-sec on (scanning) periods separated by 10-sec off (freeze frame) periods (denoted as 10 × 10s). Fig. 2 shows one abdominal muscle sample exposed at 2.8 MPa in this way with a 5 ml⋅kg-1 dose of contrast agent, and another exposed in the same way with blank agent. Hundreds of PHs and extravasation of the Evans blue dye resulted from the exposure with injected contrast agent gas bodies, whereas no effects were seen without the injected gas bodies.
Figure 2.
Examples of the effects found in the abdominal muscle and fat. (Lower) PHs and Evans blue extravasation with 5 ml⋅kg-1 contrast agent and 10 × 10s exposure at 2.8 MPa. (Upper) No effect with the same exposure but without injected contrast-agent gas bodies. (Scale bars: 1 mm.)
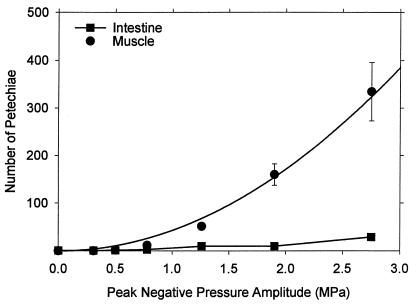
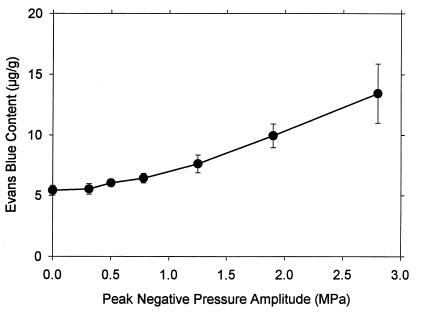
A series of 10 × 10s exposures was conducted by using the range of pressure amplitudes listed in Table 1, with the maximum 5 ml⋅kg-1 dosage of Optison. Results are shown in Fig. 3 for the PH counts in intestine and muscle. The lowest pressure amplitude with a statistically significant result relative to sham exposure was 0.78 MPa. The intestine PH count was significant at 1.25 MPa. The result for muscle was particularly robust and appears to follow a smooth trend. The curve plotted with these points was fitted to the mean values as a function of the square of the peak-negative pressure amplitudes. The Evans blue extravasation increased above background for the higher-exposure amplitudes, as shown in Fig. 4, with the first result statistically significantly different from the sham (background) at 1.25 MPa.
Figure 3.
Mean PH counts with standard error bars in muscle and intestine for 5 ml⋅kg-1 contrast agent at the indicated pressure amplitudes. The curve plotted with the muscle results was fitted to the data means by linear regression against the square of the amplitude (r2 = 0.995).
Figure 4.
The results for Evans blue extravasation for 5 ml⋅kg-1 contrast agent at the indicated pressure amplitudes, obtained from the same samples used for the points in Fig. 3.
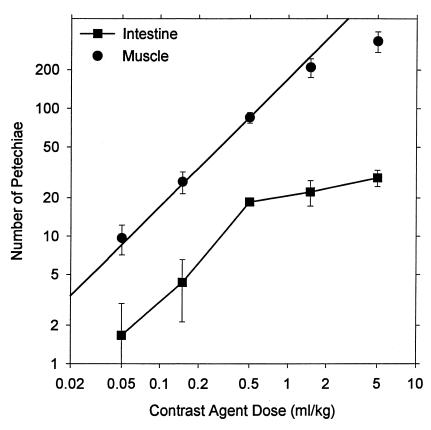
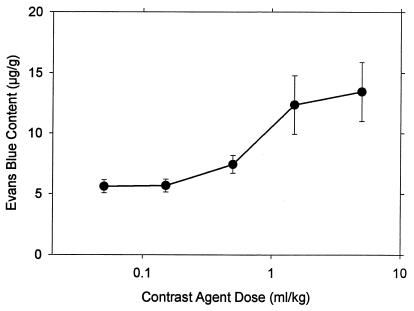
Another series of 10 × 10s exposures at 2.8 MPa was conducted with varied doses of contrast agent, including zero. The result for zero dose was statistically indistinguishable from sham exposure. PH counts in muscle and intestine for other doses are shown in Fig. 5, plotted on a logarithmic scale. All of the results for muscle were significantly different from the zero-dose results. The line in Fig. 5 represents direct proportionality to concentration (i.e., a slope of unity) based on the average ratio (except the highest dose point) of PH counts to concentration (171 per ml⋅kg-1), which had a coefficient of determination r2 = 0.988. At the highest dose, the counts seem to level off (possibly owing to difficulties in separately counting each red spot), and this trend was more pronounced for the counts in intestine. The results for Evans blue extravasation are shown in Fig. 6. PH counts in intestine and Evans blue extravasation both were statistically significant relative to zero dose for 0.5 ml⋅kg-1 and higher doses.
Figure 5.
Mean PH counts with standard error bars in muscle and intestine for 10 × 10s exposure at 2.8 MPa with the indicated contrast agent doses. The line indicates linear dependence of the muscle counts on dose (except the maximum dose) (r2 = 0.988).
Figure 6.
The results for Evans blue extravasation for the indicated contrast agent doses, obtained from the same samples used for the points in Fig. 5.
The influence of the timing of the 10 × 10s exposures after injection was investigated for comparison to immediate exposure. If a 100-s delay in exposure was allowed after injection, the mean result for abdominal PH counts decreased from 334 to 226. After 300-s delay, the mean result declined to 2.7.
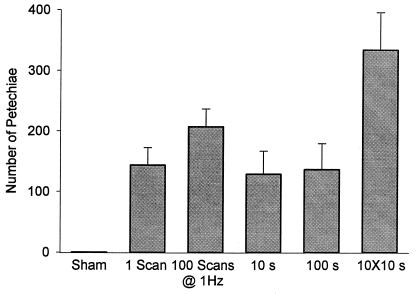
The 10 × 10s exposure had a total scan time of 100 s. Results for muscle PH counts for single 10-s and single 100-s scan periods are compared in Fig. 7. The 10-s and 100-s exposures produced statistically indistinguishable results, both of which were significantly less than the 10 × 10s exposure (but significantly greater than sham exposure). Because the effects appeared to occur very quickly (e.g., less than 10 s), the instrument was set up to produce individual scans, and scans were repeated at 1-s intervals. Because the ultrasound was off between scans, this mode was different from the normal triggering mode (e.g., from an electrocardiogram signal), which involves continuous scanning but triggered display. Means of the PH counts are shown in Fig. 7. The single scan result was significantly different from sham exposure. The PH counts for 100 scans were not statistically different from the one-scan result; however, the Evans blue extravasation was significantly greater after 100 scans. Both muscle and intestine (data not shown) PH counts were statistically indistinguishable among the one-scan, 100-scan, 10-s, and 100-s exposures.
Figure 7.
A comparison of muscle PH counts after different exposure timing sequences at 2.8 MPa with 5 ml⋅kg-1 contrast agent.
Discussion
Diagnostic ultrasound activation of contrast agent gas bodies was found to induce PHs in mouse intestine, including Peyer's patches, and in abdominal muscle and fat. In addition, Evans blue dye extravasation was observed in the abdominal muscle tissue in conjunction with the PHs. For a contrast agent dose of 5 ml⋅kg-1, significant PHs in abdominal muscle and fat counts were found at 0.78 MPa, but not at 0.5 MPa. A statistically indicated threshold therefore can be located between these two levels at about 0.64 MPa (equivalent MI = 0.4). However, the existence of a threshold is not readily apparent from the data. The data means were approximately proportional to the square of the pressure amplitude (also approximately proportional to pulse-average intensity) with no threshold. Evans blue dye extravasation had a relatively large background (because of the normal blood content of tissue) and a statistically indicated threshold of about 1.0 MPa.
The PH effect in intestine was seen at lower pressure amplitudes (i.e., 1.0 MPa statistically indicated threshold) than previously reported (i.e., 2.2-MPa threshold for 2.3-MHz ultrasound and Optison) for exposure with a single-element transducer (23). This difference may be because of a less-sensitive test arrangement in the previous study. The previous exposure was in the near field, which was highly nonuniform and produced the peak pressure only at the narrow central maximum with 2.7-mm beam width. A broad side lobe at about 5-mm radius exposed most of the mouse abdomen to a much lower pressure amplitude, which was 0.43 of the central peak. Assuming that this side lobe was the primary determinant of the observed effects, then a reduced threshold of about 0.95 MPa would be implied for the previous work, in good agreement with the present result. The thresholds for the other agents tested in the previous study likewise might be found to be lower for exposure with the diagnostic ultrasound system, which exposed an area roughly 3 cm long and 4.5 mm in width.
The results for the abdominal muscle seem to be in good agreement with results previously reported by independent investigators for rat spinotrapezius muscle (26). The finding of a threshold near MI = 0.4 was identical to the statistically indicated threshold found in this study. In addition, a significant effect was found in both studies after only one scan. The different experimental arrangements and species used for these studies suggest some general validity for the results. This study therefore should be considered to independently confirm the earlier finding for PHs in mammalian skeletal muscle induced by diagnostic ultrasound with contrast agent.
The 5 ml⋅kg-1 dosage is much higher than normally would be used clinically, although it should be noted that the injection procedure used here probably results in a reduction of the dose actually reaching the circulation (relative to clinical i.v. injection). For lower doses of contrast agent the PH effect was proportional to dose and was statistically significant even for 0.05 ml⋅kg-1, which might roughly approximate a normal human dosage. The relatively high dosages used in this research facilitated observation of robust effects in the small tissue samples, but the total effect over a scanned volume might be important even for lower doses. The exposed area was about 4.5 mm by 30 mm and weighed about 120 mg (determined by weighing tissue samples of known area). Therefore, the observed 9.6 PHs for 0.05 ml⋅kg-1 dose represents about 80 PHs per g of tissue. Because skeletal muscle has relatively low resting perfusion, effects might be expected to be higher in tissues with higher perfusion, assuming that the capillaries are equally susceptible.
The gas bodies apparently are removed from the circulation within about 5 min. A delay in exposure of only 100 s reduced the PH results, and 5-min delay virtually eliminated the effect. In humans, the removal of the agents takes about 15 min (1). The gas bodies are lost through destruction by the ultrasound exposure above about 0.2 MPa, and some time with the ultrasound off is needed for refill of the scanned volume. The 10 × 10s exposure strategy was intended to allow refill between 10-s exposures, which appears to have enhanced the effects seen in this study (e.g., see Fig. 7). Scanning continuously for 100-s exposures produced the same effect as 10-s, 100 single scans repeated at 1-Hz intervals, and even one single scan. The equivalent effectiveness of one scan with a few pulses to that of 100-s continuous scanning shows the remarkable time independence of this process (unless time for refill is allowed).
Conclusions
Diagnostic ultrasound activation of contrast agent gas bodies induces capillary rupture in mice. This effect was not known during the approval process for available contrast agents. There appears to be a potential for effects at low pressure amplitudes (above about 0.64 MPa at 2.5 MHz, or equivalent MI = 0.4), in proportion to agent dosage, and from durations as brief as a single scan. This combination of factors suggests that diffuse microscale effects might occur over large volumes of tissue, which might not be readily apparent clinically. Furthermore, this problem may be of growing concern: because the source of the contrast effect (i.e., cavitation activity) is also the bioeffects mechanism, improvements in contrast agent design and usage procedures also tend to enhance biological effectiveness. The medical significance of these findings is presently uncertain. However, a prudent interpretation would suggest a measure of caution for the introduction of gas body contrast agents into diagnostic ultrasound practice and vigilance for any medically deleterious consequences of their use.
Acknowledgments
We thank Dr. J. Brian Fowlkes for many valuable discussions of the operation of the diagnostic ultrasound scanner and Toshiba Corporation for providing the scanner used in this research. This research was supported by Public Health Service Grant CA42947 awarded by the National Institutes of Health, Department of Health and Human Services.
Abbreviations
- PH
petechial hemorrhage
- MI
Mechanical Index
- 10 × 10s
alternating 10-sec on (scanning) periods separated by 10-sec off (freeze frame) periods
Footnotes
Article published online before print: Proc. Natl. Acad. Sci. USA, 10.1073/pnas.180294397.
Article and publication date are at www.pnas.org/cgi/doi/10.1073/pnas.180294397
References
- 1.Golberg B B, Liu J B, Forsberg F. Ultrasound Med Biol. 1994;20:319–333. doi: 10.1016/0301-5629(94)90001-9. [DOI] [PubMed] [Google Scholar]
- 2.Burns P N. In: Diagnostic Ultrasound. Rumack C, Wilson S, Charboneau J, editors. Vol. 1. New York: Mosby; 1998. pp. 57–84. [Google Scholar]
- 3.Killam A, Dittrich H. In: Ultrasound Contrast Agents. Goldberg B, editor. London: Martin Dunitz; 1997. pp. 43–55. [Google Scholar]
- 4.Cotter B, Mahmud E, Kwan O L, DeMaria A N. In: Ultrasound Contrast Agents. Goldberg B, editor. London: Martin Dunitz; 1997. pp. 31–42. [Google Scholar]
- 5.Food and Drug Administration. Information for Manufacturers Seeking Clearance of Diagnostic Ultrasound Systems and Transducers. U.S. Food and Drug Administration, Rockville, MD: Center for Devices and Radiological Health; 1997. [Google Scholar]
- 6.Church C C. J Acoust Soc Am. 1995;97:1510–1521. [Google Scholar]
- 7.Miller D L, Thomas R M. Ultrasound Med Biol. 1995;21:1059–1065. doi: 10.1016/0301-5629(95)93252-u. [DOI] [PubMed] [Google Scholar]
- 8.Miller D L. Ultrasound Med Biol. 1987;13:443–470. doi: 10.1016/0301-5629(87)90110-4. [DOI] [PubMed] [Google Scholar]
- 9.Crum L A, Roy R A, Dinno M A, Church C C, Apfel R E, Holland C K, Madanshetty S I. J Acoust Soc Am. 1992;91:1113–1119. doi: 10.1121/1.402638. [DOI] [PubMed] [Google Scholar]
- 10.Fowlkes J B, Hwang E Y. In: Safety of Diagnostic Ultrasound. Barnett S, Kossoff G, editors. New York: Parthenon; 1998. pp. 73–85. [Google Scholar]
- 11.American Institute of Ultrasound in Medicine. J Ultrasound Med. 2000;19:67–168. doi: 10.7863/jum.2000.19.2.149. [DOI] [PMC free article] [PubMed] [Google Scholar]
- 12.Miller D L. In: The Safe Use of Ultrasound In Medical Diagnosis. ter Haar G, Duck F, editors. London: The British Medical Ultrasound Society/The British Institute of Radiology; 2000. pp. 72–85. [Google Scholar]
- 13.Brayman A A, Azadniv M, Cox C, Miller M W. Ultrasound Med Biol. 1996;22:927–938. doi: 10.1016/0301-5629(96)00108-1. [DOI] [PubMed] [Google Scholar]
- 14.Miller D L, Gies R A, Chrisler W B. Ultrasound Med Biol. 1997;23:625–633. doi: 10.1016/s0301-5629(97)00042-2. [DOI] [PubMed] [Google Scholar]
- 15.Miller D L, Gies R A. Ultrasound Med Biol. 1998;24:285–292. doi: 10.1016/s0301-5629(97)00267-6. [DOI] [PubMed] [Google Scholar]
- 16.Miller D L, Bao S. J Acoust Soc Am. 1998;103:1183–1189. doi: 10.1121/1.421250. [DOI] [PubMed] [Google Scholar]
- 17.Miller D L, Quddus J. Ultrasound Med Biol. 2000;26:661–667. doi: 10.1016/s0301-5629(99)00170-2. [DOI] [PubMed] [Google Scholar]
- 18.Brayman A A, Lizotte L M, Miller M W. Ultrasound Med Biol. 1999;25:1305–1320. doi: 10.1016/s0301-5629(99)00076-9. [DOI] [PubMed] [Google Scholar]
- 19.Dalecki D, Raeman C H, Child S Z, Penny D P, Mayer R, Carstensen E L. Ultrasound Med Biol. 1997;23:1435–1439. doi: 10.1016/s0301-5629(97)00151-8. [DOI] [PubMed] [Google Scholar]
- 20.Dalecki D, Raeman C H, Child S Z, Penny D P, Carstensen E L. Ultrasound Med Biol. 1997;21:1405–1412. doi: 10.1016/s0301-5629(97)00142-7. [DOI] [PubMed] [Google Scholar]
- 21.Miller D L, Gies R A. J Urol. 1999;162:606–609. [PubMed] [Google Scholar]
- 22.Miller D L, Gies R A. Ultrasound Med Biol. 1998;24:1201–1208. doi: 10.1016/s0301-5629(98)00063-5. [DOI] [PubMed] [Google Scholar]
- 23.Miller D L, Gies R A. Ultrasound Med Biol. 2000;26:307–313. doi: 10.1016/s0301-5629(99)00138-6. [DOI] [PubMed] [Google Scholar]
- 24.Dalecki D, Raeman C H, Child S Z, Cox C, Francis C W, Meltzer R S, Carstensen E L. Ultrasound Med Biol. 1997;23:307–313. doi: 10.1016/s0301-5629(96)00203-7. [DOI] [PubMed] [Google Scholar]
- 25.Killam A L, Greener Y, McFerran B A, Maniquis J, Bloom A, Widder K J, Dittrich H C. J Ultrasound Med. 1998;17:349–356. doi: 10.7863/jum.1998.17.6.349. [DOI] [PubMed] [Google Scholar]
- 26.Skyba D M, Price R J, Linka A Z, Skalak T C, Kaul S. Circulation. 1998;98:290–293. doi: 10.1161/01.cir.98.4.290. [DOI] [PubMed] [Google Scholar]
- 27.Price R J, Skyba D M, Kaul S, Skalak T C. Circulation. 1998;98:1264–1267. doi: 10.1161/01.cir.98.13.1264. [DOI] [PubMed] [Google Scholar]
- 28.Udaka K, Takeuchi Y, Movat H Z. Proc Soc Exp Biol Med. 1970;133:1384–1387. doi: 10.3181/00379727-133-34695. [DOI] [PubMed] [Google Scholar]
- 29.Madsen E L, Frank G R, Dong F. Ultrasound Med Biol. 1998;24:535–542. doi: 10.1016/s0301-5629(98)00013-1. [DOI] [PubMed] [Google Scholar]


