Abstract
Background
There is a recent focus on embolization of the portal vein by transplanted islets as a major cause of early graft loss. The resultant ischemia causes necrosis and/or apoptosis of cells within the liver. Thus, non-invasive assessment of the liver receiving the islet transplant is important to evaluate the status islet grafts.
Methods
In this study, we utilized non-invasive magnetic resonance imaging (MRI) for assessment of the post-transplant ischemic liver. Syngeneic islets in streprozotocin-induced diabetic mice were utilized. MRI and morphological liver assessments were performed at 0, 2, and 28 days after transplantation. Histological assessment of insulin, hypoxia induced factor 1-α and apoptosis were undertaken at similar time-points.
Results
Ischemic/necrotic regions in the liver were detected with MRI at 2 but not at 28 days after transplantation and were confirmed histologically. Liver injury was quantified from high intensity areas on T2-weighted images. Insulin release showed a peak 2 days after transplantation.
Conclusion
Onset and reversal of liver ischemia due to intraportal islet transplantation are detectable using T2-weighted MRI. These changes coincide with periods of maximum insulin release likely due to partial islet destruction. We propose that MRI, as a noninvasive monitor of graft-related ischemia, may be useful in assessment of liver and islet engraftment after intraportal islet transplantation in a clinical setting.
Keywords: islet transplantation, imaging, intraportal transplantation, liver ischemia
INTRODUCTION
Advances in the isolation procedure and regime of immunosuppression have significantly improved the therapeutic effect of clinical intraportal islet transplantation (1–3). Recently, 1-year graft survival is 80–90% (3,4) and 1-year insulin-independence exceeds 60% (3). Though islet transplantation is gradually being recognized as a useful therapy for type 1 diabetes mellitus (T1DM), there are many hurdles to resolve.
One of the challenges for islet transplantation is the limited donor pool. It is frequently necessary to transplant islets from two to four donor pancreata to achieve normoglycemia (1,5). It is estimated that approximately 60% of islets fail to engraft following intraportal islet transplantation (5,6). Recently, embolization of the portal vein by the islets themselves has been identified as a major cause of early islet graft loss (5,7). Transplanted islets can obstruct vessels causing ischemia of surrounding liver tissue. This subsequently causes necrosis and/or apoptosis of liver cells, and in combination with the immediate blood-mediated inflammatory reaction (IBMIR), leads to injury of the islet graft (5). In clinical practice, intraportal thrombosis is very rare (0.5%) (4). However, non life-threatening micro-thrombosis may occur as evidenced by elevated liver enzymes (5). Hence, early graft failure is influenced not only by the islet quality but also by the physiological response of the transplant site.
If early reversible graft or host compromise could be detected non-invasively by magnetic resonance imaging (MRI), there may be an opportunity to intervene pharmacologically to enhance long-term graft outcome. In this study, we evaluated the impact of islet transplantation on liver ischemia and islet necrosis using T2-weighted MRI. We performed liver MRI at early and late stages after islet transplantation, and compared MRI data with histological and islet function findings. We used a murine model to test our hypothesis and these data may serve as a foundation for promoting future MRI trials in human recipients of islet transplants.
MATERIAL AND METHODS
Animals
BALB/c female mice weighing 22–27g (Charles River Laboratories. Inc., Boston, MA, USA) were used as both donors and recipients. The mice were housed under pathogen-free conditions with a 12-hour light cycle and free access to food and water. All animal care and treatment procedures were in accordance with institutional regulations and the Institutional Animal Care Use Committee approved the subsequent experimental protocol.
Induction of diabetes in recipient mice
Streptozotocin (STZ, 200 mg/kg/mouse, Sigma-Aldrich, St. Lois, MO, USA) was injected intraperitoneally. Blood glucose levels were measured by Accu-chek Advantage glucose monitors (Roche, Indianapolis, IN, USA) and diabetes was diagnosed when the blood glucose level was greater than 250 mg/dL.
Islet isolation and transplantation
Murine islets were isolated by collagenase (collagenase V, Sigma-Aldrich) digestion, separation by Ficoll (Sigma-Aldrich) discontinuous gradients and purification. The isolated islets were cultured at 37°C in 5% CO2/95% air overnight (8–10). After culture, we performed syngeneic islet intraportal transplantation into diabetic mice (11). Fifteen mice were transplanted with 800 islet equivalents (IEQ=150µm) per recipient. IEQ’s were calculated by measuring islet size via a microscope. We first collected 133–200 µm (4–6 mm in 30X magnification) of islets then smaller and slightly larger islets next but rejected islets over 267µm in size (>8mm in 30X magnification). Transplanted mice were divided into three groups: 1) liver recovery at day of transplantation (day 0, n=7: this group served as the control), 2) early liver recovery, at postoperative day (POD) 2 (n=4) and 3) late liver recovery, at POD 28 (n=4).
Blood glucose and serum insulin levels
Eight transplanted mice (groups 2 and 3 above) had blood glucose and serum insulin levels compared at POD 0, 2 and 28. Serum insulin was measured with a rat/mouse insulin enzyme-linked immnosorbent assay kit (Linco, MO). Blood glucose levels were measured by Accu-chek Advantage glucose monitors.
MRI acquisition and analysis
At the end of each time point livers were harvested and photographs were taken prior to ex vivo MRI. Imaging was performed by Bruker Advance 11.7 T MRI (8.9-cm bore) with a 3.0 cm (internal diameter: ID) volume radiofrequency coil (Bruker Biospin, Billerica, MA, USA). Axial and coronal images were obtained. The T2-weighted MRI was comprised of a 10 echo sequence with a repetition time / echo time (TR/TE) of 4697/10 ms, a 2562 matrix, 3-cm field of view (FOV) with an acquisition time of 80 minutes (12). T2-weighted images were analyzed for regions of hyper-intensity indicative of edema formation as a consequence of liver ischemia.
Analysis of the T2-weighted images (T2WI) was performed manually drawing regions of hyperintensity (white) signals within the liver. The total liver volume was also extracted by outlining the contours of the liver. 3D reconstructions of these regions of interest were performed using Amira (Mercury Computer Systems, Inc.).
Histological assessment
After MRI examination, liver specimens were embedded in paraffin and cut in 5 µm sections. Specimens were stained for hematoxylin and eosin (H&E) for cellular changes, immunohistochemistry for insulin to identify islets, and hypoxia induced factor 1-α (HIF1-α) to indicate ischemic tissues. Primary antibodies were guinea pig anti-insulin antibody (Dako, Carpunteria, CA, USA) diluted with 1:100 and goat anti-HIF-1α antibody (Santa Cruz Inc., Santa Cruz, CA, USA) diluted 1:100. After incubating with biotinylated secondary IgG antibody (Vector Laboratories, Burlingame, CA, USA and Santa Cruz Inc.), the specimens were colored with a peroxidase substrate solution containing 3,3’-diaminobenzidine (DAB, Brown for HIF-1α, Dako) or AEC+ (Red for insulin, Dako) and counterstained with hematoxylin (8, 13). Apoptosis was detected by the TdT-mediated dUTP-biotin nick end labeling (TUNEL) method using an in situ apoptosis detection kit (Promega, Madison, WI, USA). Sections were treated with proteinase K (Dako) and incubated with TdT enzyme for 60 min at 37°C. After washing in PBS, the sections were further incubated with streptoavidin horseradish peroxidase (HRP) solution and visualized with DAB (13).
Islets and surrounding liver tissue were assessed for necrosis (which is defined as destruction of cell structure with granulation) and cellular infiltration (H&E), apoptosis (TUNEL), and ischemia (HIF1-α). Apoptosis of islets was expressed as the percentage of TUNEL positive relative to total islet cells (= [TUNEL positive cells] / [Total islet cells] X 100 (%)) because the islet is a cell cluster and we consider it better to use this method for assessment of apoptosis of islet. We counted 73 islets at POD 0, 34 islets at POD 2 and 25 islets at POD 28 for this assessment. Cell numbers in an islet were 2–140 (median 24). Necrosis, ischemia, apoptosis of hepatocytes around the transplanted islets and cellular infiltration of transplanted islets were scored as: zero (absent) or one (present). The mean histological change score was calculated.
Moreover, we measured the size of transplanted islets and diameter of the portal vein at the level of the islets using image analysis software (Image J ver. 1.40, NIH, USA). The ratio of islet size divided by portal vein diameter (= [islet size] / [portal vein diameter] X100 (%)) on POD2 was compared to the size and ratio between necrotic area and non-necrotic area. Necrotic areas were considered as the location of islet embolization.
Evaluation of relationship between MRI, islet parameters and histology
We compared the hyperintensity area in T2WI between the specimens with and without histological change (necrosis / ischemia / apoptosis). We also assessed the correlation between volume of hyperintensity and serum insulin level by simple regression analysis.
Statistical analysis
Histological and MRI data were expressed as mean ± standard error of the mean (SEM). An analysis of variance (ANOVA) followed by a Dunnet test was used for comparison among the three groups (POD 0, 2, 28). Student t test for comparison among two groups and differences were considered significant at p < 0.05.
RESULTS
Glucose and Insulin
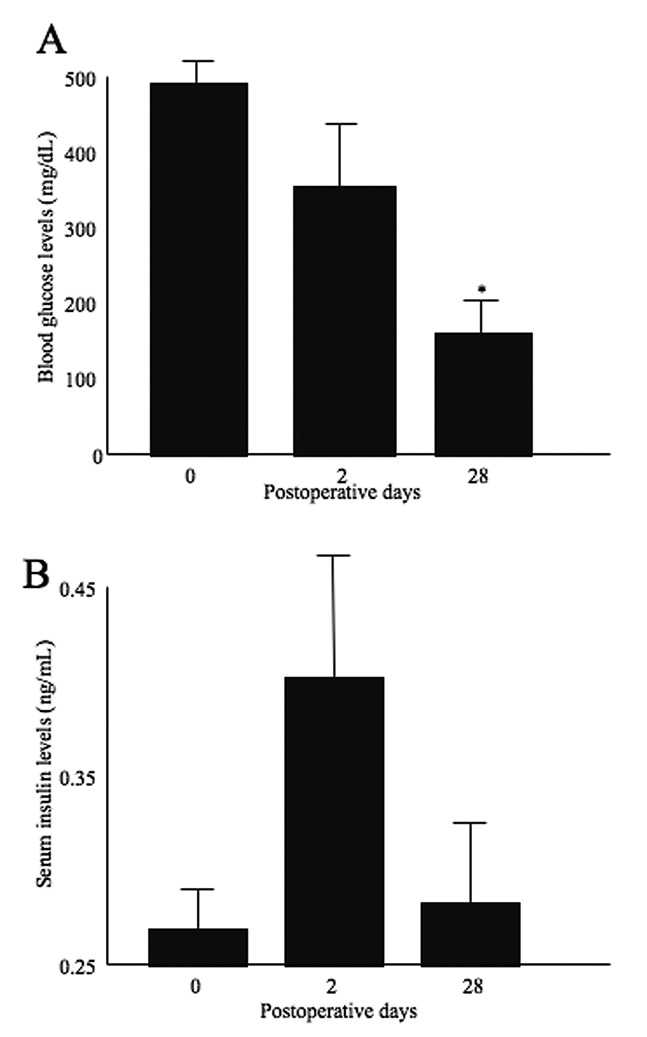
Following transplantation, blood glucose levels decreased and normalized at POD 28. There was a significant difference between POD 28 and POD 0 (Figure 1A). Serum insulin levels increased at POD 2, and decreased at POD 28 (Figure 1B).
Figure 1.
Blood glucose levels (A) and serum insulin levels (B). Blood glucose was decreased and normalized at POD 28. Serum insulin levels were elevated at POD 2 and then decreased at POD28. Statistical assessment was performed by Dunnet test. Significant difference was p<0.05 (indicated as *).
MRI of the liver
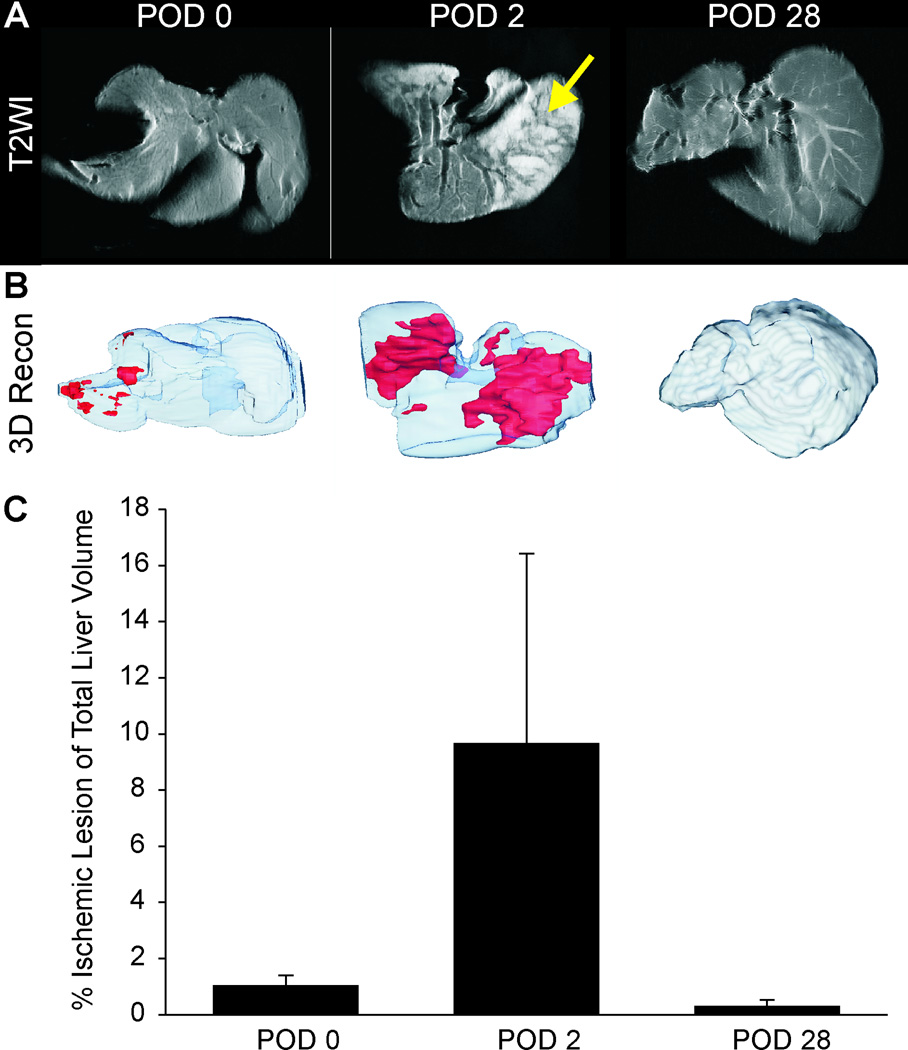
MRI examination at POD 0 showed uniform T2 signal intensity within the liver. There were no regions of hyperintensity that would be indicative of edema formation as a result of ischemia (Figure 2A). At POD 2, large regions of hyperintensities were observed interspersed with normal contrast regions in some livers (Figure 2A). At POD 28, no regions of hyperintensity could be visualized, similar to POD 0 (Figure 2A), consistent with little or no edema formation. Volumetric reconstructions illustrate the large regions of edema (ischemia; red) at POD 2 that were not observed at either the POD 0 or 28 animals (Figure 2B). While no statistical significance was found (Figure 2C), there was a clear trend to increased T2 hyperintensities at POD 2, a time when significant histological evidence supports post-transplant ischemia (Figure 4).
Figure 2.
T2-weighted MRI revealed a uniform contrast level within livers at POD 0 (A). At POD 2, regions of hyperintensity (arrow) were seen at the same location as necrotic areas of the liver. These findings are consistent with necrotic changes. At POD 28 there were no visible regions of hyperintensity on T2WI. (B) 3D volumetric assessment of ischemic liver reveals the percentage of hyperintensities within the liver that increased from a maximum at POD 2 but then decreased to control levels by POD 28. (C) Quantification of ischemic lesion volume showed a large increase at POD 2 that returned to control levels at POD 28.
Figure 4.
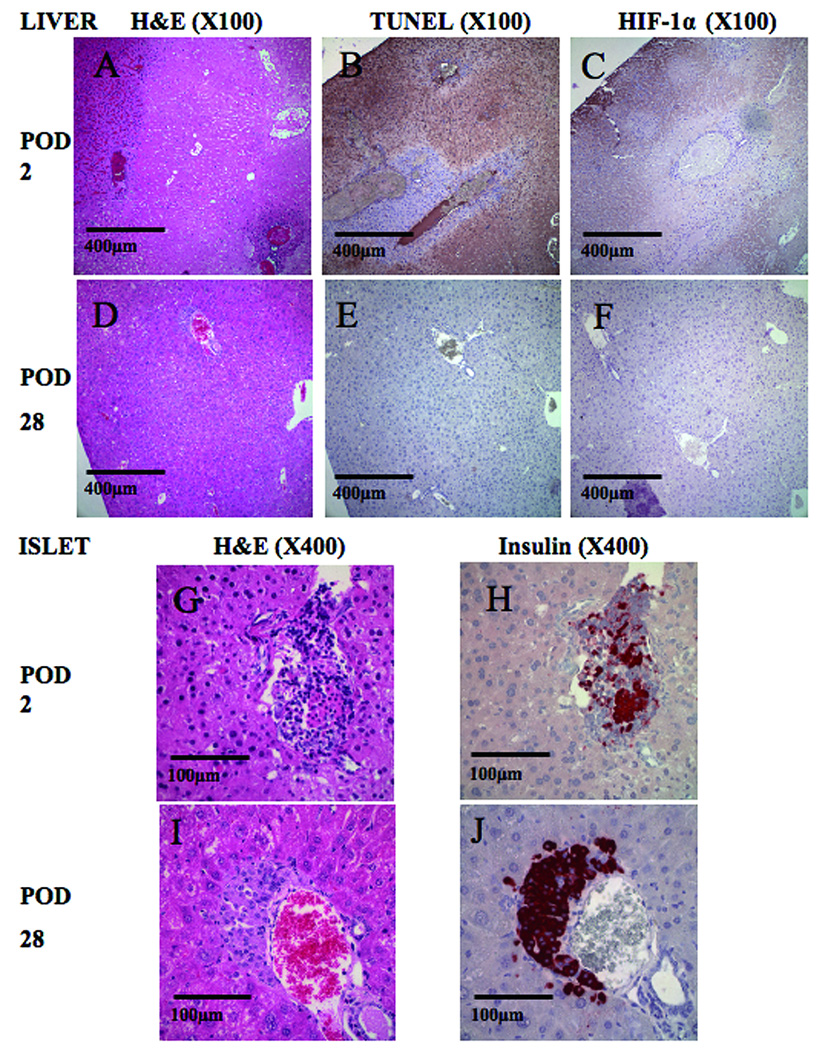
Histological findings after islet transplantation (A–C, G and H). There were some necrotic areas at POD 2 (A: H&E staining). Apoptosis (B: TUNEL staining) and ischemic changes (C: immunostaining for HIF-1α) was also detected at the same lesion location as necrosis. In high magnification (X400), we detected cellular infiltration into transplanted islets (G: H&E staining and H: immunostaining for insulin). Histological findings at POD 28 (D–F, I and J). There was no necrotic (D: H&E staining), apoptotic (E: TUNEL staining) nor ischemic change (F: immunostaining for HIF-1α). Transplanted islets were intact (I: H&E staining and J: immunostaining for insulin). Original magnifications were X100 (A–F) and X400 (G–J).
Liver Morphology
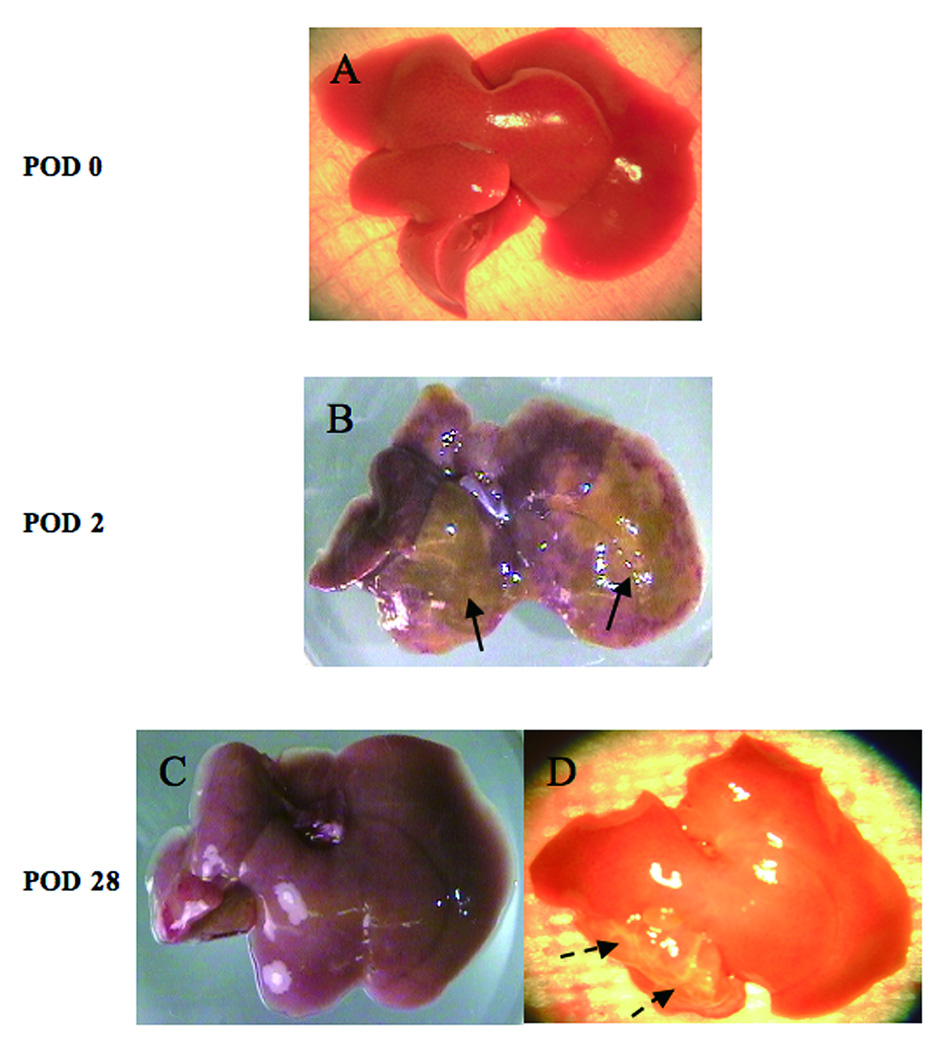
Figure 3 reveals the findings of pre-fixed livers at each time point. There was no prominent ischemia at transplantation (Figure 3A). At POD 2, some visual ischemia/necrosis could be observed (Figure 3B). These changes were either invisible (Figure 3C) or appeared as scars (Figure 3D) at POD 28.
Figure 3.
Photomicrographs of fresh livers. There were no prominent visible ischemic area(s) in the liver at transplantation (POD 0)(A). Some ischemic / necrotic areas can be seen in the liver (arrows) at POD 2. (B). Ischemic changes, detected at the POD 2 of transplantation, were almost invisible (C) or turned to scars (dotted arrows, D) at POD 28.
Histology
The structure of the liver did not exhibit necrotic, apoptotic or ischemic changes immediately following transplantation. Transplanted islets were insulin positive and there was no cellular infiltration (data not shown). Examination of the same areas at POD 2 showed necrosis (Figure 4A), apoptosis (Figure 4B) and ischemia (Figure 4C). Cellular infiltration was observed in islets and parts of the liver tissue (Figure 4G and H). In contrast to the early POD 2 results, at POD 28 there were no necrosis (Figure 4D), apoptosis (Figure 4E), ischemia (Figure 4F) or cellular infiltration in islets (Figure 4I and J). Areas of connective tissue were observed at POD 28 (data not shown). Histological scoring of all measures (necrosis, ischemia, liver apoptosis and cellular infiltration in islet) were significantly increased at POD 2 relative to POD 0 and 28 (Table 1A). The percentage of apoptoic islets was also significantly increased (62.0±7.4 %) at POD 2 and returned to 0% at POD 28 (Table 1A). Though there is no significant difference between necrotic and non-necrotic area in islet size, we detected significant differences in portal vein diameter and ratio of islet size / portal vein diameter (Table 1B). It revealed that islet embolization tended to occur in portal veins with a smaller diameter and with a higher ratio of islet size / portal vein diameter.
Table 1.
Histological assessment of the liver and islet after transplantation.
| A. Comparison among each time points in histological changes. | |||
|---|---|---|---|
| At transplantation (POD0) | Early stage (POD2) | Late stage (POD28) | |
| (n=73) | (n=34) | (n=25) | |
| Liver: Necrosis | 0/73 (0±0) | 23/34 (0.68±0.08)*§ | 0/25 (0±0) |
| Liver: Hypoxia | 0/73 (0±0) | 24/34 (0.71±0.08)*§ | 0/25 (0±0) |
| Liver: Apoptosis | 2/73 (0.03±0.02) | 25/34 (0.74±0.08)*§ | 0/25 (0±0) |
| Islet: Cellular Infiltration | 0/73 (0±0) | 15/34 (0.44±0.09)*§ | 0/25 (0±0) |
| Islet: Apoptosis (%) | 5.65±2.04 | 62.00±7.41*§ | 0±0 |
| B. Comparison between necrotic / non-necrotic area in islet size, portal vein diameter and percentage of islet size and portal vein diameter. | |||
|---|---|---|---|
| Islet size diameter (µm) | Portal vein (µm) | Ratio (%) | |
| Necrotic area (n=23) | 57.56±6.69 | 70.61±7.02 | 85.78±2.70 |
| Non-necrotic area (n=11) | 68.62±19.51 | 155.83±41.67* | 56.96±9.25* |
Histological change score was indicated as: islet numbers accompanied with histological change (necrosis, hypoxia, apoptosis and cellular infiltration) / total islet numbers (mean score ± standard error of the mean (SEM)), except Islet Apoptosis (%). Islet Apoptosis (%) was indicated as the percentage of apoptotic to total islet cells. “n” is total islet number.
significant difference (p<0.05), at the early stage vs. at transplantation.
significant difference, at the early stage vs. at the late stage.
We measured islet and portal vein size and its ratio (= (islet size / portal vein diamter) X 100) from islet in POD2.
significant difference (p<0.05), comparing necrotic with non-necrotic area.
Relation between MRI, islet parameters and histology
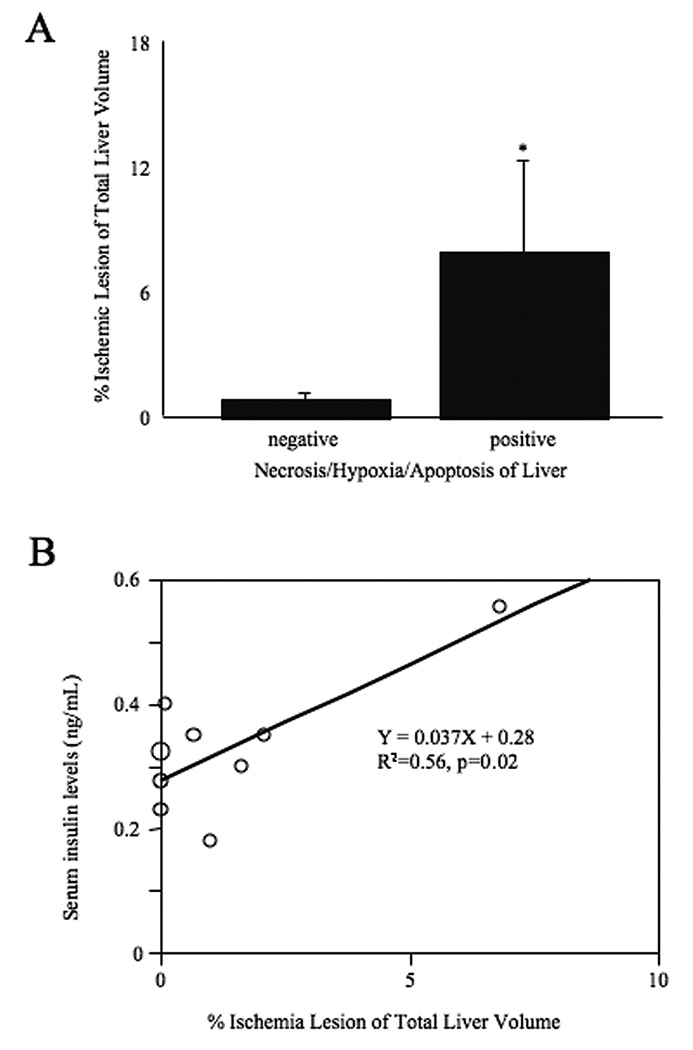
The ischemic area on T2WI was significantly higher in the livers with necrosis / ischemia / apoptosis (i.e. POD 2) than those without findings (i.e. POD 0 and POD 28) (Figure 5A). Data revealed that serum insulin levels significantly correlated with the percentage of T2 hyperintensities on MRI (R2 = 0.56, p = 0.02: Figure 5B) consistent with the histological findings of increased hypoxia and apoptosis.
Figure 5.
A. Comparison ischemic lesion of liver ischemic volume (indicated as hyperintensity area in T2WI) with and without histological findings (necrosis / ischemia / apoptosis). The group with positive histological findings at POD 2 was significantly higher than negative group at POD 0 and POD 28). Statistical assessment was performed by Student t test. Significance indicated as *, p<0.05. B. Correlation between ischemic lesion and serum insulin levels. Data revealed that serum insulin levels significantly correlated with ischemic lesion (R2 = 0.56, p = 0.02). Statistical analysis was performed by simple regression analysis.
DISCUSSION
This study reports the novel finding that T2-weighted MRI can readily identify ischemic regions within the liver undergoing apoptosis after islet transplantation. While there are some MRI studies assessing islet numbers (14–16) very few have focused on imaging the transplant site but used instead limited measures such as liver enzymes (17, 18). Our report is one of the few studies using MRI for assessment of changes in murine livers receiving intraportal islet transplantation.
In our study, histological damage was detectable and temporally consistent with high intensity areas on T2 MRI. When no ischemic / necrotic / apoptotic areas were seen in the liver (Figure 3A and Table 1), MRI examination did not show regions of hyperintensity on T2WI with a uniform contrast inside the liver (Figure 2A). This would suggest that ischemic and inflammatory changes do not occur in the immediate (POD 0) post-transplant period. The earliest time-point in which these ischemic changes were detected was at 12 hours after transplantation (data not shown).
Serum insulin levels increased rapidly at POD 2 (Figure 1B) as did the percentage of hyperintense areas on T2WI (Figure 2A–C). These findings suggest that transplanted islets embolized the portal vein resulting in liver hypoxia in the regions around the islets. Ischemia subsequently led to necrosis and apoptosis of both liver tissue and islets, which was visualized as hyperintense areas on T2WI (Figure 2A). We speculate that islet damage and leakage of insulin are the likely cause in transient serum insulin elevations at POD 2. This would suggest that the islets and the recipient livers are most at risk during the 12 to 48-hour time-point after transplantation. Lack of signal change on T2 at a time-point of euglycemia (POD 28, Figure 2C) and histological recovery (Figure 4D–F, G and J) would suggest that MRI can be used to monitor islet and liver ischemic and regenerative dynamics. Furthermore, MRI can be used to quantify the extent of damage or recovery via 3D imaging (Figure 2). Future studies are needed to test the ability of MRI to predict liver function as well as islet health (liver enzymes and glucose tolerance) after transplantation.
MRI is considered essential for detection of tumors or tissue ischemia and the safety and non-invasiveness is already known in the clinical setting. Gadolinium is a contrast media that clarifies hyper and hypovascular lesions and has been used for identification of some diseases (19–21). Our data suggest that MRI is useful for assessment of ischemic / necrotic / apoptotic areas of the liver after islet transplantation and we suggest that gadolinium enhancement could be applied not only for assessment of islet vascularization (12), but also for detection of liver ischemia due to islet embolization as liver perfusion defects. We used ex vivo livers in the present study, because of the difficulty to evaluate the accuracy and volumes of hyperintense areas on T2WI in living mice due to physiological movement of the liver (ie. respiration etc). Movement of the liver could be prevented in humans because humans can control their breathing rate during the MRI examination.
Embolization due to islet transplantation is more likely to occur in rodents compared with humans because of the size of the portal vein. While the size of islets is not so much different between murine and human, the size of portal vein is significantly different. In our observations the size of murine intrahepatic portal vein is few µm to 2–3 mm, while in the human the size of the intrahepatic portal vein is approximately 10 mm. Lehmann and colleagues reported a range of sizes for swine intrahepatic portal veins (500µm-12mm) (22). Nevertheless, embolization due to islet transplantation has been described in the clinical setting (7) and hence merits prediction and prevention. We measured islet graft size and portal vein diameter at the location of the transplanted islets, calculated the ratio of islet size to portal vein diameter and as expected, a higher diameter of portal vein and subsequent lower ratio tended to prevent islet embolization (Table 1B). Based on this finding, we suggest that smaller islets more suitable for preventing embolization in the murine model and that this is also applicable to humans.
We did not study humans because we have no facility for human islet isolation and clinical transplantation, but we propose that a similar approach using MRI in living human recipients may prove beneficial for monitoring islet graft health. Therefore, this approach may contribute to improved outcomes of clinical islet transplantation. Only recently has MRI examination has been applied clinically though not in the context of tissue ischemia but rather localization of islet transplants (23). In summary we have shown that reversible islet and liver ischemic changes were detectable and quantifiable by ex-vivo MRI. This methodology awaits validation in vivo as a more clinically relevant tool to monitor the dynamics of ischemic and regenerative graft and host environments.
ACKNOWLEDGEMENT
This work was supported by NIH/NIDDK Grant # 1R01-DK077541 [EH] and research fellowship of the Uehara Memorial Foundation [NS]. We are very appreciative of the microsurgical technical support of John Chrisler, and the kind help in specimen processing by John Hough.
Authorship: NS designed and performed the study and wrote the initial draft of the manuscript. PH performed the MRI work and data extraction. AT, NC, JM, RP, LS, WP, and RC helped with the overall project. AO supervised the MRI work and helped in writing the MRI portion. EH helped with the design, supervised data collection, and wrote the final version of the manuscript.
Funding sources: NIH/NIDDK Grant # 1R01-DK077541 [EH] and Uehara Memorial Foundation Research Fellowship [NS]
ABBREVIATIONS
- ANOVA
analysis of variance
- DAB
3,3’-diaminobenzidine
- FOV
field of view
- H&E
hematoxylin and eosin
- HRP
horseradish peroxidase
- IBMIR
immediate blood-mediated inflammatory reaction
- ID
internal diameter
- IEQ
islet equivalent
- MRI
magnetic resonance imaging
- POD
postoperative day
- SEM
standard error of the mean
- STZ
streptozotocin
- T1DM
type 1 diabetes mellitus
- T2WI
T2-weighted images
- TR/TE
repetition time / echo time
- TUNEL
TdT-mediated dUTP-biotin nick endlabeling
REFERENCES
- 1.Shapiro AM, Lakey JR, Ryan EA. Islet transplantation in seven patients with type 1 diabetes mellitus using a glucocorticoid-free immunosuppressive regimen. N Engl J Med. 2000;343:230. doi: 10.1056/NEJM200007273430401. [DOI] [PubMed] [Google Scholar]
- 2.Newsletter No.9. Giessen: Internationa Islet Transplnat Registry; 2001. [Google Scholar]
- 3.Ryan EA, Paty BW, Senior PA. Five-year follow-up after clinical islet transplantation. Diabetes. 2005;54:2060. doi: 10.2337/diabetes.54.7.2060. [DOI] [PubMed] [Google Scholar]
- 4.Shapiro AM, Nanji SA, Lakey JR. Clinical islet transplant: current and future directions towards tolerance. Immunol Rev. 2003;196:219. doi: 10.1046/j.1600-065x.2003.00085.x. [DOI] [PubMed] [Google Scholar]
- 5.Yin D, Ding JW, Shen J, Ma L, Hara M, Chong AS. Liver ischemia contributes to early islet failure following intraportal transplantation: benefits of liver ischemic-preconditioning. Am J Transplant. 2006;6:60. doi: 10.1111/j.1600-6143.2005.01157.x. [DOI] [PubMed] [Google Scholar]
- 6.Biarnés M, Montolio M, Nacher V, Raurell M, Soler J, Montanya E. Beta-cell death and mass in syngeneically transplanted islets exposed to short- and long-term hyperglycemia. Diabetes. 2002;51:66. doi: 10.2337/diabetes.51.1.66. [DOI] [PubMed] [Google Scholar]
- 7.Hyon SH, Ceballos MC, Barbich M. Effect of the embolization of completely unpurified islets on portal vein pressure and hepatic biochemistry in clinical practice. Cell Transplant. 2004;13:61. doi: 10.3727/000000004772664905. [DOI] [PubMed] [Google Scholar]
- 8.Miao G, Mace J, Kirby M. In vitro and in vivo improvement of islet survival following treatment with nerve growth factor. Transplantation. 2006;81:519. doi: 10.1097/01.tp.0000200320.16723.b3. [DOI] [PubMed] [Google Scholar]
- 9.Inoue K, Fujisato T, Gu YJ. Experimental hybrid islet transplantation: application of polyvinyl alcohol membrane for entrapment of islets. Pancreas. 1992;7:562. [PubMed] [Google Scholar]
- 10.Sakata N, Egawa S, Sumi S, Unno M. Optimization of glucose level to determine the stimulation index of isolated rat islets. Pancreas. 2008;36:417. doi: 10.1097/MPA.0b013e31815ccad2. [DOI] [PubMed] [Google Scholar]
- 11.Yonekawa Y, Okitsu T, Wake K. A new mouse model for intraportal islet transplantation with limited hepatic lobe as a graft site. Transplantation. 2006;82:712. doi: 10.1097/01.tp.0000234906.29193.a6. [DOI] [PubMed] [Google Scholar]
- 12.Hathout E, Sowers L, Wang R. In vivo magnetic resonance imaging of vascularization in islet transplantation. Transpl Int. 2007;20:1059. doi: 10.1111/j.1432-2277.2007.00550.x. [DOI] [PMC free article] [PubMed] [Google Scholar]
- 13.Miao G, Ostrowski RP, Mace J. Dynamic production of hypoxia-inducible factor-1alpha in early transplanted islets. Am J Transplant. 2006;6:2636. doi: 10.1111/j.1600-6143.2006.01541.x. [DOI] [PubMed] [Google Scholar]
- 14.Koblas T, Girman P, Berkova Z. Magnetic resonance imaging of intrahepatically transplanted islets using paramagnetic beads. Transplant Proc. 2005;37:3493. doi: 10.1016/j.transproceed.2005.09.142. [DOI] [PubMed] [Google Scholar]
- 15.Kriz J, Jirák D, Girman P. Magnetic resonance imaging of pancreatic islets in tolerance and rejection. Transplantation. 2005;80:1596. doi: 10.1097/01.tp.0000183959.73681.b9. [DOI] [PubMed] [Google Scholar]
- 16.Evgenov NV, Medarova Z, Pratt J. In vivo imaging of immune rejection in transplanted pancreatic islets. Diabetes. 2006;55:2419. doi: 10.2337/db06-0484. [DOI] [PubMed] [Google Scholar]
- 17.Rafael E, Ryan EA, Paty BW. Changes in liver enzymes after clinical islet transplantation. Transplantation. 2003;76:1280. doi: 10.1097/01.TP.0000098822.85924.4C. [DOI] [PubMed] [Google Scholar]
- 18.Fukuda K, Asoh S, Ishikawa M, Yamamoto Y, Ohsawa I, Ohta S. Inhalation of hydrogen gas suppresses hepatic injury caused by ischemia/reperfusion through reducing oxidative stress. Biochem Biophys Res Commun. 2007;361:670. doi: 10.1016/j.bbrc.2007.07.088. [DOI] [PubMed] [Google Scholar]
- 19.Verma SK, Mitchell DG, Lakhman Y. Paraumbilical collateral veins on MRI as possible protection against portal venous thrombosis in candidates for liver transplantation. Abdom Imaging. 2008;33:536. doi: 10.1007/s00261-007-9333-y. [DOI] [PubMed] [Google Scholar]
- 20.Chen F, Suzuki Y, Nagai N. Visualization of stroke with clinical MR imagers in rats: a feasibility study. Radiology. 2004;233:905. doi: 10.1148/radiol.2333031658. [DOI] [PubMed] [Google Scholar]
- 21.Menezes NM, Connolly SA, Shapiro F. Early ischemia in growing piglet skeleton: MR diffusion and perfusion imaging. Radiology. 2007;242:129. doi: 10.1148/radiol.2421050680. [DOI] [PubMed] [Google Scholar]
- 22.Lehmann KS, Ritz JP, Valdeig S. Portal vein segmentation of a 3D-planning system for liver surgery--in vivo evaluation in a porcine model. Ann Surg Oncol. 2008;15:1899. doi: 10.1245/s10434-008-9934-x. [DOI] [PubMed] [Google Scholar]
- 23.Toso C, Vallee JP, Morel P. Clinical magnetic resonance imaging of pancreatic islet grafts after iron nanoparticle labeling. Am J Transplant. 2008;8:701. doi: 10.1111/j.1600-6143.2007.02120.x. [DOI] [PubMed] [Google Scholar]


