

Abstract
Fast, continuous separation of mitochondria from rat myoblasts using micro free-flow electrophoresis (μFFE) with online laser induced fluorescence detection (LIF) is reported. Mitochondrial electrophoretic profiles were acquired in less than 30s. Compared to macroscale FFE instruments, μFFE devices consumed approximately 100-fold less sample, used 10-fold less buffer and required a 15-fold lower electric field. Mitochondrial electrophoretic mobility distributions measured using μFFE were compared to those measured with a capillary electrophoresis instrument with laser induced fluorescence detection (CE-LIF). There was high similarity between the two distributions with CE-LIF distribution being offset by 1.8×10⁻⁴ cm2V−1s−1 with respect to the μFFE distribution. We hypothesize that this offset results from the differences in electric field strength used in the techniques. Compared to CE-LIF, analysis of mitochondria using μFFE greatly decreased separation time and required less separation voltage, while maintaining low sample (125 nL) and buffer (250 μL) volumes. These features together with the potential for collecting separated organelle fractions for further characterization make μFFE a very attractive tool for the high-throughput analysis of organelle subpopulations as well as investigating the fundamentals of the electrophoretic mobility of biological particles.
INTRODUCTION
Mitochondria are important organelles that are involved in a range of cellular processes, such as oxidative phosphorylation1, cell signaling2, electron transport3 and apoptosis4. Variations in mitochondrial structure, morphology and function may define mitochondrial subpopulations that, if separated, may help understand the role of mitochondria in degenerative disorders5, cancer6 and senescence7.
Fluorescence and electron microscopy can be used to measure mitochondrial properties, such as membrane potential, in vivo8. These techniques have also been useful for identifying mitochondrial subpopulations (e.g. giant mitochondria)9. Further characterization of mitochondrial subpopulations (e.g. characterization of their proteome) requires isolation of mitochondrial subpopulations. Since the mitochondrial surface has a net negative charge at biological pH, electrophoresis could be used as the basis of their separation10,11. Differences in the composition of the mitochondrial outer membrane gives rise to different surface charge densities and therefore different electrophoretic mobilities12,13. Based on this principle, free flow electrophoresis (FFE) has become a well-established method for mitochondrial purification14–16. In FFE, a sample stream is continuously introduced into a separation chamber filled with buffer flowing under laminar flow conditions. Voltage is applied perpendicularly to the flow in the chamber and charged species are diverted into discrete streams according to their mobilities in the electric field. The main benefit of FFE separation is the capability to continuously collect distinct fractions for subsequent analyses. However, commercial FFE instruments consume large amounts of sample (e.g ~ milliliters), which is a limiting factor when only small amounts of sample are available (e.g. rare cells or small tissue biopsies).
Integration of FFE onto microfluidic devices has gained much attention recently due to potential performance improvements over preparative FFE17,18. FFE in a microfluidic format (μFFE) offers several advantages over conventional FFE including lower buffer and sample consumption, increased separation speed, better heat dissipation, capability of monitoring separations online and detection limits in the nanomolar range19,20. An elegant proof of principle of the use of a μFFE device in the analysis of organelles used free flow isoelectric focusing21.
In this report, we demonstrate a fast, continuous electrophoretic separation of mitochondria using a μFFE device with online laser-induced fluorescence detection (μFFE-LIF). Microliter sample volumes containing fluorescently labeled mitochondria isolated from L6 rat myoblasts are continuously streamedinto the μFFE device. Electrophoretic mobility profiles are obtained using real-time observation of the separation process. These profiles are similar to those obtained with CE-LIF.
EXPERIMENTAL SECTION
Chemicals and reagents
Fluorescein and 10-N-nonyl-acridine orange (NAO) were purchased from Invitrogen (Eugene, OR). Sucrose was purchased from Roche (Indianapolis, IN). Digitonin was obtained from Calbiochem (San Diego, CA). DMSO and ethanol were purchased from Fisher Scientific (Pittsburgh, PA). D-mannitol was purchased from Riedel de-Haën (Seelze, Germany). Poly(vinyl alcohol) (99% hydrolyzed; Mw 31–50 kDa), trypsin solution (10×, 5 g/L trypsin, 2 g/L EDTA•4 Na, 8.5 g/L NaCl), N-(2-hydroxyethyl)(piperazine)-N-(ethanesulfonic acid) (HEPES), phosphate-buffered saline (10× PBS, containing 100 mM KH2PO4/Na2HPO4 solution, pH 7.4, 27 mM KCl, 1370 mM NaCl), potassium hydroxide (KOH), hydrochloric acid (HCl), Tryphan Blue and polyvinylalcohol (PVA, 99% hydrolyzed; MW: 31–50 kDa) were purchased from Sigma (St. Louis, MO). Geneticin, Dulbecco’s modified Eagle medium (DMEM) and calf serum were purchased from Gibco. Stock solutions of 1 mM fluorescein and NAO were made in ethanol and DMSO, respectively. The stock solution of 100 g/L digitonin was prepared in DMSO and diluted to 10 mg/mL in buffer M before using.
Buffers
Mitochondria isolation buffer (buffer M) contained 70 mM sucrose, 5 mM HEPES, 5 mM EDTA and 210 mM mannitol. Free-flow electrophoresis buffer (FFE buffer) contained 250 mM sucrose and 10 mM HEPES (pH=7.40). Capillary electrophoresis buffer (CE buffer) was prepared by dissolving 0.2% (v/v) PVA in FFE buffer. All buffers were prepared in Milli-Q water, filtered with 0.22 μm membrane filter and their pH adjusted to 7.4 by 1M KOH.
Cell culture
Adherent L6 rat myoblasts were cultured in DMEM medium with 10% bovine serum at 37 °C and 5% CO2 in 75 cm2 vented flasks and split after reaching 90% confluence every 3 to 4 days. For splitting, L6 cells were rinsed with PBS, lifted with 5 mL of 0.25 g/L trypsin for 5 min and diluted in fresh mediumin 1:20 –1:40 ratio.
Mitochondria preparation
All operations during mitochondria sample preparations were performed on ice. Cells were harvested using 5 mL of of 0.25 g/L trypsin and washed three times with cold buffer M, counted using a Fuchs-Rosenthal hemocytometer (Hausser Scientific, Horsham, PA) and diluted to 5.1×10⁶ cells/mL with buffer M. A 1 mL aliquot of cell suspension was mixed with 10 μL of 10 mg/L digitonin and kept incubated for 5 min on ice. After permeabilization, cells were gently disrupted by 6 strokes in a Dounce homogenizer with 0.0005–0.0025 in. clearance (Kontes, Vinland, NJ). Approximately 90% of cells were disrupted as observed by counting cells in an aliquot of the homogenate treated with Tryphan Blue. Crude mitochondrial fractions were prepared by differential centrifugation. Briefly, cell lysate was centrifuged at 600 × g for 10 min to eliminate intact cells, cell debris and the nuclear fraction. Mitochondria in the supernatant were then labeled with 5 μM mM NAO for 10 min on ice in the dark. After labeling, mitochondria were pelleted by the centrifugation at 12,000 × g for 10 min, washed two times by buffer M and finally resuspended in CE buffer.
Chip fabrication
A two-step etching procedure was used to fabricate a multiple depth μFFE device as described previously22. Briefly, standard photolithography techniques were used to etch 52 μm deep electrode channels into a 1.1-mm borofloat wafer (Precision Glass & Optics, Santa Ana, CA). A second photolithography step was used to etch the remaining channels. The final depths of the electrode and remaining channels were 71 and 19 μm, respectively. Titanium (100 nm) and platinum (150 nm) layers were deposited followed by a third photolithography procedure to define the electrodes in the side channels. A second wafer, predrilled with access holes and deposited with a ~90 nm thick layer of amorphous silicon (a-Si), was aligned with the etched, electrode-deposited wafer, and 900 V was applied for 2 h at 450 °C and 5 μbar to anodically bond the two wafers. Nanoports (Upchurch Scientific, Oak Harbor, WA) were attached to the access holes using manufacturer’s procedures. Electrodes were connected to wires using silver conductive epoxy (MG Chemicals, Surrey, BC, Canada). The chip was perfused with 1 M NaOH (Mallinckrodt, Paris, KY) until the channels were clear (180 min) to remove unwanted a-Si.
On-line LIF detection
For LIF detection, a 488 nm line from a 150 mW Ar+ laser beam (Melles Griot, Carlsbad, CA) was expanded to a ~2.5 cm wide by ~280 μm thick line across the separation channel of the chip. A SMZ 1500 stereomicroscope (Nikon Corp., Tokyo, Japan) mounted with a Cascade 512B CCD camera (Photometrics, Tucson, AZ) was used to collect the fluorescence emission. The microscope was equipped with an Endow GFP bandpass emission filter cube (Nikon Corp) containing two bandpass filters (450–490 nm and 500–550 nm) and a dichroic mirror (495 nm cutoff). A 1.6× objective was used for collection with a 0.7× CCD camera lens. Magnifications were adjusted between 2× and 5× using the optical zoom of the microscope. The exposure time for the CCD camera was set 100 ms. MetaVue software (Downington, PA) was used for image collection and processing..
μFFE Separation
A schematic illustration of the μFFE device is shown in Figure 1. FFE buffer was pumped at 500 μL/min into the buffer inlet using a 22 Syringe Pump (Harvard Apparatus). Fluorescein and enriched mitochondria fractions were pumped at 250 nL/min into the 20 μm wide sample inlet using a Pico Plus Syringe Pump (Harvard Apparatus). Based on the channel geometry and an applied flow rate of the separation buffer, mitochondria traveled through the microchip at velocity of 1.63 mm/s. At this flow rate, they passed through the 280 μm thick detection zone placed 2 cm downstream from the injection point after 12 s, thus defining the separation time. Mitochondria were excited for 180 ms, while moving through this zone. Voltages between 0–100 Vwere applied across the channel to separate the mitochondria (light gray area in Figure 1).
Figure 1.

Schematic of the μFFE device. Mitochondria are introduced into the device in the absence (A) and presence (B) of an electric field.
μFFE data analysis
Images of μFFE mitochondrial separations were converted to electrophoretic profiles via the linescan feature in MetaVue software. Over the course of a given separation, 60 consecutive images were acquired. An equal number of background images were then acquired in the absence of mitochondria and averaged to produce a background image. The 60 images of the mitochondrial separation were background subtracted and averaged to generate a final image. Linescans were generated by integration of the lateral intensity profiles (pixel intensity vs. chip width) across the width of the excitation laser line. The rectangular linescan essentially integrated mitochondrion signals over time. Linescans (fluorescence vs. horizontal position) were converted to apparent electrophoretic mobility profiles (fluorescence vs. electrophoretic mobility) by calculating the electrophoretic mobility associated with each position in the channel considering the electric field and the residence time in the separation channel. In order to compare electrophoretic profiles measured under different separation conditions, electrophoretic mobility data were corrected using the mobility of fluorescein measured under the same conditions. The following equation governing electrophoretic migration in μFFE was used to calculate the electrophoretic mobility shift of mitochondria with respect to fluorescein:
| (Eq. 1) |
where μm, FFE is electrophoretic mobility, dm is the migration distance of a mitochondrion at a given voltage, df is the migration distance of the reference fluorescein stream at the same voltage, E is the applied electric field across the channel (calculated from the applied voltage V and the channel width w, E=V/w), and t is the residence time of a mitochondrion in the channel from the inlet to detector. Residence time (t) is calculated from the separation buffer linear velocity and the distance to the detector. Histograms of the μFFE mobility profiles were generated by binning mobility data into intervals of equal size (2.5×10⁻⁵cm 2V−1s−1) and normalized.
CE-LIF setup and data analysis
Capillary electrophoresis experiments were performed using a laboratory-built CE instrument with post-column LIF detection, which has been described previously23. A 488-nm line from an argon-ion laser (Melles Griot, Irvine, CA) was used as an excitation source. Scattering from bubbles and subcellular particles was removed by a 505 nm long-pass filter (Semrock, Rochester, NY). Fluorescence from fluorescein and NAO were selected using an interference filter transmitting in the range 518–552 nm (535DF35, Omega Optical, Brattleboro, VT, USA). Output from the photomultiplier tubes biased to 1000V (R1477, Hamamatsu corp., Bridgewater, NJ) was digitized at 200 Hz using a NiDaq I/O board (PCI-MIO-16XE-50, National Instruments, Austin, TX) and stored as a binary file. The detector was aligned using a continuous injection of 5 × 10⁻¹⁰ M fluorescein in CE buffer at −360 V/cm into the capillary. The limit of detection for fluorescein for theCE -LIF instrument was ~4 zmol.
All separations were carried out in 50-cm long, 50-μm i.d., 150-μm o.d. fused silica capillaries (Polymicro Technologies, Phoenix, AZ). Capillary was preconditioned by rinsing with 0.5 M KOH for 30 min, 0.5 M HCl for 10 min, water for 10 min and CE buffer for 10 min at 50 kPa. Between separations, the capillary was rinsed with 0.5 M KOH for 5 min, water for 5 min and CE buffer for 3 min at 50 kPa. All mitochondrial samples were injected into the capillary using a 4s hydrodynamic injection at 10.1 kPa and separated at 18 kV. The electroosmotic flow was estimated by the current monitoring method to be (4.98 ± 0.08) × 10−4 cm2V−1s−1.24 Fluorescein net mobility in CE buffer was calculated from its migration time in CE-LIF to be (−3.0 ± 0.1) × 10−4 cm2V−1s−1. Binary data files were analyzed using Igor Pro software (Wavemetrics, Lake Oswego, OR). Electropherograms were filtered using the median filter function and peaks with intensities higher than threshold (5 times the standard deviation of the background) were selected. The most intense peaks (4% of the total number of peaks) corresponding to the mitochondria aggregates were removed from the selection. The electrophoretic mobility of each mitochondrion corrected for fluorescein electrophoretic mobility was calculated using following equation:
| (Eq. 2) |
where μm,CE is the mitochondria electrophoretic mobility, tm and tf are the migration times of mitochondria and fluorescein, respectively, Vis applied voltage and Lis the capillary length.
Histograms of the CE mobility profiles were generated by binning mobility values into intervals of equal size (2.5×10⁻⁵ cm2V−1s−1) and the normalizing the peak intensities each bin to the total intensity. The net mobility of fluorescein measured by CE-LIF in the buffer system used in μFFE and CE was used for the calculation of the absolute values of electrophoretic mobilities. To compare two distributions of electrophoretic mobility, a quantile-quantile analysis was used25. Each q-q plot was generated by plotting the electrophoretic mobility value at a specific quantile (10–100%) of one distribution (e.g. μFFE) versus the value of the same quantile of the second distribution (e.g. CE-LIF). If these two distributions match exactly they would fall along a line with a slope equal to 1.
RESULTS AND DISCUSSION
Separation and detection of mitochondria
Mitochondria isolated from L6 rat myoblasts were fluorescently labeled with NAO (absorption and emission maxima of 495 nm and 525 nm, respectively) and then streamed into the μFFE channel. In the absence of a separation voltage, mitochondria formed a ~150–μmwide s tream located in the middle of the separation channel (Figure 2A). In the presence of an electric field (95.5 V/cm), the stream spread laterally in the direction of the electric field, which is consistent with mitochondria dispersing across the channel according to their electrophoretic mobilities (Figure 2B).
Figure 2.

Dispersion of mitochondria in μFFE caused by application of an electric field. The mitochondria stream is narrow in the absence of an electric field (A) and disperses when a 95.5 V/cm field is applied (B). Images were produced as an overlap of 60 subsequently captured images (scan rate 10 Hz). Dashed lines were added to illustrate the detection region illuminated by the Ar+ laser. Bright spots outside the detection zone were caused by the light scattered at irregularities in the microchip formed during the fabrication process. μFFE buffer: 250 mM sucrose, 10 mM HEPES, pH=7.4; flow rate: 500 μL/min; Sample flow rate: 250 nL/min; LIF detection: 488 nM excitation, fluorescence collection using 2× magnification, 525±25 band pass filter, CCD camera integration: 100 ms.
After demonstrating the feasibility of using μFFE to electrophoretically separate mitochondria, we investigated the effects of varying the electric field strength. At high electric fields (i.e. 95.5 V/cm) some mitochondria spread outside the detection region even when using 1× magnification. Using this magnification resulted in low detection sensitivity and spatial resolution. In addition, this field led to the accumulation of small bubbles in the waste lines that affected the stability of the laminar flow. These bubbles were most likely the result of electrolysis products formed at the electrode surfaces in the electrode channels. We determined that electric fields ranging from 0 to 33.4 V/cm were more suitable because the range of migration distances of the mitochondria decreased to approximately 1.5 mm, allowing the use of a higher magnification (5×) on the imaging microscope. Additionally, at these low electric fields, the laminar flow was more stable due to reduced current and therefore electrolysis. As shown in Figure 3, the migration distance of mitochondria increased as the electric field increased from 0 to 28.6 V/cm. In the absence of an electric field the stream width was 130±5 μm (RSD = 3.6%, n = 12) with a stable lateral position of 794±4 μm (RSD = 0.5%) over 6 s. Dispersion of the mitochondria increased with increasing electric field. These results demonstrate that the electric field in μFFE can be easily adjusted to tailor mitochondrial electrophoretic separations.
Figure 3.
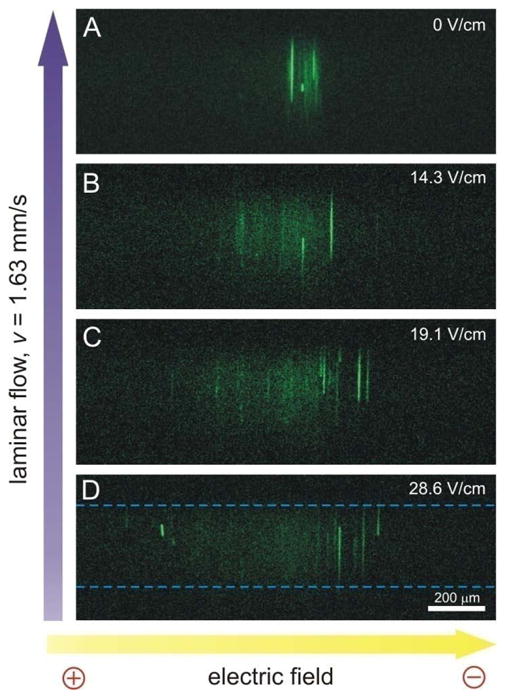
Separation of mitochondria at different electric fields. (A) no potential, (B) 14.3 V/cm, (C) 19.1 V/cm, (D) 28.6 V/cm. Dashed lines were added to illustrate the detection region illuminated by the Ar+ laser. LIF detection: 5× objective, other conditions are the same as in Figure 2.
Individual mitochondria passing through the illuminated region (280 μm), defined by the width of the laser beam, were detected as 160 – 170 μm long streaks (Figure 3). This is consistent with CCD camera acquisition time (100 ms) and the linear flow velocity (1.63 mm/s). While it might be possible to analyze individual streaks in the images to determine electrophoretic mobility distributions of mitochondria, it is more practical to use measure the average fluorescence intensity at each position across the detection area to quantify the distribution of mitochondria dispersion of across the μFFE detection region (Figure 4). Three major populations were observed in these linescans. Peak 1 migrated approximately 400 μm towards the anode at an electric field of 33.4 V/cm. The position of Peak 2 remained nearly nearly constant. Zone 3 is characterized by a collection of intense spike-like events centered at approximately 200 μm towards the cathode. These intense events in Area 3 can also observed in the CCD images (see Figure 3). As expected, the width and position of each of these regions were dependent on the electric field strength, confirming the electrophoretic nature of the mitochondrial separation. Since the observed mitochondrial mobility is a function of the intrinsic electrophoretic mobility of mitochondria, electroosmotic flow and adsorption to the walls of the separation channel26, below we discuss how these factors may contribute to profiles observed here.
Figure 4.

Profiles of mitochondria μFFE separations at different electric field strengths. Linescans were produced by averaging 60 consecutive, background corrected images. Intensity of linescans taken at 0 V/cm was divided by factor of 2 to fit into the graph. Conditions are the same as in Figure 2.
Mitochondrial electrophoretic mobility distributions
The intrinsic electrophoretic mobility of biological particles is a function of size, surface charge density, ionic strength of the medium and the applied electric field13. Previous studies suggested that size is not an important parameter in explaining differences of electrophoretic mobilities of mitochondrial particles27. Also, ionic strength does not explain differences in mitochondrial mobilities since all are found in the same medium. Surface charge density, which defines the ζ potential, is a function of the ionized functional groups in proteins and phospholipids found on the mitochondrial surface that may include both mitochondrial and nonmitochondrial proteins (e.g. cytoskeletal proteins). Exposure of the inner membrane due to opening of the permeability transition pore and subsequent changes,28 fragmentation and disruption of mitochondria during the isolation procedures,29 removal of the outer membrane,30 and changes in membrane potential21 may also affect the surface charge density thereby resulting in changes in electrophoretic mobility. Thus, it is not surprising to observe three defined features in the observed electrophoretic profiles (Figure 4).
Since the charge in mitochondria is less than zero they tend to migrate toward the anode (i.e. left in Figure 4). However, Peak 3 migrated toward the cathode relative to zero field position (see Figure 4). This result is not unexpected since the channel was fabricated from boroglass, which bears a negative charge on its surface generating a cathodic electroosmotic flow31,32. Under such electroosmotic flow regime, the apparent electrophoretic mobility of mitochondria may be greater than zero (i.e. displaced toward the cathode, right in Figure 4).
In order to evaluate the potential adsorption of mitochondria inside the channel, the channel walls were inspected by moving the laser excitation line along the channel while looking for immobilized particles. No mitochondria were observed on the channel walls, suggesting that adsorption was negligible. If a particle adsorbed and then desorbed from the channel wall, its predefined path down the separation channel will not change from diffusion, pressure-driven flow, or electrophoresis since it is only temporarily immobilized. In summary, only the intrinsic electrophoretic mobility and the electroosmotic flow contribute to the observed electrophoretic profiles.
It has been reported that the strength of the electric field affects the electrophoretic mobility of biological particles due to processes such as the relaxation effect13. In order to investigate this possibility, the electrophoretic mobility of mitochondria was calculated using Eqs. 1 and 2. Figure 5A shows the mitochondrial mobility profiles measured using μFFE at different electric field strengths. Mitochondria net mobility ranged from −2.0×10⁻⁴ to −5.5×10⁻⁴ cm2V−1s−1. Three regions were observed with maxima at approximately −4.57×10⁻⁴ (Area 1), −3.5×10⁻⁴ (Area 2) and −3.0×10⁻⁴ cm2V−1s−1 (Area 3). A q-q plot was used to compare the mobility profiles obtained at different electric fields with the profile obtained at 33.4 V/cm. As shown in Figure 5B, all the data points closely match the diagonal reference line in the q-q plot indicating that the profiles of the mitochondrial electrophoretic mobilities are indistinguishable regardless of the electric field used in the μFFE analysis. Furthermore, these results demonstrate the capability of the μFFE device for characterizing mitochondria electrophoretic mobility distributions at electric potentials as low as 15 V/cm.
Figure 5.

Mitochondria electrophoretic mobility profiles measured using μFFE at different electric fields. Electrophoretic mobilities were calculated from the lateral positions in the channel at various electric field strengths (A). Distributions measured at additional electric fields can be found in the supplemental information. Three distinct regions were identified (regions 1, 2 and 3). The shapes of the mitochondrial electrophoretic mobility distributions were compared using a quantile-quantile plot (B).
Comparison of mitochondrial distributions measured using μFFE and CE-LIF
Electrophoretic mobility profiles of mitochondria analyzed by μFFE were compared to the electrophoretic profiles measured by CE-LIF. CE-LIF analysis of individual mitochondrial particles has been previously used to describe the electrophoretic mobility distributions of mitochondria33.
Figure 6A shows a typical CE-LIF electropherogram of a mitochondria separation. Each spike (approximately 30 ms wide) in the electropherogram represents a single mitochondrial particle passing through the detector. A total of 872 peaks were detected in a single separation and their migration times and intensities were used to calculate an electrophoretic mobility distribution weighted by event intensity (Figure 6C). These results are consistent with electrophoretic mobilities reported previously using CE-LIF analysis using covalently-modified coated capillaries33 and PVA coated capi llaries34.
Figure 6.

Comparison of mitochondria mobility distributions measured using μFFE and CE-LIF. Mitochondria were separated by CE-LIF at 360 V/cm (A) and using μFFE at 14.3 V/cm (B). The lateral position in μFFE and the migration time of each event in CE were used to calculate electrophoretic mobilities. Data were corrected for EOF using fluorescein as an internal standard and segmented into 0.25×10⁻⁴ cm2V−1s−1 wide bins and plotted as a histogram (C). In CE, fluorescence intensity was normalized to the total fluorescence intensity of all detected peaks. The mitochondrial mobility distributions measured using μFFE and CE-LIF were compared using a q–q plot (D).
Figure 6B is an image of a μFFE separation of the same sample used to obtain the electropherogram shown in Figure 6A. Linescans of 60 images were averaged, converted to electrophoretic mobility and binned to create an electrophoretic mobility distribution comparable to that obtained using CE-LIF (Figure 6C).
CE-LIF and μFFE both yielded bimodal electrophoretic mobility distributions in which the μFFE distribution was offset 1.8×10⁻⁴ cm2V−1s−1 larger (i.e. more negative) than the CE-LIF distribution. Despite the offset, further comparison of these distributions using a q-q plot (Figure 6D) supported the fact that the shapes of the mobility distributions were practically the same (i.e. fall on the reference line). Factors that may contribute to the measured offset of could be attributed to differences in (1) EOF, (2) buffer composition, (3) adsorption to the walls and (4) electric fields used in both methods. The effect of EOF has been accounted for by comparing the mobilities measured by μFFE and CE to that of fluorescein (see eqs. 1 and 2). The presence of PVA added to the CE separation buffer as a dynamic coating may affect the intrinsic mobilities of mitochondria35,36. However, previous work demonstrated that was not the case, because mobilities obtained using such additive were comparable to those obtained with covalently modified coated capillaries34. Interactions of mitochondria with the capillary walls are not expected to contribute to the observed mobility offset (CE mobility more positive than μFFE mobility), because adsorption onto the capillary wall would result in a longer migration time (i.e. more negative mobility). μFFE separations are not affected by adsorption as described above.
Differences in the electric field used in both methods may is the most likely cause of the observed shift in mitochondria electrophoretic mobility distributions. This hypothesis is consistent with a phenomenon referred to as the relaxation effect, which accounts for an additional drag on a particles movement resulting from distortion the surrounding ionic atmosphere in the presence of a high electric field13. Others have observed increased electrophoretic mobilities of liposomes with decreased electric field37. This is consistent with the mobility offset seen here where observed electrophoretic mobilities increased at the low electric field used in μFFE. It should be noted that the electric field used in the μFFE separation was approximately 25-fold lower than that used in CE. This combined with the fact that mobilities measured using μFFE were shown to be independent of electric field (Fig. 5) suggests that these low field strengths (0–33.4 V/cm) may be necessary to measure mitochondria mobility distributions in the absence of the relaxation effect.
CONCLUSIONS
This report describes the fast separation of mitochondria in a microfluidic free-flow electrophoresis device with online LIF detection. The analysis of a separation profile can be achieved in less than 30 s. This time is markedly shorter when compared to existing FFE or CE methods where a single analysis would typically take approximately 25 min. In contrast to commercial FFE instruments, μFFE requires approximately 100-fold less sample volume and 10-fold less buffer volume. μFFE uses lower electric fields that may be particularly important when studying with biological particles that are susceptible perturbations caused by high electric fields. Another benefit over CE and macroscale FFE devices is the capability to observe the separation process in real-time and quickly change separation conditions or even stop the separation. On the other hand, CE-LIF offers lower detection limits, which is essential in the analysis of individual mitochondrion properties. Mitochondria with very low fluorescence intensity might not be detected in the μFFE system and could potentially bias the observed electrophoretic mobility distributions towards larger particles or aggregates. Comparison of CE-LIF and μFFE results may also be a powerful approach for investigating the role of the relaxation effect (and other electric-field dependent phenomena) on the observed electrophoretic mobility of biological particles.
Since μFFE can be used to collect separated mitochondria fractions, this technique could enable characterization of other mitochondrial properties that ultimately would lead to an understanding of the origins of mitochondria electrophoretic mobility and characterization of mitochondrial subpopulations that are relevant to disease and aging. Moreover, μFFE devices may be suitable for analysis of mitochondria and other particles using other separation modes, such as isoelectric focusing.
Supplementary Material
Acknowledgments
This work was supported by the National Institutes of Health (R01-AG20866 and R01-GM063533).
References
- 1.Balaban RS, Nemoto S, Finkel T. Cell. 2005;120:483–495. doi: 10.1016/j.cell.2005.02.001. [DOI] [PubMed] [Google Scholar]
- 2.Brookes PS, Yoon YS, Robotham JL, Anders MW, Sheu SS. American Journal Of Physiology-Cell Physiology. 2004;287:C817–C833. doi: 10.1152/ajpcell.00139.2004. [DOI] [PubMed] [Google Scholar]
- 3.Cadenas E, Davies KJA. Free Radic Biol Med. 2000;29:222–230. doi: 10.1016/s0891-5849(00)00317-8. [DOI] [PubMed] [Google Scholar]
- 4.Green DR, Reed JC. Science. 1998;281:1309–1312. doi: 10.1126/science.281.5381.1309. [DOI] [PubMed] [Google Scholar]
- 5.Chan DC. Cell. 2006;125:1241–1252. doi: 10.1016/j.cell.2006.06.010. [DOI] [PubMed] [Google Scholar]
- 6.Brandon M, Baldi P, Wallace DC. Oncogene. 2006;25:4647–4662. doi: 10.1038/sj.onc.1209607. [DOI] [PubMed] [Google Scholar]
- 7.Terman A, Dalen H, Eaton JW, Neuzil J, Brunk UT. Exp Gerontol. 2003;38:863–876. doi: 10.1016/s0531-5565(03)00114-1. [DOI] [PubMed] [Google Scholar]
- 8.Duchen MR. Mol Aspects Med. 2004;25:365–451. doi: 10.1016/j.mam.2004.03.001. [DOI] [PubMed] [Google Scholar]
- 9.Navratil M, Terman A, Arriaga EA. Exp Cell Res. 2008;314:164–172. doi: 10.1016/j.yexcr.2007.09.013. [DOI] [PubMed] [Google Scholar]
- 10.Valdivia E, Pease B, Gabel V, Chan V. Anal Biochem. 1973;51:146. doi: 10.1016/0003-2697(73)90462-4. [DOI] [PubMed] [Google Scholar]
- 11.Rodriguez MA, Armstrong DW. J Chromatogr B. 2004;800:7–25. doi: 10.1016/j.jchromb.2003.09.060. [DOI] [PubMed] [Google Scholar]
- 12.Kostal V, Arriaga EA. Electrophoresis. 2008;29:2578–2586. doi: 10.1002/elps.200700917. [DOI] [PMC free article] [PubMed] [Google Scholar]
- 13.Radko SP, Chrambach A. Electrophoresis. 2002;23:1957–1972. doi: 10.1002/1522-2683(200207)23:13<1957::AID-ELPS1957>3.0.CO;2-I. [DOI] [PubMed] [Google Scholar]
- 14.Krivankova L, Bocek P. Electrophoresis. 1998;19:1064–1074. doi: 10.1002/elps.1150190704. [DOI] [PubMed] [Google Scholar]
- 15.Zischka H, Braun RJ, Marantidis EP, Buringer D, Bornhovd C, Hauck SM, Demmer O, Gloeckner CJ, Reichert AS, Madeo F, Ueffing M. Mol Cell Proteomics. 2006;5:2185–2200. doi: 10.1074/mcp.T600018-MCP200. [DOI] [PubMed] [Google Scholar]
- 16.Eubel H, Lee CP, Kuo J, Meyer EH, Taylor NL, Millar AH. Plant J. 2007;52:583–594. doi: 10.1111/j.1365-313X.2007.03253.x. [DOI] [PubMed] [Google Scholar]
- 17.Zhang CX, Manz A. Anal Chem. 2003;75:5759–5766. doi: 10.1021/ac0345190. [DOI] [PubMed] [Google Scholar]
- 18.Kohlheyer D, Eijkel JCT, van den Berg A, Schasfoort RBM. Electrophoresis. 2008;29:977–993. doi: 10.1002/elps.200700725. [DOI] [PubMed] [Google Scholar]
- 19.Turgeon RT, Bowser MT. Anal Bioanal Chem. 2009;394:187–198. doi: 10.1007/s00216-009-2656-5. [DOI] [PMC free article] [PubMed] [Google Scholar]
- 20.Turgeon RT, Bowser MT. Electrophoresis. 2009;30:1342–1348. doi: 10.1002/elps.200800497. [DOI] [PMC free article] [PubMed] [Google Scholar]
- 21.Lu H, Gaudet S, Schmidt MA, Jensen KF. Anal Chem. 2004;76:5705–5712. doi: 10.1021/ac049794g. [DOI] [PubMed] [Google Scholar]
- 22.Fonslow BR, Barocas VH, Bowser MT. Anal Chem. 2006;78:5369–5374. doi: 10.1021/ac060290n. [DOI] [PubMed] [Google Scholar]
- 23.Duffy CF, Gafoor S, Richards DP, Admadzadeh H, O’Kennedy R, Arriaga EA. Anal Chem. 2001;73:1855–1861. doi: 10.1021/ac0010330. [DOI] [PubMed] [Google Scholar]
- 24.Huang XH, Gordon MJ, Zare RN. Anal Chem. 1988;60:1837–1838. [Google Scholar]
- 25.Whiting CE, Arriaga EA. J Chromatogr A. 2007;1157:446–453. doi: 10.1016/j.chroma.2007.04.065. [DOI] [PMC free article] [PubMed] [Google Scholar]
- 26.Hedrich HG, Stahn RKH. J Cell Biol. 1970;46:137–150. doi: 10.1083/jcb.46.1.137. [DOI] [PMC free article] [PubMed] [Google Scholar]
- 27.Plummer DT. J Biochem. 1965;96:729. doi: 10.1042/bj0960729. [DOI] [PMC free article] [PubMed] [Google Scholar]
- 28.Zischka H, Larochette N, Hoffmann F, Hamoller D, Jagemann N, Lichtmannegger J, Jennen L, Muller-Hocker J, Roggel F, Gottlicher M, Vollmar AM, Kroemer G. Anal Chem. 2008;80:5051–5058. doi: 10.1021/ac800173r. [DOI] [PubMed] [Google Scholar]
- 29.Kamo N, Muratsugu M, Kurihara K, Kobatake Y. Febs Lett. 1976;72:247–250. doi: 10.1016/0014-5793(76)80979-9. [DOI] [PubMed] [Google Scholar]
- 30.Fuller KM, Arriaga EA. J Chromatogr B. 2004;806:151–159. doi: 10.1016/j.jchromb.2004.03.050. [DOI] [PubMed] [Google Scholar]
- 31.Fonslow BR, Bowser MT. Anal Chem. 2006;78:8236–8244. doi: 10.1021/ac0609778. [DOI] [PubMed] [Google Scholar]
- 32.Fonslow BR, Bowser MT. Anal Chem. 2005;7:5706–5710. doi: 10.1021/ac050766n. [DOI] [PubMed] [Google Scholar]
- 33.Duffy CF, Fuller KM, Malvey MW, O’Kennedy R, Arriaga EA. Anal Chem. 2002;74:171–176. doi: 10.1021/ac010939i. [DOI] [PubMed] [Google Scholar]
- 34.Whiting CE, Arriaga EA. Electrophoresis. 2006;27:4523–4531. doi: 10.1002/elps.200600249. [DOI] [PubMed] [Google Scholar]
- 35.Chrambach A, Radko SP. Electrophoresis. 2000;21:259–265. doi: 10.1002/(SICI)1522-2683(20000101)21:2<259::AID-ELPS259>3.0.CO;2-1. [DOI] [PubMed] [Google Scholar]
- 36.Ohshima H. Electrophoresis. 2002;23:1995–2000. doi: 10.1002/1522-2683(200207)23:13<1995::AID-ELPS1995>3.0.CO;2-M. [DOI] [PubMed] [Google Scholar]
- 37.Pysher MD, Hayes MA. Langmuir. 2004;20:4369–4375. doi: 10.1021/la0362730. [DOI] [PubMed] [Google Scholar]
Associated Data
This section collects any data citations, data availability statements, or supplementary materials included in this article.