Abstract
The character and timing of gyral development is one manifestation of the complex orchestration of human brain development. The ability to quantify these changes would not only allow for deeper understanding of cortical development, but also conceivably allow for improved detection of pathologies. This paper describes a FreeSurfer based image-processing analysis “pipeline” or methodology that inputs an MRI volume, corrects possible contrast defects, creates surface reconstructions, and outputs various curvature-based function analyses. A technique of performing neonate reconstructions using FreeSurfer, which has not been possible previously due to inverted image contrast in pre-myelinated brains, is described. Once surfaces are reconstructed, the analysis component of the pipeline incorporates several surface-based curvature functions found in literature (principle curvatures, Gaussian, mean curvature, “curvedness”, and Willmore Bending Energy). We consider the problem of analyzing curvatures from different sized brains by introducing a Gaussian-curvature based variable-radius filter. Segmented volume data is also analyzed for folding measures: a gyral folding index (gyrification-white index GWI), and a gray-white matter junction folding index (WMF). A very simple curvature-based classifier is proposed that has the potential to discriminate between certain classes of subjects. We also present preliminary results of this curvature analysis pipeline on nine neonate subjects (30.4 weeks through 40.3 weeks Corrected Gestational Age), 3 children (2, 3, and 7 years) and 3 adults (33, 37, and 39 years). Initial results demonstrate that curvature measures and functions across our subjects peaked at term, with a gradual decline through early childhood and further decline continuing through to adults. We can also discriminate older neonates, children, and adults based on curvature analysis. Using a variable radius Gaussian-curvature filter, we also observed that the per-unit bending energy of neonate brain surfaces was also much higher than the children and adults.
Key words and phrases: MRI, Gyral Folding, Brain Development, Principal Curvature Analysis, FreeSurfer, Neonate, Preterm, Surface Reconstruction, Gaussian Curvature, Bending Energy
1. Introduction
The human brain is capable of performing extraordinary tasks. Its abilities to communicate, synthesize information and perform analytical tasks far outmatch those of other species. Human intellect is thought to be a result of the disproportionately large cortical surface area to whole brain volume compared to other species (Rakic, 1995). This increase in cortical surface area is achieved by increased gyral folding. Interestingly this increase in cortical surface area does not come with similar increases in cortical thickness. In fact the several orders of magnitude increase in the human gray matter surface area compared to mice and monkey is achieved with barely a doubling in the cortical thickness (Rakic, 1988). Thus it appears that cortical surface area to brain volume and cortical folding are important parameters of cognitive development and ability.
The presumed evolutionary increase in gyral folding seen in humans compared to other species is recapitulated during human brain development. Post mortem studies indicate that gyral folding begins between 11 and 16 weeks gestational age with all major gyri present by 25 weeks and folding complete close to term (Amunts et al., 1997). Many cerebral malformations are associated with either too many small gyri (polymicrogyria) or too few large gyri (pachygyria) (Barkovich et al., 2005). Pathological processes in the developing brain can also alter gyral folding with hypoxic ischemic causing ulegyria and shunting after severe hydrocephalus can result in stenogyria (Armstrong et al., 2007). With cortical folding related to brain function, measures of folding may also prove useful in neuropsychiatric disorders. For example, in autism, increases in white matter, especially if peripheral, should alter cortical folding (Courchesne et al., 2004; Herbert et al., 2004). If we can quantify the development of gyral folding we may improve our ability to characterize normal trajectories of brain development and detect deviation with disease. Detecting when, during development, deviations from normal begin to occur has the potential to improve our understanding of when genes or external factors may impact brain development and provide timelines for intervention.
The mechanical forces that drive gyral folding are also poorly understood. Two theories for the mechanical forces exist and although not mutually exclusive they emphasize different processes. The first theory suggests that tailored growth processes cause cortical buckling (Armstrong et al., 1995; Caviness, 1975) possibly due to shear forces when growth in outer cortical layers outstrips growth in the inner layers. The second theory, the axonal tension theory, hypothesizes that gyral folding is dependent on differential stresses arising from locally distributed associative subcortical axons (Van Essen and Drury, 1997; Hilgetag and Barbas, 2005; Hilgetag and Barbas, 2006). Both theories imply that cortical folding is a reflection of important mechanical forces generated by growth.
Current methods for describing gyral folding and maturation are largely qualitative and determined by visual inspection of MR images in a single plane (Battin et al., 1998; Ruoss et al., 2001; van der Knaap et al., 1996). These methods have proposed basic grading criteria where maturation of gyri are associated with the gyri transitioning from broad gyri with shallow sulci to narrow gyri with deep sulci. The dynamic range of this qualitative measures is small (integer grading from 0 to 3) allowing for little distinction between different types of gyral folding. In addition these measures assess only the ratio of width to depth of gyri and sulci, are tedious and are biased by the plane chosen for evaluation.
Quantitative methods are few with the gyrification index (GI) the primary measure. Traditionally, the GI is computed on a slice-by-slice manner, and is the ratio of the complete cortical length including folds extending into the cortex to the “outer” cortical length (Zilles et al., 1988). It is inherently a 2D measure, the cortical lengths are computed separately for each slice in a volume. Initially the GI was developed for post-mortem, specimens but this method is also now used on MR images. Although quantitative, the GI does not assess the complex 3 dimensional nature of gyral folding and is very sensitive to variations in the size of the sub-arachnoid space.
From a folding complexity perspective, several studies have attempted to quantify folding and/or complexity. Fractal dimension analysis has often been used as a technique for measuring “complexity” (Hofman, 1991; Kiselev et al., 2003; Im et al., 2006), as well as folding measures derived from cortical thickness analysis ( Van Essen et al., 2006; Tosun et al., 2006) and metric distortions that arise from registering surfaces to an average template (Wisco et al., 2007). Although fractal measures are interesting in the abstract, we find them difficult tools to use as a means of understanding the topology of cortical folding. Numerous studies based on cortical thickness employ regional shape measures based on functions of mean curvature.
Some other approaches to complexity have tried a completely different track, trying to understand and describe folding by tracing the development of several primal folding templates, or “sulcal roots” that correspond to the first folding locations during antenatal life (Cachia et al., 2003a; Cachia et al., 2003b; Mangin et al., 2004a; Mangin et al., 2004b; Mangin et al., 2003; Regis et al., 2005; Andoh et al., 2006). These are objects derived from mean curvature minima and saddle points. The highly variable pattern of folding noted across adult brains can be recovered from successive scale-space analysis. Folding patterns are decomposed and their core embedded patterns simplified. Conceptually, Mangin’s work constructs “tree-like” structures tracing the development of simple folds to complex pattern at different scales. Our work is a complement to this approach. Sulcal roots provide a means for logically constructing how simple folds become complex patterns without focusing on the detailed curvature characteristics of the final patterns. Our work is less concerned with the exact location of the maximal sulcal depth and its branching pattern, and more focused on the surface topology which we analyze using several curvature functions. We focus on the topology as we feel that this had the potential to be more directly linked to the cellular and molecular processes of neuronal proliferation and migration.
Additional studies have attempted to consider the intrinsic geometry of the cortex from a more purely mathematical and computational basis (Griffin, 1994), but followup studies in a similar vein using contemporary computing power have not been pursued. Moreover, these studies have focused on adult, not pediatric or developing newborn brain surfaces.
More recently, spherical wavelets have also used to quantify cortical folding (Yu et al., 2007; Nain et al., 2007). Development of surface folding was modeled through increasing wavelet powers and these wavelet coefficients were fitted to the Gompertz function, a model of self-limited growth. This allows predictions as the when cortical folding might occur during development, and also provides measures as to the differential folding rate across developing surfaces. The Gompertz function has been used successfully in the past to describe brain volumetric growth (McLennan and Grilles, 1983; Koop et al., 1986).
Other methods exist for constructing surfaces that do not rely on explicit segmentation, as proposed recently by Rieger (Rieger et al., 2004; Rieger and van Vliet, 2004; Rieger and van Vliet, 2002). These methods are based on orientation fields obtained by using gradient structure tensors at different scales. These tensors in turn are derived from embedded iso gray level surfaces within the image itself. Such approaches may also yield useful results but we chose to create tessellated surfaces so that the constraint of topological correctness would allow us to more easily detect local inconsistencies that may result from noise.
Our work further expands upon previous studies, most notably that of Batchelor (Batchelor et al., 2002) who explored volumetric and surface folding, as well as Rodriguez-Carranza et al. (2006) who presented an overview system for measuring surface folding. While our volumetric analysis is related to Batchelor’s, our surface-based analysis differs. Batchelor (following (Van Essen and Drury, 1997)) computes mostly integral measures of some curvature functions – we consider the distribution of curvature functions and are less concerned with cumulative integral measures.
This paper presents a methodology for analyzing curvature in the developing brain from preterm to adult. Although the word folding is universally understood, as a mathematical concept it not have a specific definition. Our focus on this paper is to study curvature, which is well defined and understood. While we might mention the term folding in this paper, we wish to stress that it is curvature, and functions of curvature, that we quantify. More specifically, we present a multi-stages pipeline to segment, process, reconstruct and curvature-analyze brain surfaces.
In summary, therefore, this paper’s core purpose is to present a methodological approach for analyzing the curvature information of reconstructed brain surfaces from preterm minimally myelinated brains through adult myelinated brains. The methodology described in detail in Section 2. In particular, we present a practical technique for extending FreeSurfer’s reconstruction pipeline to process minimally myelinated neonate brains which have been manually segmented following the techniques of the Center for Morphometric Analysis which provides we believe an exceedingly high degree of confidence in the segmentation (Sections 2.2, 2.3) as well as a simple FreeSurfer-based volume-based analysis (Section 2.4). Pre-processed volumes are then surface reconstructed, providing curvature data at each vertex of the resultant surface (Sections 2.5). We reconstruct and analyze the surface of the gray-white matter junction – a biologically significant area since it represents the area available for neuronal connections and through which all neuronal connections must pass.
We consider several functions of the curvatures on the gray-white junction (Section 2.6) and in particular we note that the core methodological contribution of this paper lies in the manner by which we process this data. Most studies are concerned with the mean curvature of surfaces, and occasionally the Gaussian curvature. We consider additionally the underlying components of the Gaussian curvature directly, and moreover propose an additional curvature function, the sharpness function, as a meaningful analysis component. Moreover, our analysis of these curvature functions is different to the current trend in the literature, which tends to focus on providing one-dimensional integral functions based on curvature values. Simply stated, the current trend is to sum a particular curvature function across the surface of interest. We provide an inherently two dimensional analysis based on a histogram-centroid approach (Section 2.7) that offers, we believe, more discriminating power in classifying brain types than those provided by one dimensional integration alone. Finally, recognizing that integral approaches are also useful, we also provide an integral approach based on the Willmore energy function, which we then filter using the Gaussian curvature to regions of local curvature (Section 2.8). This Gaussian-filter approach is also offered as a means to compare regions of scale-based folding across surfaces of different area. The Methods concludes with a brief discussion on curvature comparisons across different sized brain gray-white surfaces from preterm to neonates in Section 2.10. The potential of this approach to provide information on gyral formation and maturation is tested on a small number of meticulously prepared data sets that included 1. Newborn preterm through term newborns where gyri are forming, young children and adults.
A secondary purpose is to provide the results of this approach on a sample dataset that contains neonate subjects, pediatric subjects, and adult subjects. This is offered as a proof-of-concept and conceptual validation of the methods. Section 3 is organized in parallel to Section 2, and considers for each part of the methodology its results as well as a discussion of these results. To capture the time period when marked increases in gyral folding occur, we included preterm and term neonatal brains as well as older myelinated brains. These datasets are also selected so as to provide distinct populations each of which is marked by quite age-specific folding patterns. Since full brain manual segmentation is also an extremely time consuming process, our data sample is comparatively low. We argue, however, that should our methods identify interesting age- or shape-based information on such a small sample set, it strongly suggests our techniques offer the means to analyze larger more statistically significant sets of data.
2. Methods
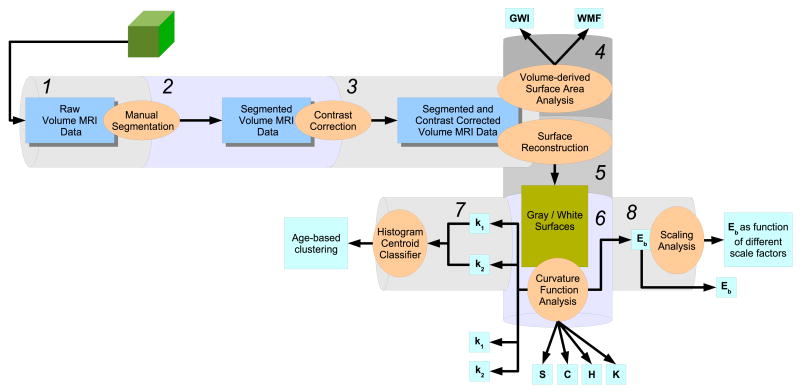
The organization of this paper closely follows the structure of Figure 1. Each labeled section of the pipeline has a corresponding Methods component (Section 2) that describes its function, and a corresponding Results and Discussion component (Section 3) that analyzes the output of the component.
Figure 1.
An overview of the curvature analysis pipeline. Data components are represented by the rectangular blocks, and operations on these data objects by the oval bubbles. The pipeline consists of eight components, with outputs generated at stages 4, 6, 7, and 8 as shown.
The schematic pipeline shown in the figure accepts an MRI volume as its input, and analyzes various volumetric and reconstructed surface properties derived from the input data. Processed data is output at various pipeline stages. The Methods Section proceeds along each pipeline stage, describing the main data components and the various funcstional methods applied to the data as it progresses along the pipeline. Where appropriate, limitations to a particular component are discussed.
2.1. Stage 1: Data collection
Nine neurologically normal neonates with corrected gestational ages (CGA) 30–40 weeks, 3 normal pediatric subjects of ages 2, 3, and 7 years, and 3 normal adults of ages 33, 39, and 40 years were imaged. T1 weighted 3D SPGR images were collected on a GE 1.5T scanner, with TR/TE = 30/8, flip angle = 25 to 30 degrees, matrix = 256×192, FOV =220×165 mm or 200×150 mm and slice thickness 1.2 to 1.5 mm depending on head size.
2.2. Stage 2: Manual Segmentation
Once collected, these images were semi-automatically segmented using Card-views (J Rademacher and AM Galaburda and DN Kennedy and PA Filipek and VS Caviness Jr., 1992; Filipek et al., 1994; Center for Morphometric Analysis, 1992; DN Kennedy and JW Meyer and PA Filipek and VS Caviness Jr., 1994; Caviness et al., 1996a; Filipek et al., 1997; Nishida et al., 2006). Though highly time sensitive (segmenting a single brain can take two weeks), this method is highly accurate and the process incorporates several intra- and inter-segmenter reliability, validation, and consistency components. These techniques have been developed at the Center for Morphometric Analysis (CMA) and have been extensively published (Kennedy, 1986; Kennedy and Nelson, 1987; Kennedy et al., 1989; Filipek et al., 1989; Filipek et al., 1991; Filipek and Kennedy, 1992; Caviness et al., 1989; Caviness et al., 1995; Caviness et al., 1996a; Caviness et al., 1996b). Segmentation is typically performed in coronal image in a slice-by-slice fashion. For this paper, the gray/white junction surface and the outer cortex/CSF boundary were segmented.
This segmentation regime divided the brain into two regions. The first region was an outer cortical ribbon containing the cortex mantle and comprising gray matter, i.e the tissue volume contained between the gray/white surface and outer cortex/CSF boundary. The second region comprised all the remaining inner non-cortex tissue. Typically this contained white matter and deep cortical gray structures including ventricles.
2.3. Stage 3: Contrast Correction
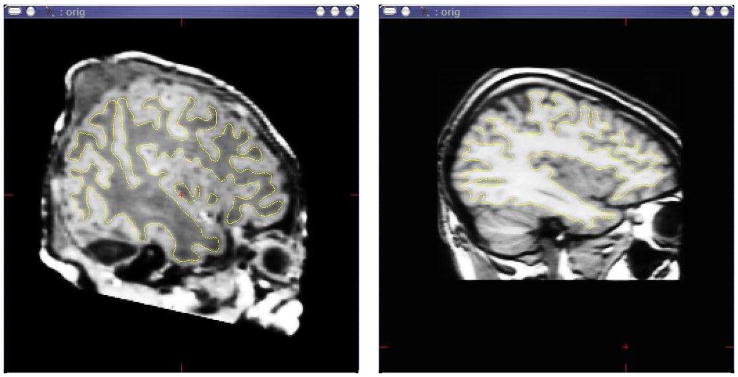
Having defined segmentation boundaries, it was now possible to directly specify the contrast intensities for all our regions. This is an important step, since the unmyelinated brains of the neonate subjects showed a “contrast inversion” when compared to adult brain images. T1 weighted neonate volume data often has white matter recorded with a “dark” intensity, and gray matter with a “light” intensity, as shown in Figure 2. The manual separation of “cortical” and “non-cortical” tissue was made on a coronal slice-by-slice basis for each volume of each subject in this study (note that the sagittal view shown was generated after manual coronal slicing and surface reconstruction).
Figure 2.
Differing T1 intensity contrasts for neonate at 39 weeks corrected gestational age (on left) and adult control (on right). The yellow trace (visible in color prints of the figure) defines the gray/white matter boundary in this slice plane.
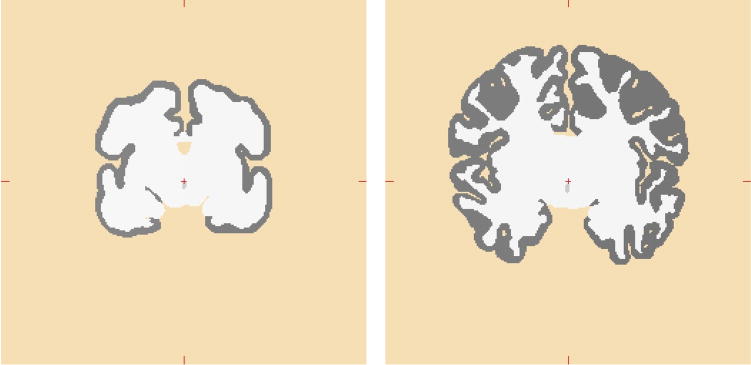
With the defined surface boundaries, the pipeline simply “flood filled” each contiguous tissue region in each segmented slice with predefined contrast values. These values were selected to be compatible with FreeSurfer defaults for gray and white matter, as shown in Figure 3. Note also the dramatic change in folding pattern between the subject on left at 31 weeks corrected gestational age and the 39 week subject on right.
Figure 3.
Examples of manually segmented volumetric coronal slices. On the left is a neonate at 31.1 weeks corrected gestational age; on the right the a neonate at 39.7 weeks corrected gestational age. The “gray” voxels are cortex; the “white” voxels are a summation of white matter, deep cortical gray structures, and ventricles.
Given these segmented surfaces, and contrast-corrected tissue regions, the pipeline split along two paths. The first path analyzed the volume-based surfaces for initial curvature/folding properties; the second path continued on to reconstruct tessellated surfaces of the tissue junctions.
2.4. Stage 4: Folding Analysis on Volumetric Data
The manual segmentation described in Section 2.2 greatly simplifies quantitative volumetric measurements. For the purposes of this paper, we considered two tissue classes: the cortical volume Vg, i.e. exterior to the gray-white junction, and the sub-cortical volume Vw, i.e. the entire region interior to the gray-white junction. The Vw includes all tissue classes interior to the gray-white junction (ventricles, thalamus, amygdala, hippocampus and similar deep cortical gray structures).
We can also estimate the approximate surface area in mm2 of various tissue interfaces by counting the voxel “faces” that define the border between two tissue classes. In this manner, the gray-white surface area AGWIs approximated by counting the number of voxel faces between the cortical and non-cortical tissue. Similarly, the cortical surface area Agc is approximated by counting the number of voxel faces between the cortical and CSF tissue classes. Of course, we expect any surface areas calculated in this manner to overestimate the actual areas. Nonetheless, despite the relative simplicity of this approach, we do believe it can provide meaningful data.
Stage 4 presents two “folding” measures based on the volumetric data: the GWI, or Gyrification-White Index, and the WMF, or White Matter Folding
| (1) |
| (2) |
where all quantities are calculated from segmented volumes and do not require a complete surface reconstruction. The above are whole brain surface based calculations.
The GWI differs from the more traditional GI of Zilles et al. (1988)
| (3) |
in that it uses the gray/white junction in the numerator instead of the outer “pial” surface. In addition, the original formulation of the GI was calculated on a slice-by-slice basis (explicitly shown by the n in the above equation). We did not use GI for several reasons. In the first place, we were unable to reliably disambiguate the pial surface manually in our neonate subjects due to contrast issues in the original data. The gray/white junction however, was reliably identified in all our cases. Moreover, within FreeSurfer, the pial surface, Apial is derived in an iterative process starting at the gray/white junction, Agw and extending outwards towards the skull. In other words, Apial = f (Agw) – therefore the GWI is related functionally to the GI. Finally, we believe from a biological perspective that the gray/white junction is a fundamentally important surface since all connection between the cortex and deeper structures must pass through this boundary.
Note that since the GWI is defined as the ratio between two non-touching surfaces, it can potentially be sensitive to the distance separating the surfaces. We believe that, as long as the volumes are segmented accurately, the cortical thickness will vary little across similarly aged subjects. By normalizing the volume data, the effects of cortical thickness would further be mitigated. Our study, however, was specifically interested in absolute measures (see Section 2.10) thus a possible cortical thickness side-effect of “unnormalized” GWI is acceptable.
The WMF contains a exponent in its denominator, making it quite sensitive to absolute sizes. Despite this, it has the attractive feature of being a function of only a single tissue class. The GWI, however, is largely scale invariant, but depends on two different tissue classes. Taken together, we believe both indices provide useful measures on the folding of the manually segmented volumetric data.
Our volumetric analysis corresponds to the zero-order measures of Batchelor et al. (2002), with our GWI conceptually related to Batchelor’s “Convexity Ratio”, or CR. Note that the CR uses a convex hull derived from the gray-white surface to approximate an “outer shrink-wrap” of the cortex, and is thus a derived measure. A function similar to the GWI has been proposed as the IGAR by Rodriguez-Carranza et al. (2006). Both of these definitions as well as Batchelor’s Isoperimetric Index, IPR (which is similar to the WMF ) require full surface reconstruction.
Our Equations 1 and 2 are based on volume-segmented data and do not require surface reconstruction, while the IGAR and IPR do require surface reconstruction. Of course, the measures are conceptually similar, but operate on different “inputs”. In order to emphasize this difference, we use our designation of GWI and WMF. Why then would one use volume-segmented versions – particularly as they would be less accurate than measures on the reconstructed surfaces? We propose here to use these measures as fast validation – trends observed in an analysis of reconstructed surfaces should also be reflected (albeit less accurately) by an analysis of the volume segmentation directly. Also, the WMF provides some insights into scale issues of the surfaces. If the surfaces were increasing in scale only, but maintain constant folding, we would expect the WMF to be largely linear across subjects of increasing age.
2.5. Stage 5: Surface Reconstruction
The surface reconstruction proceeded in an automated/manual/automated iterative fashion. Using FreeSurfer, the segmented/contrast corrected coronal slices were combined into topologically correct surfaces (Makris et al., 2003; Ju et al., 2005; Makris et al., 2005; Fennema-Notestine et al., 2006; Lyoo et al., 2006; Dale et al., 1999; Fischl et al., 1999). In its default mode of operation, FreeSurfer typically processes MRI volume data directly, automatically attempting the segmentation and skull stripping steps. These initial operations were not necessary since our data was manually segmented and contrast corrected. We simply inserted our data slightly upstream into the FreeSurfer reconstruction process.
The input data was typically collected with in-plane resolution < 1mm, and slice thickness > 1mm. Internally, FreeSurfer re-sampled the data in a conformed 1mm3 isotropic voxel space and created candidate tessellated surfaces. Surface reconstruction details, in particular smoothing of surfaces and noise robustness concerns are discussed in Milad et al. (2005). In this manner we were able create surfaces in the same absolute coordinate frame space, and cross compare across different brains (see Section 2.10 for a discussion on normalization). Each surface is inspected for topological errors and manually corrected by an experienced technologist where necessary. This step involves making voxel-based intensity changes to the original input data, and then re-creating the tessellated surfaces from the edited data. Typically only a few vertices out of thousands require manual editing for topology correction. All our data, viz. the neonates, children, and adults were subjected to the same manual segmentation, contrast correction, and FreeSurfer surface creation process.
In order to better visualize cortical surfaces that might be “buried” within sulcal banks, FreeSurfer also allows the ability to create inflated representations of the folded surfaces. This inflation is more analogous to “blowing up” a crumpled paper bag than inflating a balloon for example. In the latter, the surface is elastic and stretched considerably in the inflation process. FreeSurfer however inflates the surface while attempting to minimize geometric distortions and maintain the relative geometric relationships in the surface topology – hence a crumpled paper bag is a more apt analogy. Once inflated, the curvature values of the original folded surface are typically displayed on the inflated surface.
2.6. Stage 6: Curvature Functional Analysis
The reconstructed gray-white matter tessellated surfaces that FreeSurfer creates contain a rich variety of information associated with each vertex of the created mesh. Any given surface in three dimensions has, at each point, an infinite number of possible curvatures Ki i ∈  , and will over this set of curvatures have two mutual orthogonal tangent directions for which the curvatures are extremal. These two curvatures are a maximal curvature k1 and a minimal curvature k2. Collectively these are referred to as the principal curvatures (do Carmo, 1976)
| (4) |
Several polynomial functions of the principal curvatures are often used in differential geometry. These are the mean curvature, H and the “curvedness”, C (Koenderink and van Doorn, 1992), defined as
| (5) |
| (6) |
A useful operation relating the intrinsic curvature to the actual surface is the Willmore energy (Tom James Willmore, 1997, Rieger et al., 2004),
| (7) |
| (8) |
We further analyze the Willmore integrand, which we have observed that when projected across surfaces is proportional to the apparent “sharpness” of folding:
| (9) |
Note that k1, k2, H, and C all have units of inverse length (mm−1) while S and Eb have units of inverse area (mm−2).
Equations 4 through 9 all quantify extrinsic properties of a surface. Extrinsic curvature is the curvature that is apparent to an observer able to study the three-dimensional space in which a surface resides, and quantifies the rate of deviation between one surface and another. Intrinsic curvature, on the other hand, is the curvature of a surface that is apparent to an observer “embedded” within the surface itself and concerns the differential relationship between different points on the surface.
More mathematically, the intrinsic curvature is defined at each point in a differential manifold. For 3D surfaces it is defined as the product
| (10) |
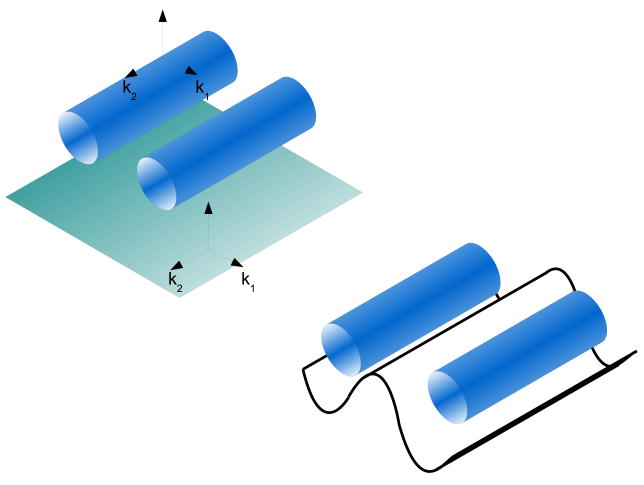
and is referred to as the Gaussian curvature with units of inverse area (mm−2). The Gaussian curvature of a surface is invariant under distance preserving changes, no matter how the surface is folded, provided that the act of folding introduces no tears or shears. In this manner, a flat sheet has K = 0 since k1 = k2 = 0. By folding the sheet into a cylinder, the Gaussian remains 0 since at each point on the cylinder’s body the minimum curvature is still 0. If the Gaussian curvature is positive and constant it is isometric to a sphere and if negative it is isometric to a saddle.
Please refer to Appendix A for a more detailed overview of Equations 5 through 10, as well as their geometric interpretation.
2.7. Stage 7: Histogram-Centroid Classifier
With the exception of the integrative bending energy Eb, all the curvature functions created in Stage 6 are functions of their physical location on the surface. In practical terms, this implies that at each vertex point of the tessellated triangle surface structure, there is specific “local” value for each of the curvature functions {k1, k2, K, H, C, S}. The Eb function integrates over their entire surface, and is thus “global”.
One mechanism to represent the distribution of the “local” curvature function in 2D space is using a histogram-centroid approach. We can analyze the distribution of curvatures across a surface as a histogram where the x-axis of the histogram shows actual curvature values, and the y-axis indicates the occurrences of these values. The resulting plots would show the spread of curvature values across a particular subject gray/white surface for a given curvature function. The x-centroid of a given curvature-function histogram is simply the average value of that curvature-function across the surface. The y-centroid position denotes the relative occurrence of this average value on the surface.
For a given subject’s tessellated surface which contains R vertices, and a given choice b of histogram bins, we can normalize 1 the histogram data across all our subjects according to:
| (11) |
where fn denotes the normalized histogram, fh the original histogram function. The same parameters were used for histogram normalization across all the brains. Given this histogram spread function, we now propose a feature extraction/classifier that uses geometric centroids to possibly cluster similar histograms together. A centroid is the “average” of all points in an object X. The geometric centroid of a physical object with uniform density coincides with its center of mass. Our classifier simply considers the negative and positive curvature distributions of the histogram functions fn separately, and determines their respective geometric centroids.
Therefore, for a curvature histogram function fn and for each subject i we can create a set of ordered pairs (nx̄i,nȳi) < 0 for the negative centroid of subject i and (px̄i,pȳi) ∀ fn ≥ 0 for the positive centroids of subject i. By plotting each negative and positive ordered pair for given subject’s histogram centroid, we hope to cluster together curvature functions that show similar distributions over a brain. In the ideal case, each different subject age group, or rather curvature function distributions that are “similar” would cluster together.
2.8. Stage 8: Scale Factor Filtering and Analysis
Geometrically, the human brain curves at several different scales – and in the simplest sense we can identify two scale factors. First, there is the large scale curving of the brain as a whole – a roughly spherical or ovoid structure divided into two hemispheres with scale factors in the order of the actual skull diameter. Then, at a much smaller scale, we note the curvature of the pattern of folds embedded on the cortical surface, with scale factors in the order of individual gyri and sulci. From a cortical developmental perspective, we are concerned primarily with these parts of the surface that curve at this smaller scale. It is at these regions of curvature where the surface changes are most pronounced as the cortex buckles and folds. Developmentally, three scale factors are recognized: primary, secondary, and tertiary folding. For the purposes of this study, we do not specifically attempt to differentially isolate these scale factors – indeed, here we simply consider a macro scale encompassing the whole brain, and a micro scale that attempts to consider only the gyral folding (be it either primary, secondary, or tertiary).
Moreover, given the resolution of our input data, there is an inherent uncertainty in determining exactly how “flat” the smooth parts of the sulcal banks indeed are. We would ideally like to restrict of our curvature analysis to parts of the surface we confidently feel are within our measurement abilities at the scale of gyral and sulcal folding.
A “flat” surface has an intrinsic Gaussian of zero. Logically, we are interested therefore in regions where the intrinsic Gaussian is non-zero. These regions represent areas where the cortex is folding due to the stretching or compression on an underlying surface. However, due to the practicalities of our input measurement resolution, all of the surface has potentially non-zero Gaussian curvature. In fact, we are unable to resolve with certainty if small Gaussian curvatures are in fact zero or simply curving at a large brain-macro scale. A more reasonable question then becomes one of thresholding. Below what threshold can we assert that the values are too small to conceivably contribute to Gaussian folding at the gyral/sulcal scale?
Consider the Gaussian curvature at a single point on the cortical surface. A surface curving through this point has an intrinsically maximal curvature for the case of a perfect sphere, i.e. where r is the sphere’s radius. If we imagine such a sphere touching the surface at this point, the area of the spherical cap over the face of one voxel approaches a circle inscribed in the voxel as r increases. In addition, with increasing r the length of an arc across this spherical cap approaches the length of the actual voxel itself.
The arc-length, l is defined as
| (12) |
where θ is a radian angle, and r is the radius length. Using the arctan function, we can express Equation 12 as
| (13) |
where v is a voxel length. Since our curvature space has been normalized to 1 mm in plane, v = 1mm, we can easily solve iteratively for r. When r = 2.5 mm, the curvature is 0.4000 mm−1 and the arc-length is 0.9513 mm; when r = 5.0 mm the curvature is 0.2000 mm−1 and the arc-length is 0.9870 mm.
This arc is traced across a spherical cap. For a given r, the area of this spherical cap patch S becomes
| (14) |
As r → ∞ the surface area of this spherical cap bounded by a single 1mm2 voxel face will tend to that of a circle inscribed exactly within the voxel face
| (15) |
We can use Equations 13 and 14 as thresholds on the Gaussian curvatures, bounded by r, and generate a table of bending energy values where we only consider parts of the cortical surface that are “bending” due to folding at our r scale. For values of the surface where K > 1/r2, the thresholded mean bending energy for the surface is calculated by approximating Equation 7 as
| (16) |
where the function iterates over the entire surface S and only evaluates vertices  where the K at that vertex exceeds the threshold 1/r2. The total summation is divided by the number of vertices N that satisfied the threshold condition. In a similar manner, we created a thresholded area normalized function
| (17) |
which is essentially Equation 16 divided by the area that satisfied the threshold condition. Following the discussion in Section 3.9, a further boundary on the curvature values should be set at curvatures less than 1.5 mm−2
2.9. Pipeline Output Summary
Table 1 presents a summary of the relevant pipeline outputs. For the most part, curvature measures and functions have been defined in the literature. Novel contributions from this paper are the “sharpness” function, S, the vertex- and area-normalized and thresholded bending energy and the histogram-centroid classifier. Note that expressions similar to the GWI and WMF of this paper have been reported in the literature but have been evaluated on reconstructed surfaces. In this curvature pipeline we apply them to segmented volume data – i.e. not on a reconstructed surface, affording us the ability to quantify some “folding” parameters without a time-consuming surface reconstruction.
Table 1.
Summary of the pipeline outputs.
| Curvature (folding) measure | Expression (units) | Reference | Expression Data Source | Expression Type | |
|---|---|---|---|---|---|
| Gyrification-White Index |
|
[1] | Segmented Volume | Scalar | |
| White Matter Folding |
|
[2] | Segmented Volume | Scalar | |
| Maximum principal curvature | k1 (mm−1) | [3] | Reconstructed Surface | Vector field | |
| Minimum principal curvature | k2 (mm −1) | [3] | Reconstructed Surface | Vector field | |
| Mean Curvature |
|
[3] | Reconstructed Surface | Vector field | |
| Curvedness |
|
[4] | Reconstructed Surface | Vector field | |
| Sharpness | S = (k1 − k2)2 (mm−2) | CP | Reconstructed Surface | Vector field | |
| Gaussian | K = k1 k2 (mm−2) | [3] | Reconstructed Surface | Vector field | |
| Bending Energy |
|
[5] | Reconstructed Surface | Scalar | |
| Vertex-normalized Bending Energy |
|
CP | Reconstructed Surface | Thresholded Scalar | |
| Area-normalized Bending Energy |
|
CP | Reconstructed Surface | Thresholded Scalar | |
| Histogram-Centroid | (nx̄i,nȳi) ∀ fn<0(px̄i,pȳi) ∀ fn≥0 | CP | Reconstructed Surface | 2D planar intersect |
The “Expression” column defines curvature measures. The “Reference” column provides literature references: [1] “IGAR” Rodriguez-Carranza et al. (2006); [2] “Convexity Ratio” Batchelor et al. (2002); [3] do Carmo (1976); [4] Koenderink and van Doorn (1992); [5] Rieger et al. (2004); or CP to indicate a new contribution from the Curvature Pipeline. The “Expression Data Source” denotes if the measure is derived from the segmented volume data, or from the reconstructed surface. The “Expression Type” indicates if the expression is evaluated as a spatial vector field, i.e. at each vertex, or if it is a single scalar value computed over the entire surface. Agc= area of the cortical exterior; Agw= area of the gray/white interface. The ‘:’ operator in the Vi: X expressions for Eb implies “containing”, i.e. tessellated vertex Vi “containing” the curvature value ‘X’.
2.10. Inter-Subject Analysis and Normalization
As mentioned in Section 2.5, subjects’ initial volumetric data is internally re-sampled by FreeSurfer to a 1mm3 isotropic space. In this manner our data collection space is normalized across the varying in-plane and slice thickness resolutions in which the subjects were scanned. The reconstructed gray white surfaces are therefore dimensionally faithful representations of the subjects’ actual brain surface.2
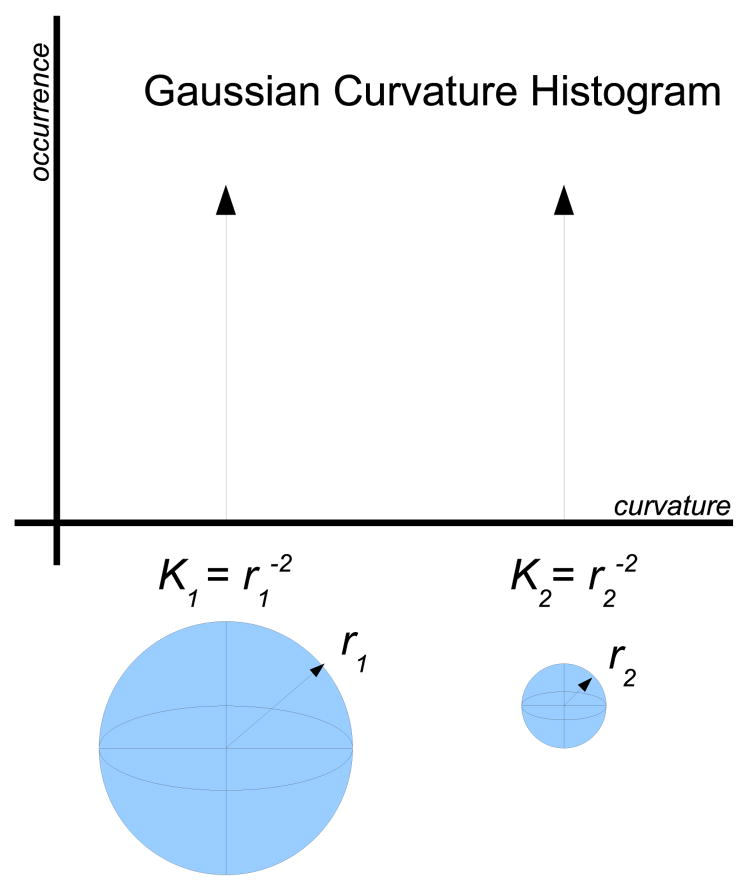
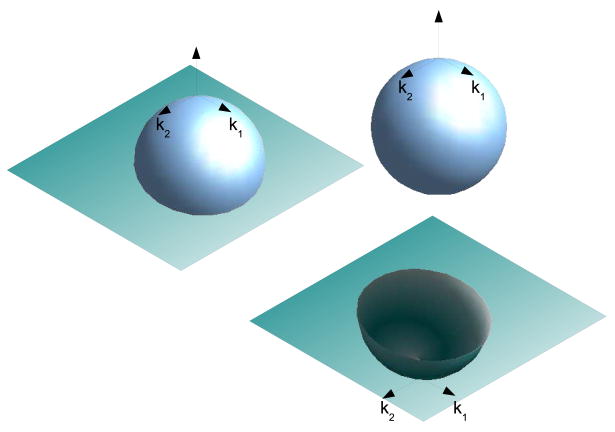
The stated goal of this paper is an analysis of the curvature properties of the developing human gray white surface. An obvious question regarding gross geometric scaling effects arises, simply: how can one differentiate between changes in curvature due to scale vs changes due to folding? This problem is exemplified by Figure 4 where a histogram of the Gaussian curvature of two spheres is shown. These spheres differ only in radius such that r1 > r2. The Gaussian curvature of a sphere of radius r is by definition 1/r2, implying that the two shapes in fact have their respective histogram x-axis position dependent on their size. Therefore, if we scale all brains so that they are the same volume, not only will we change the curvature but also we will change the intrinsic Gaussian which indicates that the shape is fundamentally different. These fundamental shape changes reflect the fact that these two spheres are not biologically equivalent as properties such as the surface area to volume also change.
Figure 4.
Effect of scaling on histograms. A histogram of K curvature for two spheres such that r1 > r2 is shown. Although the shapes are folded identically, the x-axis position of their histograms differs.
In fact, in the developing brain we have observed that cortical volume grows at a more rapid rate than white matter volume as the cortex folds. During this time, overall brain volume also increases (Nishida et al., 2006). Therefore in human brain development folding and volume increases are intimately related, and it is not clear that these processes can be separated.
Based on this reasoning, we do not make an attempt to normalize the reconstructed shapes from a scale perspective, and remind the reader that the results we present combine effects of curvature changes due to both growth and folding. Our underlying rationale is simply to measure the curvature of reconstructed surfaces with as little post-processing distortion as possible. Since we are not in this study interested in curvature changes for specific brain regions, we also do not need to co-register any of our subjects – such a registration process too would result in inevitable distortions of the surface and hence its curvature/folding properties.
Certainly we acknowledge that from a pattern analysis/engineering perspective there is an argument to be made for attempting to track at least some effects of scaling. Section 3.4 shows the result of surface area to volume normalization using the WMF measure. In addition, we can leverage our knowledge of the reconstruction process to incorporate surface-specific information in the surface curvatures. Consider that the reconstructed mesh area for a given vertex is not constant. Moreover, the absolute number of vertex points is also dependent on the absolute surface area – larger surfaces will have more mesh points. We refer the interested reader to Appendix B for more information, as well as results, from an analysis that explicitly attempts to incorporate mesh-local information in the analysis. We note that the fundamental observations on the results, viz. a peak in curvature measures at term followed by a gradual decline remain largely unchanged.
Finally, from a biological perspective, and as a main component of this paper, we believe that growth of the cortex can be geometrically flagged by the Gaussian curvature. Since the Gaussian curvature is invariant under distance preserving changes, it only varies when the underlying surface stretches or shears – areas that biologically should correspond to regions of growth. The Gaussian scale filter of Section 2.8 is our attempt to use the Gaussian curvature at different scales to flag biologically significant areas and measure the Willmore Bending Energy at these flagged locations. Figure
3. Results and Discussion
This section follows the same overall organization as the Methods section, and in particular Figure 1. The pertinent results of each pipeline stage is presented and its input/output data discussed. The emphasis here is on the overall curvature/folding measures generated by the pipeline. These outputs are generated by the final stages of the pipeline and these stages are correspondingly examined in more detail than the earlier stages. This section concludes with an overview of measurement and reconstruction noise their effects on the data, as well as touching on some of the inherent limitations of the study.
As a more general discussion point, before considering specific results, we would like to point out that Section 3.9 also considers our approach to comparative curvature studies across surfaces of different size/area.
3.1. Stage 1: Data Collection
This stage collected the original MRI DICOM volumetric data and converted to internal volumetric forms, ready for manual segmentation.
3.2. Stage 2: Manual Segmentation
Manual segmentation proceeded in a coronal slice-by-slice manner with a trained technologist tracing closed shapes about the regions of interest, specifically the cerebral cortex. In this manner, each brain was separated into a cortical volume, Vg and a non-cortical volume Vw. Ancillary structures such as the skull, cerebellum, and brain stem, were explicitly not segmented.
3.3. Stage 3: Contrast Correction
The cortical regions defined by Stage 2 were colored with contrast values and tagged with tissue labels for processing by FreeSurfer.
3.4. Stage 4: Folding Analysis on Volumetric Data
Table 2 presents measurements made on the raw MRI data directly. The surface area of a shrink wrap about the “outer cortex”, i.e. the boundary of the cortex and cerebral-spinal fluid without regard for the intricate folding pattern is presented in the Agc column; the surface area of the gray/white junction in the Agw column.
Table 2.
Whole brain surface area and volume data determined from the “raw” volumetric scan data.
| Subject | Agc (103mm2) | Agw (103mm2) | Vw (ml) | Vg (ml) | % non-cortex | % cortex | GWI (L + R) | WMF (L + R) |
|---|---|---|---|---|---|---|---|---|
| 30.4 | 26.9 | 28.5 | 92.4 | 43.8 | 67.8 | 32.2 | 1.0606 | 1.3979 |
| 31.1 | 32.3 | 33.5 | 92.4 | 49.2 | 65.2 | 34.8 | 1.0350 | 1.6400 |
| 34.0 | 52.0 | 68.3 | 126.6 | 88.1 | 58.9 | 41.1 | 1.3119 | 2.7094 |
| 36.7 | 60.5 | 78.7 | 144.8 | 118.3 | 55.1 | 44.9 | 1.3012 | 2.8563 |
| 37.5 | 52.9 | 107.7 | 174.8 | 172.9 | 50.2 | 49.8 | 2.0352 | 3.4463 |
| 38.1 | 77.4 | 113.1 | 149.0 | 148.0 | 50.1 | 49.8 | 1.4619 | 4.0256 |
| 38.4 | 60.6 | 106.6 | 148.4 | 142.5 | 51.1 | 48.9 | 1.7577 | 3.8030 |
| 39.7 | 72.8 | 117.5 | 146.3 | 165.7 | 46.8 | 53.2 | 1.6145 | 4.2329 |
| 40.3 | 61.0 | 139.7 | 149.9 | 203.4 | 42.4 | 57.6 | 2.2882 | 4.9514 |
| 104 | 74.8 | 157.8 | 238.1 | 364.5 | 39.5 | 60.5 | 2.1081 | 4.1076 |
| 156 | 75.0 | 151.0 | 256.7 | 344.5 | 42.6 | 57.4 | 2.0116 | 3.7392 |
| 365 | 83.5 | 161.7 | 268.0 | 366.0 | 42.2 | 57.8 | 1.9358 | 3.8897 |
| 1734 | 164.5 | 312.1 | 620.0 | 767.4 | 44.7 | 55.3 | 1.8973 | 4.2926 |
| 1770 | 134.3 | 225.1 | 400.0 | 650.0 | 38.1 | 61.9 | 1.6768 | 4.1470 |
| 2054 | 166.4 | 281.2 | 631.3 | 925.8 | 40.5 | 59.5 | 1.6894 | 3.8212 |
Agc= area of the cortical exterior; Agw= area of the gray/white interface; Vw= volume of the non-cortical (mostly white matter) interior; Vg= volume of the cortical (mostly gray matter) exterior. The percentage of total brain volume that is “white” and “gray” are given in the “% non-cortex” and “% cortex” columns respectively. Finally, the GWI and WMF evaluated over the entire brain (left + right hemipheres) are given in the last two columns.
These surface areas are calculated in the methods described in Section 2.4, and compare well with published literature (Nishida et al., 2006; Makris et al., 2006). The surface area of the gray-white junction as calculated from the volume data increased rapidly from 30 weeks to term, appeared to stabilize over the first 6 years of life and then experienced an increase by the time adulthood was reached.
The Vg and Vw in Table 2 correspond to the cortical and sub-cortical volumes respectively. Initially non-cortical tissue comprised a larger proportion of brain volume than the cortical matter. At approximately 38 weeks CGA these two volumes became equal and for all ages from 38 weeks CGA through adult, cortical volume dominated brain volume. The L + R in the Table denotes that the measures presented are for the left and right hemispheres taken together.
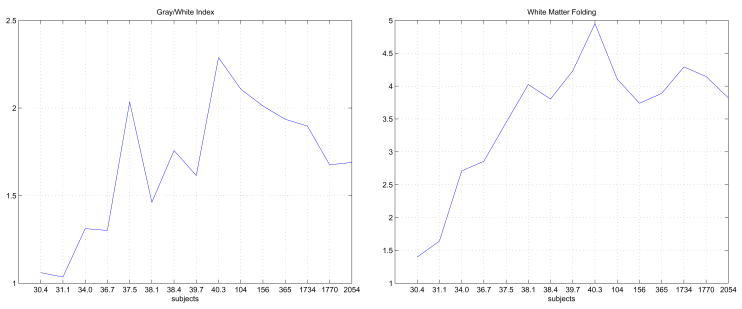
Both the GWI and WMF increased rapidly from 30 weeks GA to term, as shown in Figure 5. The young children and adults had lower GWI and WMF than the term neonate. Changes over time were more marked in WMF than GWI with fewer fluctuations around the general trend. Again it is likely that variation in the size of sulcal CSF caused some fluctuations and apparent lower sensitivity of GWI for increased folding. The relatively large GWI for subject 37.5 is probably due to this subject’s sulcal banks being comparatively “close enough” together that the “shrink wrap” surface hardly penetrates deep into any sulcus, i.e. subject 37.5 happened to have relatively less sulcal CSF. The neonates with CGA 30.4 and 31.1 have brains with minimal folding and WMF close to 1. As the surface folds more, the surface area increases disproportionately to volume and values greater than 1 are obtained, indicating increasing deviation from a spheroid as surface folding increases.
Figure 5.
Folding parameters as derived from the volumetric segmentation. On left, the GWI; on right the WMF.
Given the relatively low number of samples that we were able to process, the strongest conclusion from Figure 5 is that the GWI and WMF values peak at term, with post-term decline evident at older ages. This volumetric analysis was also performed to provide a quick baseline of possible trends as comparison for analysis on the reconstructed surfaces. We could have computed GWI and WMF on surfaces, but specifically used the segmented volumes as a source of data separate from the surfaces. Should folding/curvature trends on the surfaces been obviously different to this volume-derived data, this would have indicated some or other analysis error.
Also, the WMF shows a somewhat simplistic overview of surface area to volume changes. If the change in surface area was primarily due to scaling factors alone, we would expect a more linear plot across ages. Here we clearly note a rise, peak, and drop off effect indicating that folding effects are in fact dominant.folding
3.5. Stage 5: Surface Reconstruction
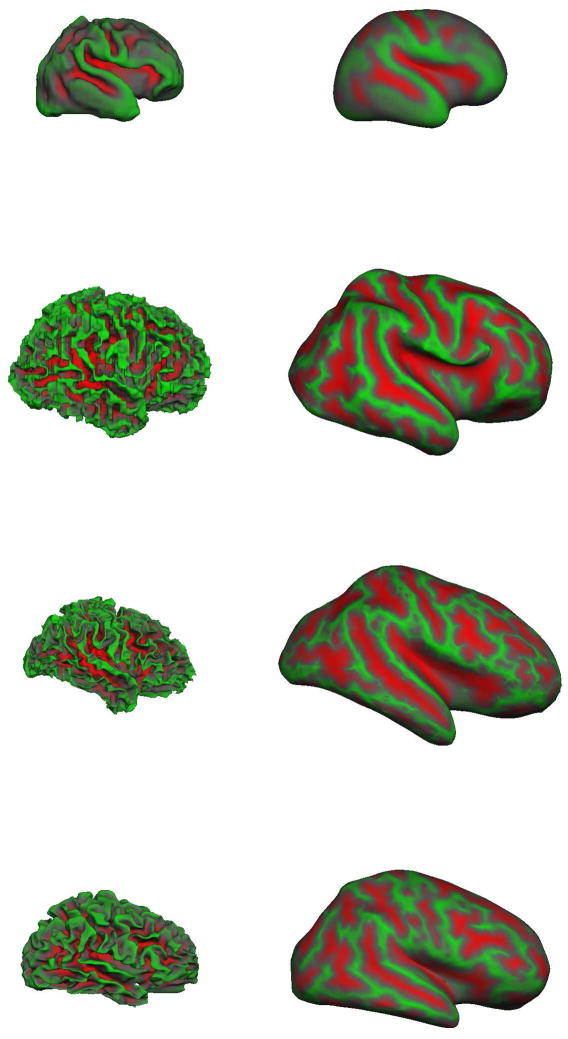
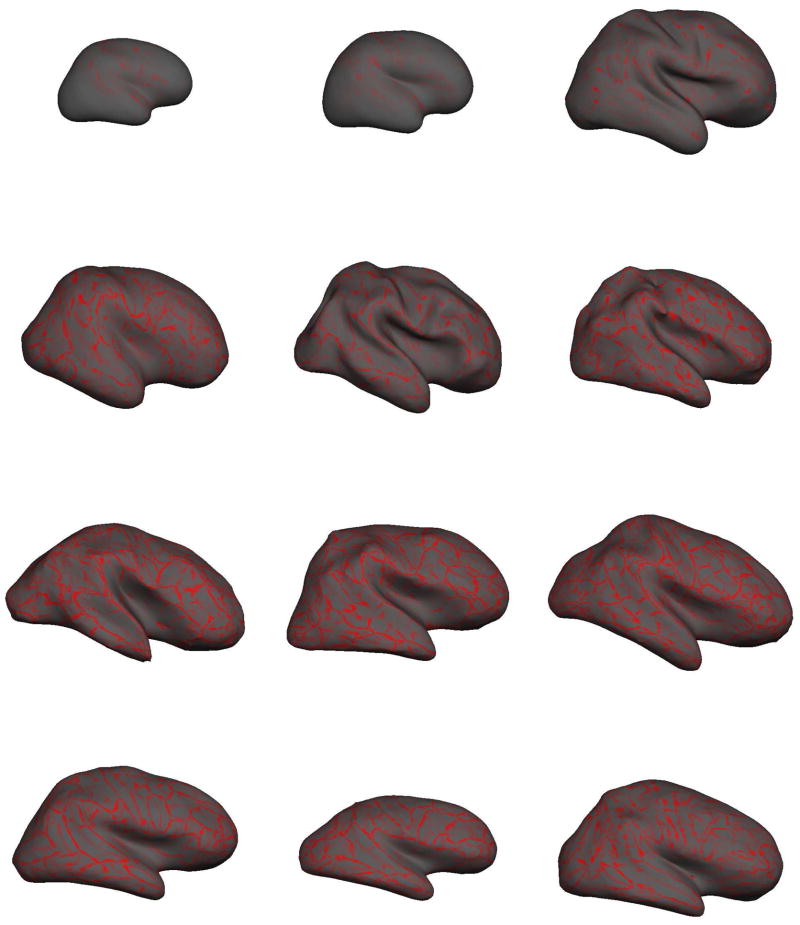
The reconstructed gray/white surfaces of the right hemisphere at different ages are shown in Figure 6. The left image panes present the reconstructed gray/white surface, with each vertex shaded with the “average convexity” or “sulc”. Imagine a surface between the gray/white junction and the outer cortex such that the mean “height” of the surface is zero. The “sulc” measure colors each vertex with the distance from this zero-hull surface. Green denotes a “negative” displacement, i.e. a green-colored vertex needs to move “downwards” (i.e. in a negative direction) to reach the zero mean hull; red denotes a “positive” displacement (similarly a red vertex has moved “upwards” in a positive direction to reach the zero mean hull (in grayscale images, “red” is mapped to dark gray, “green” is mapped to light gray). Thus green areas represent gyri and red areas, sulci. The right pane of the surface reconstruction figures presents the inflated gray/white surfaces and more easily reveal the cortical surface that is often “hidden” within folding patterns. The term brain is clearly more folded than the premature brain and appears more folded than the adult brain. By visual assessment alone, differences in the term and 7 year old brain are more difficult to detect.
Figure 6.
The gray/white surface reconstructions of different aged subjects (not shown to scale). From top to bottom, 31.1 weeks CGA, term neonate at 39.7 weeks CGA, 7 year old pediatric brain, adult brain at 39 years. On left, is the smoothed right hemisphere gray-white junction surface. On right, the inflated right hemisphere gray-white junction surface which better illustrates the curvature values “buried” within sulci. The term brain appears more folded than the adult brain.
3.6. Stage 6: Curvature Functional Analysis
Having reconstructed the gray/white surface topology, various functions of curvature were evaluated at each vertex of the tessellated surface representation.
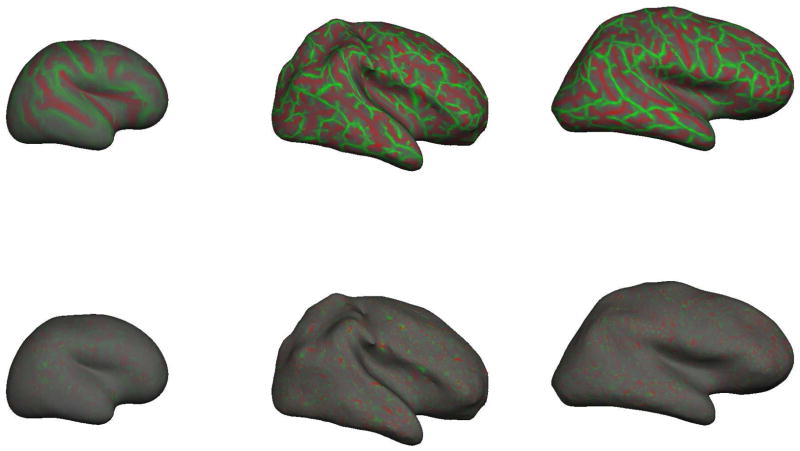
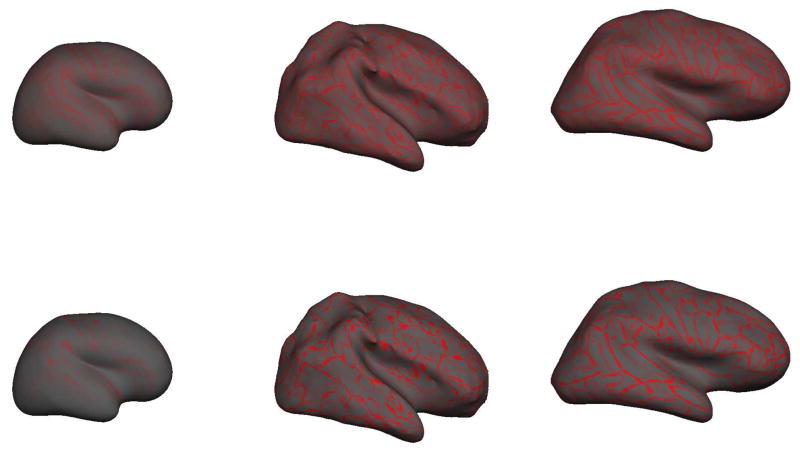
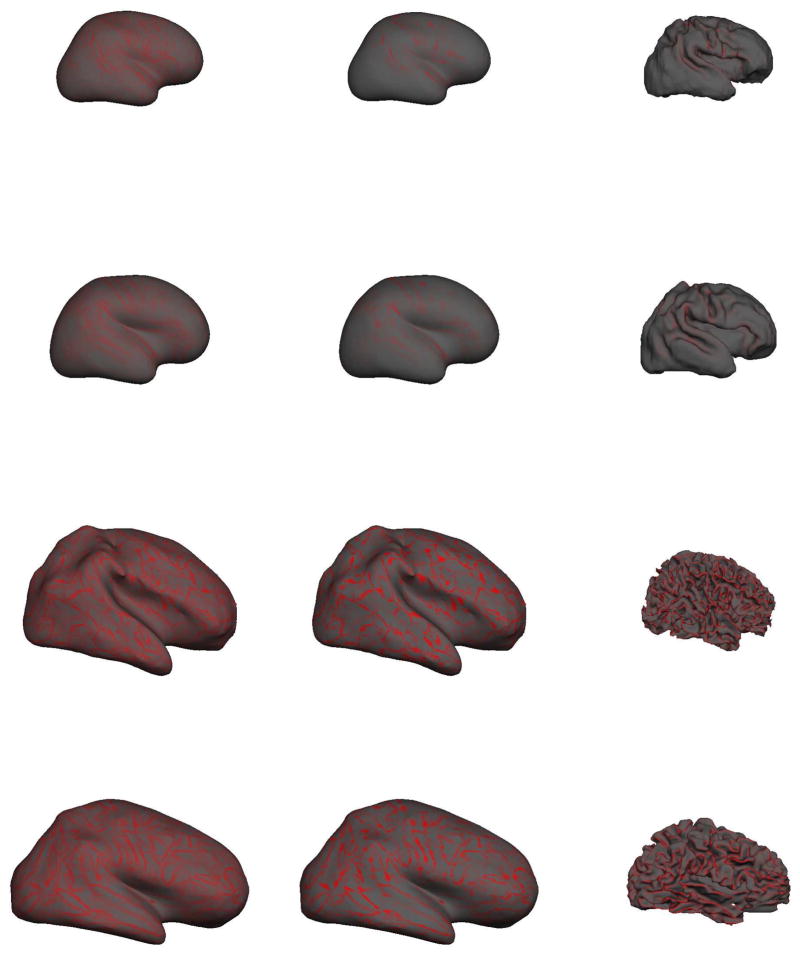
The spatial appearance of k1 and k2 are shown in Figure 7 where values are displayed on the inflated right hemisphere gray/white surfaces of three sample subjects: our youngest neonate on the left at 30.4 weeks CGA, a term neonate in the middle panel at 40.3 weeks CGA, and an adult subject on the right at 39.9 years. For the purposes of illustration, the k2 curvatures have been contrast-enhanced to better display their spatial properties.
Figure 7.
Projections of principal curvature functions k1 (top) and k2 (bottom) across entire brain surfaces. On left, the youngest neonate at 30.4 weeks CGA. In middle the term neonate at 40.3 weeks CGA. On right, an adult subject. The complexity of the topological pattern of k1 appears to peak around term and appears to represent the primarily cylindrical folds of the gyri/sulci. In contrast the topological variation of k2 is at a higher frequency and appears to represent small local “bumps” or “dimples”.
By definition k1 is always larger than k2. We observe that brain folding tends to be “cylindrical” in as much as the pattern of folding manifests as a pattern of ridges and valleys. Although these ridges and valleys are of very varied orientation, they are essentially cylinders. We can therefore state that k1 will approximately describe the curvature of the gyral/sulcal “banks” that are in general perpendicular to the gyral/sulcal long axis. The positive k1 values represent inward curvatures of sulci and negative k1 values represent outward curvatures of the gyral crests.
The k1 and k2 maps in Figure 7 also reveal some qualitative frequency information. The k1 map clearly has a spatial frequency component that is directly related to the actual folding for sulci and gyri. The k2 map might at first glance appear mostly noisy, but when we consider that curvatures are inverse radii of osculating circles, we determine that the small amplitude k2 signal implies some very large inverse radii (osculating circles with typically larger than 10mm and much larger than attributed to noise). Moreover, close examination of the k2 projection shows that while the signal is uniformly low amplitude, it has a much higher frequency than the k1 signal. Note that the curvature map is well balanced in local regions with areas of negative curvature bordered by areas of positive curvature, resulting in a regular pattern of outward and inward undulation that runs along the major axis of gyri and sulci. The cause and significance of this pattern is unclear but it remains remarkably regular (equally balanced positive and negative) and similar in spatial extent. Future studies of abnormal vs normal populations will help determine its significance and sensitivity to disease processes. A spatial harmonic analysis of the k1and k2 functions would yield interesting insights into the frequency components of these signals.
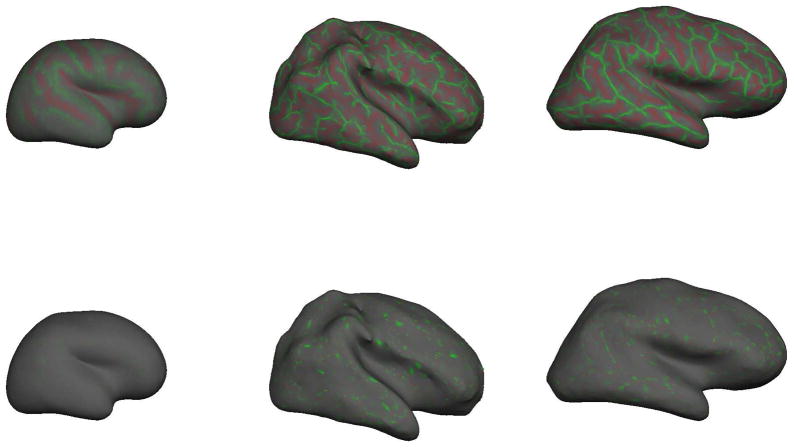
The mean curvature – H shown in the top part of Figure 8 – is the average of k1 and k2. In this Figure, the left most panel shows H as a function of spatial position for the 30.4 week CGA neonate; the middle panel for the term 40.3 week CGA; and the right panel for the 39 year old adult subject. The mean curvature is an extrinsic measure and because k1 is significantly larger than k2, k1 values dominate the behavior of H. In the general case where k1 ≫ k2, H will track as one-half of k1. Differences in the H and k1 function distributions will be apparent where k1 and k2 are similar and non-zero.
Figure 8.
Projections of principal curvature functions H (top) and K (bottom) across entire brain surfaces. On left, the youngest neonate at 30.4 weeks CGA. In middle the term neonate at 40.3 weeks CGA. On right, an adult subject.
Just as H is dominated by the relatively large k1, Gaussian curvature K tends to be dominated by the smaller k2. The Gaussian curvature, however, is a measure intrinsic to the surface, unlike the other curvatures analyzed by the pipeline – k1, k2, H, C and S – which are all extrinsic. The bottom part of Figure 8 shows the K curvature as a function of spatial position for the 30.4 week CGA neonate on left; the term 40.3 week CGA in the middle; and the 39 year old adult subject in the right panel.
At birth K is close to 0 everywhere, and the overall brain topology is similar to a cylinder, which is an intrinsically flat surface. By 30 weeks CGA, major sulcal and gyral groups have started to change the extrinsic geometry, but an examination of the Gaussian shows that for the most part, intrinsically, the brain surface is still largely flat. The small positive and negative undulations indicate that for the most part the 30 week brain can be unfolded into a flat sheet with very few wrinkles. As the brain develops more gyri, small regions of higher K with alternating positive and negative values develop primarily along the gyral crests with negative values dominating.
As shown in Figure 8, the overwhelming majority of gray/white surface Gaussian curvature values were close to zero across all the brain surfaces. This had the surprising implication that from neonate, through the pediatric subjects, and into adulthood, the gray/white junction surface, though extrinsically highly folded, is for the most part an intrinsically flat surface. This is an encouraging finding as this means that it is mathematically valid to flatten the brain for brain mapping and individual distortions will be minimal. Though seemingly spheroid in appearance, it is perhaps more accurate to think of the gray white surface as generally cylindrical; moreover, the dominant nature of folding on this surface also tends to be cylindrical – the gray/white surface can be thought of as largely a cylinder that creates cylinder-like folds.
Figure 9 presents the curvedness C and sharpness of folding S for three sample subjects: the 30.4 week CGA neonate on the left; the 40.3 week CGA term subject in the middle, and the 39 year old adult on right. Structurally, C relates to the square-root of S which has the general effect that C is a smoothed version of S with reduced dynamic range. In color images, the C and S appear as a pattern of red tendrils across the surface; in grayscale these traces are visible as dark gray.
Figure 9.
Projections of principal curvature functions C (top) and S (bottom) across entire brain surfaces. On left, the youngest neonate at 30.4 weeks CGA. In middle the term neonate at 40.3 weeks CGA. On right, an adult subject.
Curvedness C increases the bias to larger k1 values and increases the ability to distinguish regions highly folded from those with minimal folding. Similar to mean curvature, curvedness increases in general with age until term, dropped across the three children, and then dropped again across the adults. In general C is not as “sharp” as the S function and has a smaller range. It tends to trigger indiscriminately on most curvatures while S triggers more selectively on areas that are “sharply” folded by maximizing the square difference between k1 and k2. Note that in the middle panel of older neonates in Figure 9 we can clearly identify the primary gyral peaks as sharp reds snaking across the surface. Note also the lighter pattern of ridges that run either in parallel to the main ridges, or serve as short cross links between these main ridges. These lighter patterns contribute measurable additional curvatures to the global curvature measures, and tend to denote furrows and bumps along sulcal valleys. Note that these lighter patters are still evident in the pediatric subjects shown, albeit faded, and are mostly absent from the adult.
Sharpness emphasizes regions where k1 and k2 are maximally different and therefore where cylindrical folding dominates. Thus this parameter is maximal at the crests of gyri and depths of sulci. The overall profile of the mean “curvedness” function, C, was quite similar in shape to the “sharpness” function, both in overall shape and in value. This is somewhat surprising since C is a line function that is related to the square root of the S surface function. Although showing a similar overall trend to mean C, the mean S showed more noise. In fact, for S the deviation sharply tracked than the mean, while for C, the deviation was mostly stable and much less than the mean. This indicates that C is a more stable and less varying function. Nonetheless, S holds considerable appeal in that by highlighting areas of high cylindrical folding, we can detect folds as soon as they develop and conceivably track how they spread across the surface. In this manner, S can provide a simple measure to exploring the regional development of folding. A visual inspection of the S function maps seemed to suggest that folding occurred medially and from there spread anteriorly and posteriorly. A complete representation of S and C across all the subjects is shown in Appendix C.
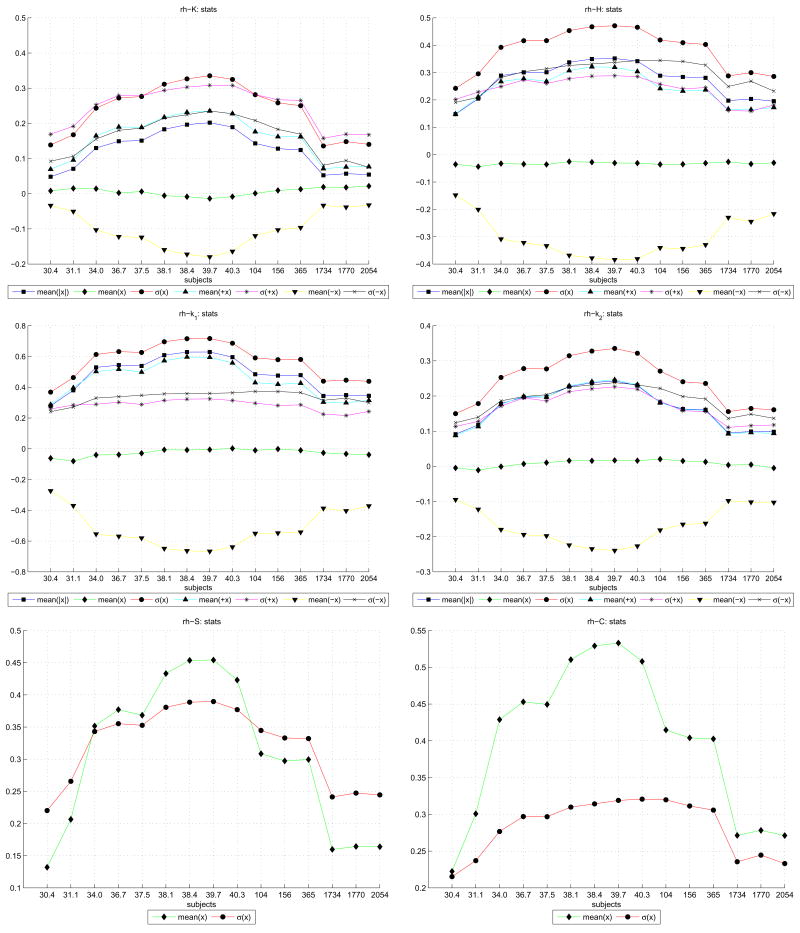
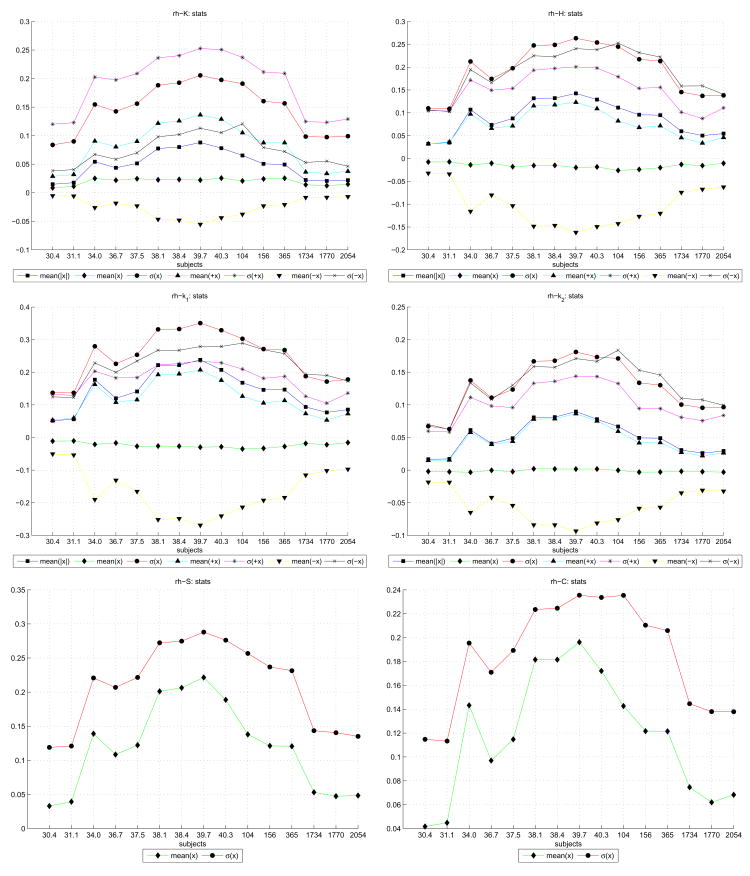
A simple statistical analysis of the curvature functions we evaluated (k1, k2, H, C, S and K) over the right hemispheres is shown in Figure 10. Each graph has line plot graphs for the mean of the curvature function over the entire hemisphere, “mean(x)”; the mean of the absolute curvatures “mean(|x|)”; the standard deviation of the curvatures “σ (x)”; and then the mean and deviation for only the negative “mean(−x), σ (−x)” and for only the positive “mean(+x), σ (+x)” curvatures. In the case of the C and S which are by definition positive, only the mean and standard deviation are provided. Taken together, they provide an overview of how curvature values in general develop across increasing subject ages and show that all curvature functions peak around term.
Figure 10.
Statistical plots of the main curvature functions across right hemisphere of subjects (subject age is shown above the legend in each plot). Within each plot are several trajectories denoting the mean and deviation of curvature values. These values are taken across the entire reconstructed surface and denoted x. For each x ≥ 0 positive values only are denoted by +x; and the x < 0 negative values only by −x.
In Figure 10, we note that all the curvature functions showed in general a trend in which specific positive and negative curvature measures increased with the age of the neonate subjects, and peaked absolutely at term (39–40 weeks CGA). Post-term, a gradual decline across the children and then through the adult subjects was observed. Note also that this trend is only apparent when separating each curvature measure into positive and negative components. The overall curvature maps, indicated by the “mean(x)” in the plots, showed little change (although the deviation σ (x) of the overall curvature maps did peak at term).
While the results presented here report primarily on the right hemisphere, no significant deviations in overall trends and observations with the left hemisphere were found. The small data set used here is to show that these measures can be performed and to identify overall trends. With larger data sets hemispheric and gender differences are expected to emerge. In the wavelet analysis of Yu et al. (2007) differential growth between the left and right hemisphere was predicted by the fitted Gompertz model, but this was an extrapolated prediction occurring at a younger age than our youngest neonate in this study.
In particular, for the H, k1, and k2 curvature plots (right panel, first row; both panels second row), the standard deviation of the curvature values was higher than any of the mean curvatures. Given that in the case of H and k1 the the overall mean was negative, this suggests that there was more variation in the curvatures of outward bulges than inward indentations, and that extrinsically the gray/white surface had a majority outward “cylindrical” folding profile. For the k2mean, however, which was mostly positive across the subjects, we can speculate that smaller “spherical” folds dimpled inwards in the surfaces.
Consider now the k1 and k2 plots of Figure 10. The mean positive curvatures and mean negative curvatures (as well as their respective deviations), we see that all four trajectories peak close to term (between 38 and 40 weeks CGA). This has the surprising implication that the neonate brain at term has mean positive +k1 and mean negative −k1 curvature values that are in general higher than the adult. This can be geometrically interpreted as deeper sulcal troughs and higher gyral peaks at term than adulthood – the neonate is more sharply folded than the adult.
The average k1 (combining both positive and negative) stays generally constant and slightly negative, but does have measurably higher deviation at term than the child and adult subjects. The average k1 is also slightly negative indicating that the gyral crests are more sharply curved (folded) and/or cover a larger area than sulcal depths. However, since the mean k1 curvature remains mostly negative, we can deduce that for the term neonates the gyri, though contributing less actual folding values, contribute much higher negative curvatures than their sulci. Absolute values of k1 increase until term with magnitude of the mean −k1 always larger than the mean +k1. This indicates that gyri and sulci become more folded until term with the degree of folding or surface area larger on the gyral crests than the sulcal depths. There is less change in the sulcal curvature (+k1 values) from term onwards. The gyral curvature (−k1) was much smaller in the adults compared to the term neonates and children. The standard deviation of negative −k1 values is always greater than +k1 values from term onwards suggesting more variability in the curvature of gyral crests than sulci.
In contrast, consider k2 which is always smaller than k1 and can therefore be thought of as describing the curvature of the less dominant folding. This “smaller” curvature/folding will tend to run opposite to the k1 direction. Since the k1 direction runs down gyral crests and up sulcal troughs, k2 will general describe curvatures that run along the long axis of gyri/sulci. Note in Figure 10 that there is a close balance of negative and positive k2 values while the mean absolute value increased to term and decreased with age thereafter. This indicates that the undulations running along gyral crests and sulci are balanced positive and negative and are maximal in magnitude of curvature at around term. The balance of positive and negative k2 values can be seen in the plots of centroid movements derived from histograms of positive and negative k2 values.
3.7. Stage 7: Histogram-Centroid Classifier
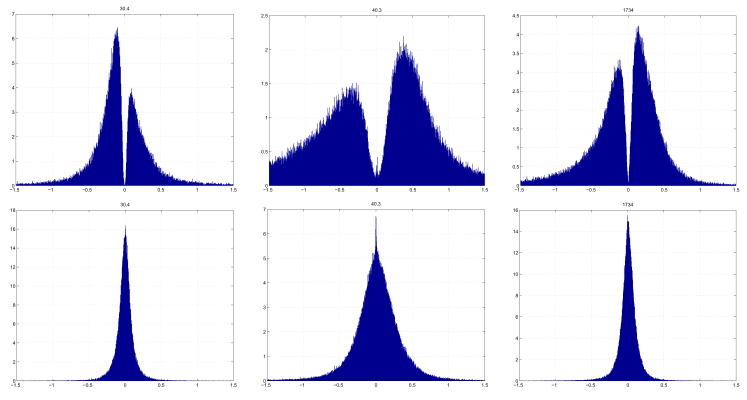
Consider now the curvature measures and the manner in which they change across different subjects. One simple technique of representing the curvature distribution across a surface is with a histogram analysis of curvatures values, as in Figure 11. The 30.4 week CGA is shown on the left, with its k1 histogram at top, and its k2 histogram at bottom. The x-axis of the histogram shows actual curvature values, and the y-axis indicates the (normalized) occurrences of these values. In this manner, the histogram illustrates a curvature distribution map of either k1 or k2 for a single subject. For the purposes of this paper, we performed a global histogram analysis on the entire reconstructed surface that was not biased to any specific brain region.
Figure 11.
Normalized histogram plots of k1 (top) and k2 (bottom) curvatures across entire brain surfaces. On left, the youngest neonate at 30.4 weeks CGA. In middle the term neonate at 40.3 weeks CGA. On right, an adult subject. The x-axis of each plot shows curvature values, and the y-axis the occurrences of these curvature values across the entire brain of a particular subject.
Of the studied curvature functions, the k1 curvature showed the most marked and noticeable evolution across subjects. In terms of shape, it comprised two peaks, one negative, one positive. The notch near zero can be understood since k1 curvatures are almost by definition rarely zero (unless the surface is completely flat at that point). For the youngest subject, the negative peak was higher than the positive; however with increasing age, this discrepancy vanished, until post 34 weeks the positive peak was larger, with an increasing trend until term. Post term and through the child subjects, the positive peak eroded again slightly with a similar, but decreased positive gain in the adult subjects. The k1 histograms show a shift from primarily negative to positive with increasing age. This implies that the premature brain is primarily an outward curving surface whereas in the term and post term brains the sulcal area increases, shifting the bulk of curvatures to the positive. The k2 histogram appears to show little change in distribution.
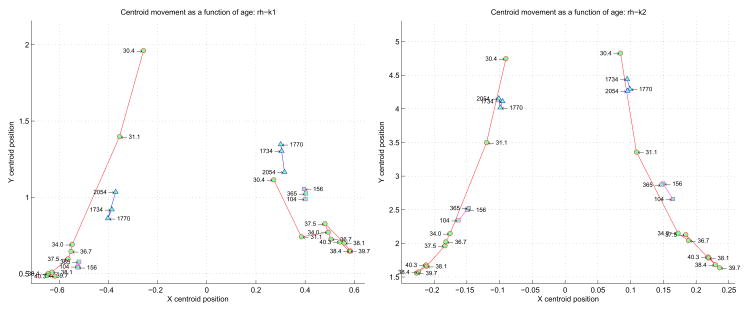
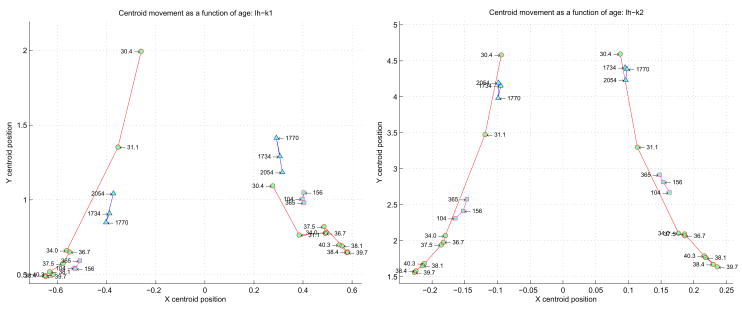
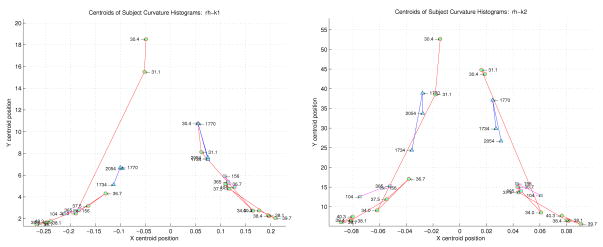
One simple and intuitive way to analyze these curvature histograms and extract descriptive features is by performing a “centroid” analysis as described in Section 2.7. For a curvature function, the positive and negative values are processed separately, providing two centroids. This set of ordered pairs for a given curvature function across all the subjects can be plotted, showing a trajectory that is implicitly time evolved (each successive point is the centroid of an increasingly older subject), as shown in Figure 12 for the right hemisphere and 13 for the left hemisphere. The left and right halves of each plot correspond to the centroids of the negative and positive curvatures. Neonates are represented by circles, the children by squares, and the adults by triangles. Note how the different groups of subjects cluster together, particularly on the positive k1 centroid side. Also note that the temporal evolution of both positive and negative centroids for k1 and k2 tends to show increasing curvature (x value) with fewer points with the same curvature (y axis) to term. After term, curvature tends to decrease again with more points on the surface having the same curvature.
Figure 12.
Centroid analysis derived from the normalized histograms of all the subjects’ k1 (on left) and k2 (on right) curvatures. The negative and positive halves of each principle curve are considered separately on the left and right halves of each plot. Each point in the plot corresponds to a specific subject, labeled as shown. The neonates are represented by the circles, the children by the squares, and the adults by the triangles. The x-axis represents the centroid of an entire k1 distribution for a subject (on left) and an entire k2 distribution (on right). The y-axis represents the centroid of the number of occurrences of each k1 value (on left) and k2 value (on right).
The centroid plots show the same general evolution: the youngest subjects are higher and closer to the plot center (the x zero centroid), and with increasing age progress “downwards” and “outwards”. This motion can be intuitively understood geometrically: initially the curvature values are small (i.e. close to the x zero centroid), and most of the curvatures are of this nature (i.e. relatively high on the y centroid axis). With time, however, progressively more and more higher valued curvatures are added to the surface. The preponderance of these higher valued curvatures tend to pull the centroid “outwards” (i.e. away from the low curvature values close to the x zero centroid), and “downwards” (higher valued curvatures add to the “wings” of the histogram plots). The longer the wings, the more the centroid moves “down”.
Despite the low sampling resolution, we can make several important observations. If we disregard the two youngest neonates, we can readily discern three spatially separate groups of clusters: the neonates from 34 weeks to term, the pediatric cases, and the adults. This is interesting since there is no age axis in the plot – nonetheless, the three major age groups cluster together spatially. It is interesting to speculate where subjects with pathological cortical development might cluster in such an analysis.
Note that we are not proposing that the histogram-centroid approach is a primary classifier designed to discriminate between different subjects’ curvature based on age. Rather, we make the specific observation that the histogram-centroid shows some interesting properties that cluster certain age-based subjects together. Future work will explore the utility of using histogram-centroids as feature vectors, in particular between normal and abnormal populations of the same age.
Regarding the neonates specifically, the two youngest subjects in both the k1and k2 plots are spatially noticeably removed from the post 34 week CGA subjects. This would indicate that as a group the youngest neonates prior to 34 weeks are topologically quite different from the post 34 week subjects, and that by extension most folding occurs prior to 34 weeks. Furthermore, the bulk of k1 curvatures across the older neonates are positive (sulcal folding), while the adults have most of their k1 curvatures negative (gyral folding).
3.8. Stage 8: Scale Factor Filtering and Analysis
The final pipeline component is a Gaussian-curvature based variable-radius filter. As we discussed in Section 2.8, we believe that separating the contribution to curvature from scaling and folding in a biologically significant manner is quite complex. We propose, therefore, to use the Gaussian curvature K as a filter to flag parts of the surface that are biologically interesting. These are areas where the surface has sheared/stretched – and thus have intrinsic curvature changes that K is ideally suited to measure. Such areas denote, we believe, regions where the surface starts to fold and deviate away from an essentially flat hull to form gyri and sulci.
Biologically, the overall shape of the brain curves at a considerably larger radius than the curvature of gyri and sulci. In fact, the radius of curvature for sulci and gyri across all ages is only really interesting for radii smaller than about 10mm. As folding develops, folds start with small radii that increase with growth and additional folding. Thus, for a given radius, we wish to flag all areas that might show shearing at that radius and lower. Since K is proportional to the inverse squared radius, for a given radius of interest, we use K = 1/r2 as a lower threshold and flag all K > 1/r2. Conceptually, we propose to parameterize K with r in a manner analogous to the t parameter of scale-space representation. In scale-space, smaller and smaller values of t allow more and more of the original image to be represented; similarly smaller values of K allow more of the reconstructed surface to be flagged.
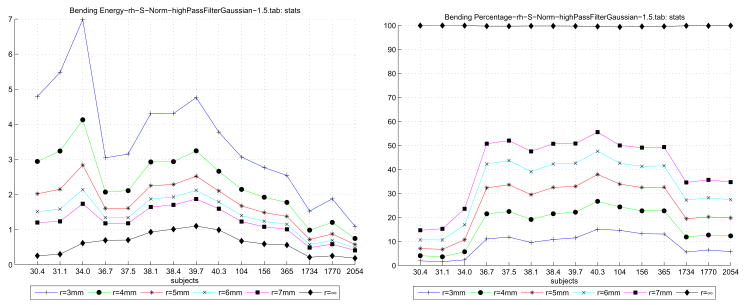
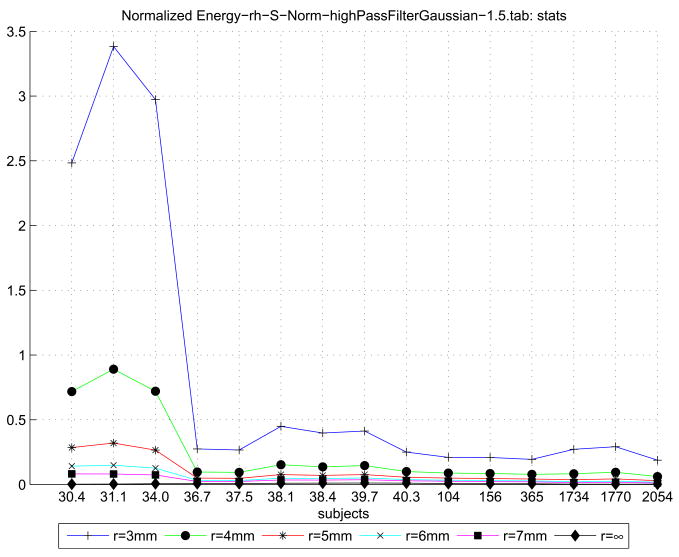
By using the K curvature map for a given surface, we performed a scale-factor filtering operation on the bending energy calculated across each subject’s gray/white surface. The thresholded bending energy per unit surface area for the right hemisphere is presented in Table 3. The table elements present for a given subject and a given threshold 1/r2 the bending energy across unit surfaces such that 1/r2 < K ≤ 1.53. This is a first order attempt to localize the bending energy function such that we operate at the scale of the gyri and sulci, and not the entire surface. In parentheses after the energy value is the percentage of surface area that satisfied the threshold. As the threshold radius is increased, more of the surface contributes to the energy value; when the threshold is removed, however, the entire surface is considered. Since large tracks of the surface along sulcal banks curve only very slightly, including these regions will tend to decrease the overall normalized energy.
Table 3.
The unit-area bending energy of each reconstructed surface is thresholded by curvature radius r (shown along the top row). The table itself presents, for each subject’s right hemisphere and for each 1/r2 threshold, the percentage area on the gray/white surface such that 1/r2 < K ≤ 1.5 and the area normalized bending energy for these vertices. The final column is the area normalized bending energy over the enter surface where K ≤ 1.5.
| r (mm) | 4.00 | 5.00 | 6.00 | 7.00 | ∞ |
| 1/r2 (mm−2) | 0.06 | 0.04 | 0.03 | 0.02 | |
| l (mm) | 0.98 | 0.99 | 0.99 | 0.99 | 1.00 |
| 4A/π | 0.96 | 0.97 | 0.98 | 0.99 | 1.00 |
| 30.4 | 2.84 (03.26%) | 1.87 (05.94%) | 1.38 (09.11%) | 1.07 (12.77%) | 0.21 (99.96%) |
| 31.1 | 2.62 (02.80%) | 1.75 (05.40%) | 1.28 (08.90%) | 0.99 (13.14%) | 0.23 (99.98%) |
| 34.0 | 3.49 (04.72%) | 2.36 (09.18%) | 1.76 (14.94%) | 1.42 (21.35%) | 0.49 (99.97%) |
| 36.7 | 1.87 (18.75%) | 1.43 (28.74%) | 1.18 (38.28%) | 1.03 (46.82%) | 0.58 (99.79%) |
| 37.5 | 1.90 (18.61%) | 1.41 (29.13%) | 1.16 (38.84%) | 1.01 (47.12%) | 0.57 (99.77%) |
| 38.1 | 2.67 (16.87%) | 2.03 (26.52%) | 1.67 (35.63%) | 1.46 (43.76%) | 0.79 (99.85%) |
| 38.4 | 2.68 (19.14%) | 2.06 (29.52%) | 1.72 (38.83%) | 1.51 (47.10%) | 0.86 (99.84%) |
| 39.7 | 2.89 (19.51%) | 2.22 (29.64%) | 1.85 (38.93%) | 1.63 (47.04%) | 0.91 (99.79%) |
| 40.3 | 2.48 (23.22%) | 1.93 (33.67%) | 1.62 (43.10%) | 1.43 (51.13%) | 0.84 (99.67%) |
| 104.0 | 1.93 (18.76%) | 1.46 (27.34%) | 1.19 (35.44%) | 1.03 (42.94%) | 0.50 (99.51%) |
| 156.0 | 1.96 (18.02%) | 1.47 (26.88%) | 1.19 (35.45%) | 1.02 (43.29%) | 0.51 (99.63%) |
| 365.0 | 1.73 (18.16%) | 1.30 (27.20%) | 1.07 (35.76%) | 0.92 (43.57%) | 0.47 (99.68%) |
| 1734.0 | 0.97 (11.87%) | 0.70 (19.47%) | 0.56 (27.26%) | 0.47 (34.62%) | 0.21 (99.86%) |
| 1770.0 | 1.15 (12.71%) | 0.83 (20.25%) | 0.66 (28.20%) | 0.55 (35.67%) | 0.24 (99.82%) |
| 2054.0 | 0.77 (12.35%) | 0.58 (19.81%) | 0.47 (27.43%) | 0.40 (34.75%) | 0.18 (99.88%) |
The first four rows present information pertaining to the surface area of a spherical cap and arc length across a single 1×1 mm voxel face for different radii of osculating spheres. The radius of curvature is given the first row as r, while the actual thresholds for the absolute Gaussian curvatures are defined by 1/r2 (second row). The length of an arc across a voxel face is given by l (third row) and the surface area of the spherical cap as a percentage of the ideal circle inscribed in the voxel face is given by 4A/π (fourth row). The arc length, l is defined by Equation 13, and the surface area of the applicable spherical cap A by Equation 14. The table shows A divided by the ideal circle area in a voxel face, π/4. This fraction indicates how close to the hypothetical ideal “flat” surface area we are for increasing r. As the sphere increases in size, its cap across a single voxel becomes increasingly flat while the the cap arc length, l approaches 1.00 mm and the surface area fraction 4A/π approaches unity.
Plots of the mean and area normalized bending energies, as well as percentage vertices and percentage area at each threshold level are shown in Figure 14.
Figure 14.
Plots of the right hemisphere bending energy profiles at different thresholds. On the left, the per unit area bending energy across all the subjects at different thresholds. As the threshold is increased, increased surface with lower curvature is considered. This tends to decrease the normalized bending energy and successive threshold’s plots are “lower”. On the right, the corresponding percentage of the surface that was considered at each threshold. Here successive threshold’s plots are “higher” as more of the surface contributes.
We expect that curvature radii on the scale of between 3 to 9 mm would capture primarily the curvatures of the folds for all our subjects, while ignoring the underlying curvature of the baseline brain shape, as well the smooth gyral/sulcal banks. In the table, the bending energy function taken across the entire surface is given in the final column, along with the percentage of the surface area that was evaluated. Note that there was an implicit low pass filtering K ≤ 1.5mm−2 on each table to clean away any Gaussian curvatures that are unstable and due to reconstruction noise – these curvatures typically occur at a sub-voxel radius and have very high values, appearing as high valued spiked outliers in a histogram analysis.
The un-thresholded bending energy (the lowest plot in the left panel of Figure 14) showed a well established trend, viz. that the values peak around term and decline post term. Also, since the un-thresholded surface has proportionately large tracts of surface area with low K curvatures, the final normalized bending energy value for the un-thresholded surface will be lower than the energy calculated across thresholded surfaces. In fact, we note as expected that as our threshold admits more and more of the surface, the bending energy declines due to the increasing lower valued K contribution.
The percentage of surface area contributing to the energy function at each threshold level is shown on the right panel of Figure 14. As the threshold radius is increased, the percentage surface contribution increased. Note that across the thresholds considered where r = {3,4,5,6,7} mm, the term neonate again had the most normalized surface area contributing to the bending energy function.
Finally, consider Figure 15 which illustrates for all the subjects the energy contribution normalized over the contributing area. This relation is described by
Figure 15.
The energy contribution at different threshold levels normalized to the surface of the right hemisphere. For each threshold, starting with the blue r = 3mm and extending to the un-thresholded r = ∞, the normalized bending energy across the thresholded surface area for each subject is shown.
| (18) |
where Eb(r) corresponds to the left panel of Figure 14 and A(r) the right panel. This relation gives an indication of how much relative bending energy is contributed by the parts of the thresholded surface that are folding. In Figure 15 note that for the relatively small amount of normalized surface that is bending, a disproportionately high bending energy is contributed by the folding of the young neonates pre 36 weeks CGA – possibly reflecting the high energy required to start and expand the cortical folding process. In fact, the r = 3mm threshold, which filters the sharpest folding parts of the surface, contributes a notably high energy.
3.9. Limitations
With any methodological study that also reports on some of the findings resulting from such a method, it is important to understand any limitations – be they with the technique itself, or with the underlying data itself that is processed. As far as this particular paper is concerned, possible limitations can be grouped into three general categories, viz.: number of subjects and statistical power; measurement noise and its effects; reconstruction noise and its effects. Note that the noise effects discussed here are concerned with simple geometry effects and not with physical scanner parameter and image sequencing parameters – i.e. we do not consider image acquisition signal-to-noise and contrast-to-noise effects, magnetic field distortions, etc. For the most part, we assume that the resultant noise is manifest in geometric ambiguities resulting from resolution and segmentation effects.
On first consideration, the actual number of subjects processed appears problematic. Nine neonate cases, three pediatric, and three adults is from a purely statistical perspective not very meaningful. Given this limitation, our emphasis here is not on the particulars of any one subject at a specific age; rather we are interested in any generally measurable trends across all our subjects. Viewed from this vantage point, we are reporting on fifteen subjects. Moreover, we have clustered our neonates so that they span a period of known marked folding changes. Given the expected wide changes and deviation in curvature and folding across the 30 to 40 week period, statistical analyses might themselves be problematic by definition (consider that registering subjects – the first step for a statistically meaningful longitudinal study – with such marked deviations in folding is in itself a non-trivial problem, and can in fact introduce such distortions as to damage the data itself). Note also that particular attention was paid to the segmentation of the neonates – all were manually segmented using well documented techniques. Nonetheless, we simply do not have the number of subjects to fully explore gender differences and hemispherical asymmetries.
In order to provide at least some meaningful results, we carefully chose to test our methodology with subjects that we know a priori to have significant folding differences, and broadly used representatives from three samples: neonates, children, and adults. Also, to address the lack of subject numbers, we chose to use a well documented and rigorous manual segmentation process. In this manner we hoped to address at least part of the lack of statistical power: viz high accuracy using low sample points. Current state of the art automatic segmentation algorithms are still inferior to expertly manually segmented surfaces. With automatic processing, large data sets need to be batch processed to increase overall accuracy. We achieve high accuracy without needing many samples. Of course, this does not address the problem of how representative each specific subject is of a given age class, particularly in the case of the neonates. Nonetheless, given the lack of available neonate data in the field, we reasoned that our preliminary results, though lacking in number, might be useful.
Our primary purpose with this work, as mentioned in the introduction, is the presentation of a methodology for analyzing cortical folding from a curvature analysis approach. We are not presenting a detailed analysis of the approach on a large dataset. Nonetheless, as a validation for the method, we carefully selected a sample population spanning a wide range of folding patterns. If our analysis can present trends and identify a dispersion on such a small data set, it does suggest our approach holds some merit; moreover, it also suggests that with more data points our approach should reveal additional insights.
Of course, we would not assert that careful selection of subjects or preparation of data addresses all concerns. Measurement noise on the original MRI data, and consequently on the manually segmented slices must also be understood and bounded. The most obvious case of such noise would be single voxel errors on tissue boundaries – a single voxel white matter being segmented as gray, for example. We can visualize such an error as a cubic “bump” on a smooth plane, which would result in a “brimless hat” or protruding dimple in a straightforward surface reconstruction. In the simplest sense, this “hat” would have curvature on its sides, leading to a sharply curved hemispherical apex. This apex marks the highest curvature for this segmentation noise, and would be described by an osculating sphere with radius of one-half voxel diagonal, i.e. voxel. Since curvature is the inverse of this radius, in a 1×1mm isotropic space, this would be a curvature of . Note that our in-plane scanning resolution was often slightly less than 1×1mm, so this “curvature noise” figure of 1.5 mm−1 is in fact conservative – the actual curvature noise resulting from single voxel misclassification should in fact need to be up-scaled and is greater than 1.5 mm−1.
Aside from possible measurement noise, we also need to consider reconstruction noise. During FreeSurfer reconstruction, some manual topological fixing is required. These errors can result from surface inconsistencies between a series a slices in an anatomical plane. Even when a topology has been “fixed”, localized areas of extremely high curvature (akin to rose “thorns” jutting from the surface) might result. Since the surfaces stem from an underlying tessellated mesh with typically more than 120,000 vertices, the apparent “resolution” of the surface is in practice much higher than the resolution of the original image. So too, the resolution of these “thorns” – often being sub-sub voxel resolution. In fact, careful manual examination of the surfaces to identify any “thorns” shows that the apparent resolution is an order of magnitude higher than the data itself, with curvatures easily greater than 10mm−1(often higher than 100mm−1), implying radii of curvature much greater than 0.1 mm. In fact, a radius of 0.1 mm is already 10 times higher than a 1×1 mm sampling resolution, and unrealistic to measure. If we assume that at a 1×1 mm in-plane resolution we can still unambiguously resolve radii of curvature of 0.5 mm, it would place a curvature boundary at . Any line curvatures above 2 mm−1 should be viewed as increasingly unreliable. Similarly, any surfaces that have a Gaussian of are probably too sharp to be justifiably supported by our original data.
4. Conclusion
This paper presented a methodology for characterizing human cortical folding based on an analysis of functions of principal curvature. A technique for extending FreeSurfer to process semi-automatically segmented brains was presented. An MRI volumetric processing pipeline was used to validate surface measures obtained from surface reconstructions. This multi-stage pipeline is inherently based around FreeSurfer, and offers several extensions that allow for processing semi-automated segmented volume data (from any age group), as well as offering a wide variety of curvature functions derived from reconstructed surfaces. Our initial data analysis on a small subset of meticulously segmented data suggests that our measures can detect differences in gyral folding.
Nine neonates (aged 30.4 weeks CGA to 40.3 weeks CGA), three pediatric subjects (aged 2, 3, and 7 years), and three adults (aged 33, 37, and 39 years) were imaged, and the resultant MRI data processed by the curvature pipeline. The initial data analysis showed that across all our subjects, curvature measures for the most part peaked at term, and then decreased through subsequent childhood, with a gradual decline into adulthood. We believe that the general behavior of our measures track more than simple changes that can be attributed to growth/scaling alone, but measure also some fundamental properties of changes in curvature and hence folding at the gyral/sulcal scale.
A histogram-centroid analysis showed that the principal curvatures of different age populations (neonate, pediatric, and adult) in fact cluster differently, particularly if the pre-34 week CGA neonates are not considered. By considering the behavior of the negative and positive components of curvature separately, the centroid plots demonstrated how curvature measures travel “downwards” and “outwards” (i.e. become more folded with higher curvature) as neonates approach term, and then this trend is reversed through the children and adult subjects.
By filtering an integrative bending energy function based on thresholding K values, we also noted that the surface energies peak at term. Moreover, we noted that though the younger neonates had lower thresholded bending energy in their surfaces, the per-unit area bending energy contribution was higher than the term neonates. In fact, it would appear that the youngest neonates had the most energy dense surfaces in areas where gyral folding starts to occur. This energy density declines through to term, and continues a gradual decline post term through to adulthood. Comparatively speaking, the adults had proportionately the least per-vertex and per-unit area energy in the parts of the gray/white surface that was folded at the gyral level.
Having established with this study the general architecture and behavior of the curvature-analysis pipeline, we hope in future to augment the pipeline with additional curvature map functions. Since this work presents the baseline curvature results on “raw” (i.e. spatially “un-normalized” data), future versions of the pipeline can provide various data normalization capabilities that can be meaningfully contrasted with this baseline. In a related vein, the K-based filtering developed in the context of the bending energy analysis can be extended to centroid-histogram classifier as well.
Additional future work will examine more closely the time period where folding seems to increase quickest, i.e. between 30 weeks and 34 weeks CGA. This current work considered the gray/white surface exclusively. We hope to also similarly analyze the outer pial surface, which we postulate that due to the differential growth profiles of the cerebral cortex will be more “stretched” topologically than the gray/white and might have an intrinsically different topology than the gray/white surface.
We also hope to compare our results of our analysis to surfaces that are reconstructed using more automated (and thus faster) methods, using our highly accurate but time-intensive manually segmented surfaces and measures as a reference standard.
Finally, we hope to also examine the curvature profiles of gray/white surfaces of pathological developmental cases. It is our belief that the folding/curvature properties of the human brain might be a more sensitive marker tracking its development than simple analysis of volume measures, and should this be the case, might allow for more meaningful and earlier therapeutic intervention if developed within a clinical setting.
Figure 13.
Left hemisphere centroid analysis derived from the normalized histograms of all the subjects’ k1 (on left) and k2 (on right) curvatures. The negative and positive halves of each principle curve are considered separately on the left and right halves of each plot. Each point in the plot corresponds to a specific subject, labeled as shown. The neonates are represented by the circles, the children by the squares, and the adults by the triangles.
Acknowledgments
Support for this research was provided in part by the National Center for Research Resources (P41-RR14075, R01 RR16594-01A1 and the NCRR BIRN Morphometric Project BIRN002, U24 RR021382), the National Institute for Biomedical Imaging and Bioengineering (R01 EB001550), the National Institute for Neurological Disorders and Stroke (R01 NS052585-01) as well as the Mental Illness and Neuroscience Discovery (MIND) Institute, and is part of the National Alliance for Medical Image Computing (NAMIC), funded by the National Institutes of Health through the NIH Roadmap for Medical Research, Grant U54 EB005149. Information on the National Centers for Biomedical Computing can be obtained from http://nihroadmap.nih.gov/bioinformatics.
5. Appendix A – principal curvatures Overview
The study of surfaces and their properties is a fundamental branch of mathematics (do Carmo, 1976). FreeSurfer uses aspects of the differential geometry of surfaces to reconstruct three dimensional surface models, which are tessellated structures that represent a “wire-frame”.
Consider Figure 16 which shows a hypothetical tessellated “pyramidal” structure. A central vertex, A, is surrounded by 5 neighbors (BCDEF). This wire-frame pyramid underpins a smooth surface that is the best fit to the entire tessellated structure as a whole. At node A, the average curvature between the node and the curves connecting it to each of its neighbors is recorded, as is the distance between the node and each of its neighbors.
Figure 16.
A representation of a FreeSurfer node (A) and surrounding neighbors (BCDEF). A tessellated “pyramid” connects all these vertices together. Edges AE, AB, and AC are highlighted.
A qualitative description of curvature is presented in Figure 17 which shows several “sulci” and “gyri”. Simply stated, for a plane curve, the curvature at a given point is proportional to the reciprocal of the radius of an osculating circle and has units of inverse length (Wikipedia, 2007). While more mathematical descriptions are certainly important, the concept of curvature is neatly conveyed by osculating circles. In Figure 17 we note two general cases: (1) on the left where a sulcus becomes narrower, and (2) on the right where “bumps” occur on the gyral crowns. If we extend the gyral/sulcal metaphor of the figure, osculating circles that are on the “inside” are colored green (light gray in grayscle), and those on the “outside” are red (dark gray in grayscale). The intensity of the coloring is proportional to the size of the radius.
Figure 17.
A conceptual illustration of curvature. The measure of “curvature” of a curve can be understood by taking a series of circles that just smoothly “touch” each of the undulations of the curve. The curvature of the curve is proportional to the sum of the inverse radii of each circle. [A] and [B], effect on curvature by “compressing” sulcal extent; [C] and [D], effect of higher order “bumps” on overall curvature.
Parts [A] and [B] of Figure 17 illustrate the effect of a “narrowing” sulcal trough. This might represent an increase in lateral extent of a gyrus as it grows outwards. We note that the osculating circles for the narrower part [B] are smaller than corresponding circles in part [A]. The curvature of a shape such as [B] is thus higher than [A].
In parts [C] and [D] of Figure 17, more complex “buckling” of an otherwise smooth surface introduces additional osculating circles, and correspondingly the overall curvature of the structure shown increases. It is important to note that separating “positive” and “negative” curvatures from each other allows us a more accurate measure of the total curvature of the shape. A simple numerical mean of the curvatures found by summing the inverse radii of the osculating circles might mask the additional buckling that has occurred.
In addition to this average curvature data, FreeSurfer calculates, based on a mathematical description of the entire surface covering this pyramid, the mean and Gaussian curvatures. The mean curvature H of a surface  is a measure of curvature that comes from differential geometry and that locally describes the curvature of an embedded surface in some ambient space, e.g. Euclidean space.
For example, let the surface  denote the surface fitted to the tessellated structure in Figure 16. If we consider all curves Ci with curvature values Ki passing through the vertex A, we should find one maximal and one minimal valued curvature, k1 and k2 respectively. These are called the principal curvatures. The mean curvature H is the average of the principal curvatures, and the Gaussian curvature K is their product,
| (19) |
| (20) |
The Gaussian curvature is an intrinsic property of the topology of a surface. Intrinsic curvature should not be confused with extrinsic curvature. A classic example of “intrinsic” curvature is that of an ant tied to a fixed point P on a surface with a string of length r. The ant then walks around the fixed point while keeping the string completely taut. After one complete revolution about P the ant measures the distance l traveled. On a completely flat surface, this distance will be exactly l = 2π r, i.e. the circumference of a circle. On intrinsically curved surfaces, l will deviate from a perfect circle according to the shape of the surface (Wikipedia, 2007).
Simply stated, a flat square sheet remains intrinsically a flat sheet no matter how it is extrinsically folded, provided it is neither stretched nor torn. Consider that such a sheet has zero Gaussian curvature when spread flat, and still has zero curvature when folded into a cylinder; obviously its extrinsic appearance is quite different in these two cases. Of course, a flat square sheet cannot be folded into a sphere - this would require stretching and shearing; consequently the Gaussian curvature of a sphere is different to that of a cylinder.
Consider also that although the Gaussian curvature is preserved and intrinsic, it is the product of a maximal and a minimal component
| (21) |
| (22) |
and is thus inherently non-linear and discontinuous. In particular, it is meaningful to consider functions that are independent of the particular arg{min, max} functional assignment. Ideally speaking, such candidate functions should be instances of basis functions that span the domain of a generalized two variable functional.
In general, for a function space of two functions, f1(x) and f2(y), a functional basis encompasses a linear combination of the summation and product of the two functions
| (23) |
One such functional could be ax + by + cxy + dx2 + ey2. With reference to Equation 21, the square difference of the two principles is an instance of the generalized functional:
| (24) |
| (25) |
and has the desirable trait of being positive definite and independent of the particular assignment of k1or k2. Note that of course we should express the curvatures as k1(s) and k2(s) to emphasize that these curvatures are functions of a spatial variable s. For ease of readability we shall drop this explicit convention in this discussion.
Let us now consider some qualitative implications of the above equations. First, the Gaussian curvature itself, with reference to the folding of a developing brain can give an indication of the extent and type of folding. Consider Figure 18, which shows a flat sheet initially deformed by two cylinders. Intrinsically, the sheet has not changed its topology globally or locally and its Gaussian curvature remains zero.
Figure 18.
“Cylindrical” folding. A flat sheet is deformed beneath two cylinders. Although the sheet develops a curvature along the k̂1 direction, its curvature along k̂2remains zero.
While still extrinsically “flat”, at each point on the sheet the curvature in all directions is zero; the product thus of k1k2 = 0 ×0 = 0. In the “folded” regions, a curvature develops in one direction, k̂1 but remains flat along the axis of the cylinder, and the product remains zero. We could thus speculate that on a developing cortex, as the initial folds develop, should they be “cylindrical” in nature, i.e. curve primarily along one direction while remaining flat along another, we should expect to see a Gaussian curvature that is locally zero, or close to zero.
As the folds become more complex, however, they develop a local curvature along both the maximum and minimum directions. In the most extreme case, this results in a spherical deformation as shown in Figure 19. Here the flat sheet has experienced an intrinsic folding modification. With reference to cortical development, we could speculate that as the cortex begins to fold in more than one direction, we should expect to see a general increase in overall Gaussian curvature compared to earlier stages.
Figure 19.
“Spherical” folding. In order to create a spherical bubble or depression in a flat surface, the surface needs to be stretched and sheared so that curvature develops along both the k̂1 and k̂2 directions.
Empirically, we can consider Equation 24 to glean additional insights into folding development. This equation has the conceptual effect of emphasizing the difference between k1 and k2. Where k1 is large and k1 ≫ k2, the square difference will tend towards . Where k1 ≃ k2 the square difference will tend towards zero. Thus, areas with large relative k1 curvature will be amplified, and those areas with little relative curvature difference will be attenuated. The extent of this amplification and attenuation is directly related to the relative difference, and this square difference can be thought of as a non-linear point spread function.
Within the topological literature, some oft used descriptions of “curvature” are the shape index and the curvedness. The shape index (SI) and curvedness (C) are defined as
| (26) |
and
| (27) |
This paper did not explicitly consider the shape index, mostly because for regions of interest, k1 ≫ k2, and the SI converges to −0.5. For other regions, particularly noisy ones where k1 ≃ k2, the denominator tends to a value just negative of zero and the expression as a whole saturates at −1.0 – thus the SI function for the cortical surfaces in this paper has a very limited dynamic range.
The square principle difference, S, is in fact proportional to the square of the curvedness function, C
| (28) |
Both C and S provide subtly different views on the same underlying curvature data. The square principle difference tends to emphasize regions with relatively large differences between the principle curves, and is thus well suited to reveal the large primary folds of the developing cortex. The curvedness function on the other hand has a more diffuse focus, returning information on less “sharp” folding. This lower discriminatory function can reveal smaller bumps and ridges, but is also more noise sensitive.
We believe that S to be the better measure for the surfaces analyzed in this paper due to its enhanced signal-to-noise ratio over C. By tending to highlight only areas where k1 ≫ k2, the principle square difference tracks the development of folding across the cortex in an easily visualized manner. This folding is illustrated in Figure 23, where the three youngest neonates clearly show primary folding spreading from the 30.4 weeks anteriorly and posteriorly. In fact, by 34 weeks, the folding has spread across the entire cortical surface, and subsequent development is mostly secondary and tertiary folding based around these primary folds. This observation is strengthened by the centroid analysis of the k1 curvature, which clearly shows the three youngest neonates clustering together, while the remaining subjects (including older neonates, pediatric subjects, and adults) forming a separate cluster.
Figure 23.
Regional variation in ridge folding as shown on the inflated right hemisphere. The principle square difference function, S, is projected on the inflated surfaces of age-ordered brains. From top left, reading across in weeks CGA: 30.4, 31.1, 34.0. Second panel from left to right in weeks CGA: 36.7, 38.1, 40.3. Third panel, 2 year old, 3 year old, and 7 year old. Bottom panel shows the three adult brains. Note that the relative size difference of brains in this figure is not to scale.
6. Appendix B – A Fractional Area Normalization of Curvature Functions
As discussed in Section 2.8, scale and folding effects on curvature are difficult to separate. On a practical level, however, we can weigh curvature values with localized surface reconstruction specific information. Consider that in a FreeSurfer reconstruction, the number of vertices on a surface is roughly proportional to the size of the surface: larger surfaces will have more vertices. Also, at a specific vertex, the area of the local triangles comprising the vertex area is variable and related to the curvature of the surface at that vertex.
A given surface will have area A. For a vertex index i on this surface with area ai and curvature function value fi, we can normalize the curvature function value with the fractional area:
| (29) |
where k is a fixed scalar factor that might be necessary to reduce the size of the normalization. The curvature fn therefore incorporates information on the local vertex area over which it is defined, as well as the size of the whole surface.
In fact, in the general case we can parameterize an operation on surface vertex curvatures so that the curvature varies by parameter α between the original and the fractional area value:
| (30) |
with α ∈ [0..1]. In this appendix, we limit ourselves to the case α = 1. Consider the sphere illustrated by Figure 4. In a fractional area approach, for the large sphere the A/ai weight will be proportionately larger than the fractional area for the small sphere. This will tend to reduce the x-axis scale difference between the plots, thus mitigating the scale factor difference between the shapes. Of course, this approach will not completely address scale issues – nonetheless it represents one mechanism to scale point curvatures with information both local to the vertex and global to the whole surface.
Figure 20 plots the statistical results across the subjects for various curvature functions that have been normalized by the fractional vertex area. The general observation of curvature function peaking at term and declining post-term through childhood and across adults is still apparent.
Figure 20.
Statistical plots of the main curvature functions normalized by vertex fractional area across the right hemisphere of subjects (subject age is shown above the legend in each plot). Within each plot are several trajectories denoting the mean and deviation of curvature values. These values are taken across the entire reconstructed surface and denoted x. For each x positive values only are denoted by +x; and the negative values only by −x.
Centroid plots for the right hemisphere data for the right hemisphere k1 and k2 principle curvature functions across the gray/white surface are shown in Figure 21.
Figure 21.
Right hemisphere centroid analysis using fractional-area normalized curvatures for all the subjects’ k1 (on left) and k2 (on right) curvatures. The negative and positive halves of each principle curve are considered separately on the left and right halves of each plot. Each point in the plot corresponds to a specific subject, labeled as shown. The neonates are represented by the circles, the children by the squares, and the adults by the triangles.
7. Appendix C – Sharpness S and Curvedness C Function across Neonate subjects
Of the curvatures measures considered in this paper, perhaps the most interesting from a regional variation perspective is the principle square difference, or sharpness function. As mentioned earlier, this function tends to emphasize curvatures that have a relatively large k1 k2 differential (i.e. as one would find on a “cylinder”) and attenuate curvatures where this differential is low (i.e. where the surface is flat or “spherical”). This property makes the principle square difference an excellent candidate for “ridge detection”. In this context a “ridge” can be found at a gyral peak, or deep in a sulcal trough.
Consider Figure 22 which shows comparative projections of principle square difference curvature S, and the curved-ness C for different subjects. The sharpness, S is shown on the inflated white matter surface, as well as on the un-inflated white matter surface. At top of the figure is the youngest neonate at 30.4 weeks CGA, progressing down through the 31.1 week CGA, the 40.3 week CGA subject, and finally an adult.
Figure 22.
Comparative projections of the curvedness C and sharpness S functions. On left and center column panels we have C and S shown on the inflated white matter surfaces. On the right panel, S is shown on the non-inflated white matter surface. From the top, the 30.4 week CGA subject, the 31.1 week CGA subject, the 40.3 week CGA subject, and an adult subject. Note that the relative size difference of brains in this figure is not to scale.
Several observations can be made from Figure 22. Firstly, one notes that the principle square difference function clearly highlights the sharp ridges on the white matter surface (comparing the left and right panels for each subject). These ridges can be either the sharp crowns on gyral peaks, or furrowed troughs burrowing along the sulcal floor. Immediately evident is the strong regional variation in highly ridged patterns as a function of age. In the youngest neonates, folding occurs sharpest in the medial and temporal lobes, and spreads posteriorly and anteriorly from these regions.
This regional spread is further emphasized in Figure 23 which shows the square difference curvature on a series of increasingly older inflated brains. The first two rows in the figure show neonate subjects, and the last row pediatric and adult. In the first row, from left to right we have in weeks CGA: 30.4, 31.1, and 34.0; followed in the second row by (in weeks CGA) 36.7, 38.1, and 40.3. In the third row are the three pediatric subjects aged 2 years, 3 years and 7 years; the final row shows the three adults.
Folding clearly spreads anteriorly and posteriorly during the early period between 30 weeks and 34 weeks. Indeed, by 36 weeks the overall white matter folding pattern is largely fixed, indicating that primary folding is largely completed by this time. Through the remaining period until term note the lighter pattern of ridges that run either in parallel to the main ridges, or serve as short cross links between these main ridges. These lighter colored ridges tend to denote furrows and bumps along sulcal valleys. While still evident in the pediatric brains, these lighter ridges are fading and are mostly absent from the adults.
Footnotes
Histogram normalizing is not to be confused with normalizing the actual shapes of subject brain surfaces.
Of course, the reconstructed surface is faithful given the bounding constraints of the data collection, the segmentation, and the reconstruction. Each process is distorted by its own noise processes and error conditions.
The 1.5 upper cutoff is discussed in Section 3.9
References
- Amunts K, Schmidt-Passos F, Schleicher A, Zilles K. Postnatal development of interhemispheric asymmetry in the cytoarchitecture of human area 4. Anat Embryol (Berl) 1997 Nov;196 (5):393–402. doi: 10.1007/s004290050107. [DOI] [PubMed] [Google Scholar]
- Andoh J, Artiges E, Pallier C, Riviere D, Mangin J, Cachia A, Plaze M, Paillere-Martinot M, Martinot J. Modulation of language areas with functional MR image-guided magnetic stimulation. Neuroimage. 2006;29 (2):619–27. doi: 10.1016/j.neuroimage.2005.07.029. [DOI] [PubMed] [Google Scholar]
- Armstrong D, Halliday W, Hawkins C, Takashima S. Pediatric Neuropathology: A Text-Atlas. Springer; 2007. [Google Scholar]
- Armstrong E, Schleicher A, Omran H, Curtis M, Zilles K. The ontogeny of human gyrification. Cereb Cortex. 1995;5:56–63. doi: 10.1093/cercor/5.1.56. [DOI] [PubMed] [Google Scholar]
- Barkovich AJ, Kuzniecky RI, Jackson GD, Guerrini R, Dobyns WB. A developmental and genetic classification for malformations of cortical development. Neurology. 2005;65:1873–1887. doi: 10.1212/01.wnl.0000183747.05269.2d. [DOI] [PubMed] [Google Scholar]
- Batchelor PG, Castellano Smith AD, Hill DLG, Hawkes DJ, Cox TCS, Dean AF. Measures of folding applied to the development of the human fetal brain. IEEE Trans Med Imaging. 2002;21:953–965. doi: 10.1109/TMI.2002.803108. [DOI] [PubMed] [Google Scholar]
- Battin MR, Maalouf EF, Counsell SJ, Herlihy AH, Rutherford MA, Azzopardi D, Edwards AD. Magnetic resonance imaging of the brain in very preterm infants: visualization of the germinal matrix, early myelination, and cortical folding. Pediatrics. 1998 Jun;101(6):957–962. doi: 10.1542/peds.101.6.957. URL http://www.hubmed.org/display.cgi?uids=9606219. [DOI] [PubMed]
- Cachia A, Mangin J, Riviere D, Kherif F, Boddaert N, Andrade A, Papadopoulos-Orfanos D, Poline J, Bloch I, Zilbovicius M, Sonigo P, Brunelle F, Regis J. A primal sketch of the cortex mean curvature: a morphogenesis based approach to study the variability of the folding patterns. IEEE Trans Med Imaging. 2003a;22 (6):754–65. doi: 10.1109/TMI.2003.814781. [DOI] [PubMed] [Google Scholar]
- Cachia A, Mangin J, Riviere D, Papadopoulos-Orfanos D, Kherif F, Bloch I, Regis J. A generic framework for the parcellation of the cortical surface into gyri using geodesic Voronoi diagrams. Med Image Anal. 2003b;7 (4):403–16. doi: 10.1016/s1361-8415(03)00031-8. [DOI] [PubMed] [Google Scholar]
- Caviness V, Kennedy D, Makris N, Bates J. Advanced application of magnetic resonance imaging in human brain science. Brain Dev. 1995;17:399–408. doi: 10.1016/0387-7604(95)00090-9. [DOI] [PubMed] [Google Scholar]
- Caviness V, Jr, Kennedy D, Richelme C, Rademacher J, Filipek P. The human brain age 7–11 years: a volumetric analysis based on magnetic resonance images. Cereb Cortex. 1996a;6 (5):726–36. doi: 10.1093/cercor/6.5.726. [DOI] [PubMed] [Google Scholar]
- Caviness VS. Mechanical model of brain convolutional development. Science. 1975 Jun;189(4196):18–21. doi: 10.1126/science.1135626. URL http://www.hubmed.org/display.cgi?uids=1135626. [DOI] [PubMed]
- Caviness VS, Filipek PA, Kennedy DN. Magnetic resonance technology in human brain science: Blueprint for a program based upon morphometry. Brain Dev. 1989;11:1–13. doi: 10.1016/s0387-7604(89)80002-6. [DOI] [PubMed] [Google Scholar]
- Caviness VS, Kennedy DN, Bates J, Makris N. MRI-based parcellation of human neocortex: an anatomically specified method with estimate of reliability. Journal of Cognitive Neuroscience. 1996b;8:566–588. doi: 10.1162/jocn.1996.8.6.566. [DOI] [PubMed] [Google Scholar]
- Center for Morphometric Analysis. CardViews. Massachusetts General Hospital Software 1992 [Google Scholar]
- Courchesne E, Redcay E, Kennedy DP. The autistic brain: birth through adulthood. Curr Opin Neurol. 2004 Aug;17(4):489–496. doi: 10.1097/01.wco.0000137542.14610.b4. URL http://www.hubmed.org/display.cgi?uids=15247547. [DOI] [PubMed]
- Dale AM, Fischl B, Sereno MI. Cortical surface-based analysis. I. Segmentation and surface reconstruction. Neuroimage. 1999 Feb;9 (2):179–194. doi: 10.1006/nimg.1998.0395. [DOI] [PubMed] [Google Scholar]
- Kennedy DN, Meyer JW, Filipek PA, Caviness VS., Jr . Functional Neuroimaging: Technical Foundations. Orlando, FL: Academic Press; 1994. pp. 201–208. Ch. MRI-based topographic segmentation. [Google Scholar]
- do Carmo MP. Differential Geometry of Curves and Surfaces. Prentice-Hall, Inc; New Jersey: 1976. [Google Scholar]
- Fennema-Notestine C, Ozyurt IB, Clark CP, Morris S, Bischoff-Grethe A, Bondi MW, Jernigan TL, Fischl B, Segonne F, Shattuck DW, Leahy RM, Rex DE, Toga AW, Zou KH, Brown GG. Quantitative evaluation of automated skull-stripping methods applied to contemporary and legacy images: Effects of diagnosis, bias correction, and slice location. Hum Brain Mapp. 2006 Feb;27 (2):99–113. doi: 10.1002/hbm.20161. [DOI] [PMC free article] [PubMed] [Google Scholar]
- Filipek P, Kennedy D, Caviness V. Volumetric analyses of central nervous system neoplasm based on MRI. Pediatr Neurol. 1991;7:347–351. doi: 10.1016/0887-8994(91)90064-r. [DOI] [PubMed] [Google Scholar]
- Filipek P, Kennedy D, Caviness V, Rossnick S, Spraggins T, Starewicz P. Magnetic resonance imaging-based brain morphometry: development and application to normal subjects. Ann Neurol. 1989 Jan;25:61–67. doi: 10.1002/ana.410250110. [DOI] [PubMed] [Google Scholar]
- Filipek P, Richelme C, Kennedy D, Caviness V., Jr The young adult human brain: an MRI-based morphometric analysis. Cereb Cortex. 1994;4 (4):344–60. doi: 10.1093/cercor/4.4.344. [DOI] [PubMed] [Google Scholar]
- Filipek PA, Kennedy DN. Neuropsychology. 6. Elsevier; Amsterdam: 1992. pp. 301–329. Ch. Neuroimaging in child neuropsychology. [Google Scholar]
- Filipek PA, Semrud-Clikeman M, Steingard RJ, Renshaw PF, Kennedy DN, Biederman J. Volumetric MRI analysis comparing subjects having attention-deficit hyperactivity disorder with normal controls. Neurology. 1997 Mar;48(3):589–601. doi: 10.1212/wnl.48.3.589. clinical Trial. [DOI] [PubMed] [Google Scholar]
- Fischl B, Sereno MI, Dale AM. Cortical surface-based analysis. II: Inflation, flattening, and a surface-based coordinate system. Neuroimage. 1999 Feb;9 (2):195–207. doi: 10.1006/nimg.1998.0396. [DOI] [PubMed] [Google Scholar]
- Griffin LD. The intrinsic geometry of the cerebral cortex. J Theor Biol. 1994;166:261–273. doi: 10.1006/jtbi.1994.1024. [DOI] [PubMed] [Google Scholar]
- Herbert MR, Ziegler DA, Makris N, Filipek PA, Kemper TL, Normandin JJ, Sanders HA, Kennedy DN, Caviness VS. Localization of white matter volume increase in autism and developmental language disorder. Ann Neurol. 2004 Apr;55(4):530–540. doi: 10.1002/ana.20032. URL http://www.hubmed.org/display.cgi?uids=15048892. [DOI] [PubMed]
- Hilgetag CC, Barbas H. Developmental mechanics of the primate cerebral cortex. Anat Embryol (Berl) 2005 Dec;210(5–6):411–417. doi: 10.1007/s00429-005-0041-5. URL http://www.hubmed.org/display.cgi?uids=16175385. [DOI] [PubMed]
- Hilgetag CC, Barbas H. Role of mechanical factors in the morphology of the primate cerebral cortex. PLoS Comput Biol. 2006 Mar;2(3) doi: 10.1371/journal.pcbi.0020022. URL http://www.hubmed.org/display.cgi?uids=16557292. [DOI] [PMC free article] [PubMed]
- Hofman MA. The fractal geometry of convoluted brains. J Hirnforsch. 1991;32(1):103–111. URL http://www.hubmed.org/display.cgi?uids=1811015. [PubMed]
- Im K, Lee JM, Yoon U, Shin YW, Hong SB, Kim IY, Kwon JS, Kim SI. Fractal dimension in human cortical surface: Multiple regression analysis with cortical thickness, sulcal depth, and folding area. Hum Brain Mapp. 2006 Dec;27 (12):994–1003. doi: 10.1002/hbm.20238. [DOI] [PMC free article] [PubMed] [Google Scholar]
- J Rademacher, Galaburda AM, Kennedy DN, Filipek PA, Caviness VS., Jr Human cerebral cortex: Localization, parcellation and morphometry with magnetic resonance imaging. J Cog Neurosci. 1992;4:352–74. doi: 10.1162/jocn.1992.4.4.352. [DOI] [PubMed] [Google Scholar]
- Ju L, Hurdal MK, Stern J, Rehm K, Schaper K, Rottenberg D. Quantitative evaluation of three cortical surface flattening methods. Neuroimage. 2005 Dec;28 (4):869–880. doi: 10.1016/j.neuroimage.2005.06.055. [DOI] [PubMed] [Google Scholar]
- Kennedy D, Filipek P, Caviness V. Anatomic segmentation and volumetric calculations in nuclear magnetic resonance imaging. IEEE Trans Med Imaging. 1989;8:1–7. doi: 10.1109/42.20356. [DOI] [PubMed] [Google Scholar]
- Kennedy DN. Tech rep. Department of Nuclear Engineering, Massachusetts Institute of Technology; Cambridge, MA: 1986. A system of three-dimensional analysis of magnetic resonance images. [Google Scholar]
- Kennedy DN, Nelson AC. Three-dimensional display from cross-sectional tomographic images: an application to magnetic resonance imaging. IEEE Trans Med Imaging. 1987;6:134–140. doi: 10.1109/TMI.1987.4307813. [DOI] [PubMed] [Google Scholar]
- Kiselev VG, Hahn KR, Auer DP. Is the brain cortex a fractal? Neuroimage. 2003 Nov;20(3):1765–1774. doi: 10.1016/s1053-8119(03)00380-x. URL http://www.hubmed.org/display.cgi?uids=14642486. [DOI] [PubMed]
- Koenderink JJ, van Doorn AJ. Surface shape and curvature scales. Image and Vision Computing. 1992 October;10 (8):557–564. [Google Scholar]
- Koop M, Rilling G, Herrmann A, Kretschmann HJ. Volumetric development of the fetal telencephalon, cerebral cortex, diencephalon, and rhombencephalon including the cerebellum in man. Bibl Anat. 1986:53–78. [PubMed] [Google Scholar]
- Lyoo IK, Sung YH, Dager SR, Friedman SD, Lee JY, Kim SJ, Kim N, Dunner DL, Renshaw PF. Regional cerebral cortical thinning in bipolar disorder. Bipolar Disord. 2006 Feb;8 (1):65–74. doi: 10.1111/j.1399-5618.2006.00284.x. [DOI] [PubMed] [Google Scholar]
- Makris N, Hodge SM, Haselgrove C, Kennedy DN, Dale A, Fischl B, Rosen BR, Harris G, Caviness VSJ, Schmahmann JD. Human cerebellum: surface-assisted cortical parcellation and volumetry with magnetic resonance imaging. J Cogn Neurosci. 2003 May;15 (4):584–599. doi: 10.1162/089892903321662967. [DOI] [PubMed] [Google Scholar]
- Makris N, Kaiser J, Haselgrove C, Seidman LJ, Biederman J, Boriel D, Valera EM, Papadimitriou GM, Fischl B, Caviness VS, Kennedy DN. Human cerebral cortex: a system for the integration of volume- and surface-based representations. Neuroimage. 2006 Oct;33(1):139–153. doi: 10.1016/j.neuroimage.2006.04.220. URL http://www.hubmed.org/display.cgi?uids=16920366. [DOI] [PubMed]
- Makris N, Schlerf JE, Hodge SM, Haselgrove C, Albaugh MD, Seidman LJ, Rauch SL, Harris G, Biederman J, Caviness VSJ, Kennedy DN, Schmahmann JD. MRI-based surface-assisted parcellation of human cerebellar cortex: an anatomically specified method with estimate of reliability. Neuroimage. 2005 May;25 (4):1146–1160. doi: 10.1016/j.neuroimage.2004.12.056. [DOI] [PubMed] [Google Scholar]
- Mangin J, Riviere D, Cachia A, Duchesnay E, Cointepas Y, Papadopoulos-Orfanos D, Collins D, Evans A, Regis J. Object-based morphometry of the cerebral cortex. IEEE Trans Med Imaging. 2004a;23 (8):968–82. doi: 10.1109/TMI.2004.831204. [DOI] [PubMed] [Google Scholar]
- Mangin J, Riviere D, Cachia A, Duchesnay E, Cointepas Y, Papadopoulos-Orfanos D, Scifo P, Ochiai T, Brunelle F, Regis J. A framework to study the cortical folding patterns. Neuroimage. 2004b;23(Suppl 1):S129–38. doi: 10.1016/j.neuroimage.2004.07.019. [DOI] [PubMed] [Google Scholar]
- Mangin J, Riviere D, Cachia A, Papadopoulos-Orfanos D, Collins D, Evans A, Regis J. Object-based strategy for morphometry of the cerebral cortex. Inf Process Med Imaging. 2003;18:160–71. doi: 10.1007/978-3-540-45087-0_14. [DOI] [PubMed] [Google Scholar]
- McLennan JE, Grilles FH. The Developing Human Brain. John Wright PSG Inc; Boston, MA: 1983. pp. 43–58. Ch. A model of growth of the human fetal brain. [Google Scholar]
- Milad MR, Quinn BT, Pitman RK, Orr SP, Fischl B, Rauch SL. Thickness of ventromedial prefrontal cortex in humans is correlated with extinction memory. Proc Natl Acad Sci U S A. 2005;102 (30):10706–11. doi: 10.1073/pnas.0502441102. [DOI] [PMC free article] [PubMed] [Google Scholar]
- Nain D, Haker S, Bobick A, Tannenbaum A. Multiscale 3-d shape representation and segmentation using spherical wavelets. IEEE Trans Med Imaging. 2007 Apr;26(4):598–618. doi: 10.1109/TMI.2007.893284. URL http://www.hubmed.org/display.cgi?uids=17427745. [DOI] [PMC free article] [PubMed]
- Nishida M, Makris N, Kennedy DN, Vangel M, Fischl B, Krishnamoorthy KS, Caviness VS, Grant PE. Detailed semiautomated MRI based morphometry of the neonatal brain: preliminary results. Neuroimage. 2006 Sep;32 (3):1041–1049. doi: 10.1016/j.neuroimage.2006.05.020. [DOI] [PubMed] [Google Scholar]
- Rakic P. Specification of cerebral cortical areas. Science. 1988;241:170–176. doi: 10.1126/science.3291116. [DOI] [PubMed] [Google Scholar]
- Rakic P. A small step for the cell, a giant leap for mankind: a hypothesis of neocortical expansion during evolution. Trends Neurosci. 1995 Sep;18:383–388. doi: 10.1016/0166-2236(95)93934-p. [DOI] [PubMed] [Google Scholar]
- Regis J, Mangin J, Ochiai T, Frouin V, Riviere D, Cachia A, Tamura M, Samson Y. "Sulcal root" generic model: a hypothesis to overcome the variability of the human cortex folding patterns. Neurol Med Chir (Tokyo) 2005;45 (1):1–17. doi: 10.2176/nmc.45.1. [DOI] [PubMed] [Google Scholar]
- Rieger B, Timmermans FJ, van Vliet LJ, Verbeek PW. On curvature estimation of iso surfaces in 3d gray-value images and the computation of shape descriptors. IEEE Transactions on Pattern Analysis and Machine Intelligence. 2004;26 (8):1088–1094. doi: 10.1109/TPAMI.2004.50. [DOI] [PubMed] [Google Scholar]
- Rieger B, van Vliet LJ. Curvature of n-dimensional space curves in grey-value images. IEEE Transactions on Image Processing. 2002;11 (7):738–745. doi: 10.1109/TIP.2002.800885. [DOI] [PubMed] [Google Scholar]
- Rieger B, van Vliet LJ. A systematic approach to nd orientation representation. Image Vision Comput. 2004;22(6):453–459. [Google Scholar]
- Rodriguez-Carranza CE, Rousseau F, va BI, Glenn O, Vigneron D, Barkovich J, Studholme C. An iso-surface folding analysis method applied to premature neonatal br ain development. Vol. 6144. SPIE; 2006. p. 61441K. [Google Scholar]
- Ruoss K, Lovblad K, Schroth G, Moessinger A, Fusch C. Brain development (sulci and gyri) as assessed by early postnatal mr imaging in preterm and term newborn infants. Neuropediatrics. 2001 Apr;32 (2):69–74. doi: 10.1055/s-2001-13871. [DOI] [PubMed] [Google Scholar]
- Willmore Tom James. Riemannian Geometry. Oxford University Press; Aug, 1997. [Google Scholar]
- Tosun D, Reis AL, Bellugi U, Galaburda AM, Korenburg JR, Mills DL, Toga AW, Thompson PM. Measuring increased cortical complexity in williams syndrome using 3-d cortical morphometry 2006 Jan; [Google Scholar]
- van der Knaap M, van Wezel-Meijler G, Barth P, Barkhof F, HJ HA, Valk J. Normal gyration and sulcation in preterm and term neonates: appearance on MR images. Radiology. 1996 Aug;200 (2):389–396. doi: 10.1148/radiology.200.2.8685331. [DOI] [PubMed] [Google Scholar]
- Van Essen DC, Dierker D, Snyder AZ, Raichle ME, Reiss AL, Korenberg J. Symmetry of cortical folding abnormalities in williams syndrome revealed by surface-based analyses. J Neurosci. 2006 May;26(20):5470–5483. doi: 10.1523/JNEUROSCI.4154-05.2006. URL http://www.hubmed.org/display.cgi?uids=16707799. [DOI] [PMC free article] [PubMed]
- Van Essen DC, Drury HA. Structural and functional analyses of human cerebral cortex using a surface-based atlas. J Neurosci. 1997;17:7079–7102. doi: 10.1523/JNEUROSCI.17-18-07079.1997. [DOI] [PMC free article] [PubMed] [Google Scholar]
- Wikipedia. Curvature. 2007 http://en.wikipedia.org/wiki/Curvature.
- Wisco JJ, Kuperberg G, Manoach D, Quinn BT, Busa E, Fischl B, Heckers S, Sorensen AG. Abnormal cortical folding patterns within broca’s area in schizophrenia: Evidence from structural mri. Schizophr Res. 2007 May; doi: 10.1016/j.schres.2007.03.031. URL http://www.hubmed.org/display.cgi?uids=17490861. [DOI] [PMC free article] [PubMed]
- Yu P, Grant PE, Qi Y, Han X, Ségonne F, Pienaar R, Busa E, Pacheco J, Makris N, Buckner RL, Golland P, Fischl B. Cortical surface shape analysis based on spherical wavelets. IEEE Trans Med Imaging. 2007 Apr;26(4):582–597. doi: 10.1109/TMI.2007.892499. URL http://www.hubmed.org/display.cgi?uids=17427744. [DOI] [PMC free article] [PubMed]
- Zilles K, Armstrong E, Schleicher A, Kretschmann HJ. The human pattern of gyrification in the cerebral cortex. Anat Embryol (Berl) 1988;179 (2):173–179. doi: 10.1007/BF00304699. [DOI] [PubMed] [Google Scholar]


