Abstract
The class I ligase was among the first ribozymes to have been isolated from random sequences and represents the catalytic core of several RNA-directed RNA polymerase ribozymes. The ligase is also notable for its catalytic efficiency and structural complexity. Here, we report an improved version of this ribozyme, arising from selection that targeted the kinetics of the chemical step. Compared with the parent ribozyme, the improved ligase achieves a modest increase in rate enhancement under the selective conditions and shows a sharp reduction in [Mg2+] dependence. Analysis of the sequences and kinetics of successful clones suggests which mutations play the greatest part in these improvements. Moreover, backbone and nucleobase interference maps of the parent and improved ligase ribozymes complement the newly solved crystal structure of the improved ligase to identify the functionally significant interactions underlying the catalytic ability and structural complexity of the ligase ribozyme.
Keywords: in vitro selection, class I ligase, ribozyme, RNA structure, NAIM, interference mapping
INTRODUCTION
The first successful use of in vitro evolution to produce a ribozyme from completely random sequence yielded the class I ligase, a 119-nucleotide (nt) sequence that promotes formation of a phosphodiester bond between the 3′-hydroxyl group of an oligonucleotide substrate and its own 5′ α-phosphate (Bartel and Szostak 1993; Ekland et al. 1995). Since its isolation, the class I ligase ribozyme sequence has been the springboard for a number of other studies of non-natural ribozymes and evolution, being subjected to continuous evolution under approximately constant conditions (Wright and Joyce 1997), at changing pH (Kühne and Joyce 2003), at decreasing Mg2+ concentration (Schmitt and Lehman 1999), and in the presence of a “predator” DNA enzyme (Ordoukhanian and Joyce 1999), among other conditions. It was the class I ligase, too, that formed the basis of the in vitro compartmentalization work of Levy et al. (2005) that yielded the first ribozyme variants directly selected for multiple-turnover activity.
Another reason for continued interest in the class I ligase is its connection to the RNA world hypothesis, the simplifying idea that life in its earliest stages relied not on a DNA genome and protein enzymes, but on an RNA genome with self-replicating ribozyme activity (Joyce and Orgel 1999). An RNA replicase ribozyme is thus the sine qua non of the RNA world, but this complex activity has proved elusive. The ligase catalyzes a simpler reaction that models this activity. Relying on Watson–Crick base-pairing, as an RNA replicase would, to orient its substrate, the ligase catalyzes the attack of a ribonucleotide 3′-OH on a 5′-triphosphate, with expulsion of a pyrophosphate leaving group—precisely the chemistry an RNA replicase needs for each NTP addition. These features have made the ligase a useful scaffold on which to build template-directed RNA polymerase ribozymes that represent progress toward generating true replicase activity (Ekland and Bartel 1996; Johnston et al. 2001; McGinness et al. 2002; Lawrence and Bartel 2005; Zaher and Unrau 2007).
Replicative potential aside, the class I ligase ribozyme is studied because it is fast. At 60 mM Mg2+ and pH 8.0, the cis-acting construct b1-207 reacts with kc = 300 min−1 (Glasner et al. 2002), while the trans-acting construct b1-207t reaches kc = 375 min−1 for the multiple turnover reaction (Bergman et al. 2000). For the latter construct, kcat/KM is 7 × 10⁷ M−1 min−1, just over an order of magnitude shy of the diffusion-controlled limit. As fast as class I ligase catalysis is, however, the chemical step remains slower than the folding reaction at pH ≤7 (Glasner et al. 2002). Thus, we decided to target the chemical step for improvement by using a rapid-quench flow apparatus to isolate variants that react rapidly at moderate-to-low pH. This targeted selection yielded a family of successful clones, from which we chose one, termed the improved ligase, for further investigation.
Under optimal conditions (60 mM Mg2+ at pH 9), the improved ligase ribozyme had a kc exceeding 1300 min−1, among the fastest ribozyme rate constants yet observed. The most successful isolates also showed a shallower dependence on [Mg2+] than did the parent ligase, suggesting that the mutations acquired either improve the affinity of one or more specific Mg2+-binding sites or buttress ribozyme structure by some metal-independent means. Statistical analysis of the population of successful isolates allowed us to identify mutations that are likely to have contributed to this improved activity and reduced metal dependence. To probe the tertiary interactions that contribute to ribozyme activity across the generations, we performed nucleotide analog interference mapping (NAIM) (Conrad et al. 1995; Strobel and Shetty 1997; Ryder and Strobel 1999) and dimethyl sulfate (DMS) interference mapping (Peattie and Gilbert 1980; Peattie and Herr 1981; Moazed et al. 1986; Stern et al. 1988) on both the parent ligase and the improved ligase. Our results complement the recently solved crystal structure of the improved ligase (Shechner et al. 2009) to reveal key functional groups in the network of interactions that promote activity in the class I ligase ribozyme.
RESULTS AND DISCUSSION
Selection of improved class I ligase variants
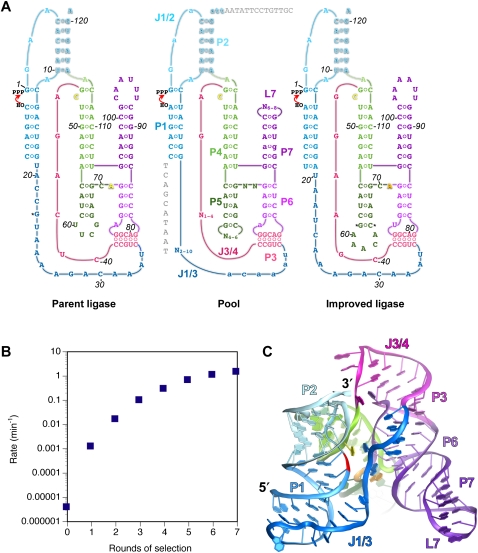
Selection experiments face a trade-off between the number of positions varied and the completeness with which sequence space can be covered at those positions. Previous selection experiments indicated that many of the unpaired residues within the ligase were important for activity, and suggested that single-stranded regions may play a role in defining the tertiary structure and active site of the ribozyme (Ekland et al. 1995). Thus, we sought to explore more fully the possible sequences and lengths of those regions, while holding the known stem regions largely constant (Fig. 1A). Where conservation in previous selections suggested that the optimal residue in a joining or loop region was already in place, we biased the pool toward that residue but mutagenized at the level of 10% (i.e., 90% of the pool had the parental base, while 3.3% had each of the nonparental bases). At the remaining positions in these regions, we randomized the pool completely in both length and sequence. Only one base pair in the seven stems was allowed to vary: both bases in the noncanonical G88:A103 pair in stem P7 were mutagenized at the 10% level. Finally, four engineered changes were made in stem regions of all pool molecules. Two of these changes sought to improve ribozyme function: first, G73:C84 was converted to an A:U pair, a change that improves class I ligase-catalyzed primer extension (EH Ekland and DP Bartel, unpubl.); second, helix P5 was extended by one base pair to improve its stability, so that L5 optimization could take place in a more constant environment. The remaining two changes facilitated the selection itself by making the substrate approximate the sequence of the T7 RNA polymerase promoter: the 3′ end of the substrate, forming the 5′ strand of P1, was changed from 5′-CCAGUC-3′ to 5′-CCAGUA-3′, and G13, in the 3′ strand of P1, was changed to U in order to maintain Watson–Crick pairing with this new substrate.
FIGURE 1.
(A) Secondary structures of the parent ligase, the pool of sequences used for selection, and the improved ligase (clone 23). Secondary structural elements (common to all three) are labeled on the pool. Joining regions (J) are named for the two paired regions (P) they connect. Residue numbering is with respect to the ligation junction, with the 5′-terminal residue of ribozyme assigned +1, and the 3′-terminal residue of the substrate assigned –1. All numbering is with reference to the improved ligase; insertions are marked with asterisks. Positions that were randomized in the pool are labeled N on the pool secondary structure; positions mutagenized at the 10% level are shown in lowercase. Sequences in gray on the pool secondary structure are, at left, the DNA portion of the substrate used for selection and, at top, the RT primer-binding site. (B) Improvement of pool activity over the course of the seven rounds of selection. Rates were measured at pH 6.0 in 10 mM Mg2+. (C) Crystal structure of the product of the improved ligase (Shechner et al. 2009). Elements of secondary structure are colored as in A.
The engineered and mutagenized pool was subjected to successive rounds of selection in a scheme that differed from previous ligase selections in two key respects (Supplemental Fig. S1). First, the substrate used resembled the T7 RNA polymerase promoter, allowing amplification to proceed from reverse transcription (RT) and selective PCR directly to forward transcription without the intervening steps previously required to append the T7 promoter (Bartel and Szostak 1993; Ekland et al. 1995). Second, we sought to select specifically for rapid catalysis, by performing the selective step of later rounds in a rapid-quench flow apparatus. This apparatus enabled us to select for ribozymes capable of performing ligation in as little as 0.2 sec.
The sequences isolated after seven rounds of selection (Fig. 1B) included 35 unique clones, which were then used as templates for transcription of ribozyme RNAs. These ribozymes remained active in the absence of the reverse-transcription primer and its binding site; indeed, removal of the binding site typically improved activity slightly (data not shown). Similarly, activity was unaffected by 5′-terminal truncation of the 16-nt RNA–DNA chimeric substrate. All further characterization of the successful clones was performed using a 7-nt RNA substrate and ribozymes trimmed at the 3′ end to remove the RT primer-binding site, matching the length of the parent ligase.
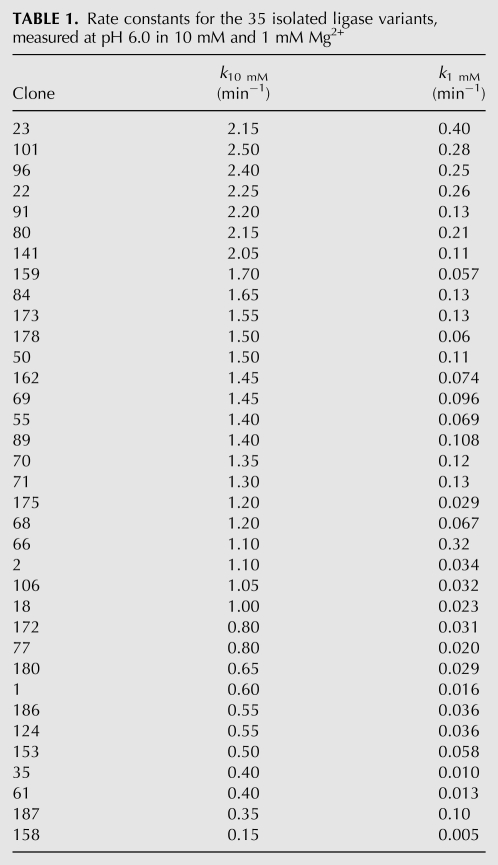
We first measured the ligation activity of the 35 isolates under the conditions of the final round of selection (pH 6.0, 10 mM Mg2+, 200 mM KCl). Ligation rate constants ranged from 0.15 min−1 to >2 min−1, with a cluster of seven isolates (Table 1, clones 22, 23, 80, 91, 96, 101, 141) ligating roughly twice as fast as the parent ligase. We next asked whether having performed the selection at Mg2+ levels known to be below saturation for the parent ligase had produced any change in Mg2+ dependence among the successful isolates. The parent ligase has a steep dependence on [Mg2+] in this range, its rate constant dropping 40-fold when the Mg2+ concentration is reduced from 10 mM to 1 mM. Among the selected clones, five showed as steep a dependence as that of the parent; the remainder showed a shallower dependence, with three clones (Table 1, clones 187, 66, 23) dropping as little as 3.5- to 5.5-fold. Of these three, clones 187 and 66 were no faster than was the parent ligase at 10 mM Mg2+, whereas clone 23 was twofold faster than the parent at 10 mM Mg2+, and 15-fold faster at 1 mM. We chose clone 23 (Fig. 1C), hereafter referred to as the improved ligase, for further biochemical and structural characterization (and number all nucleotide positions, including those of the parent, with respect to this clone).
TABLE 1.
Rate constants for the 35 isolated ligase variants, measured at pH 6.0 in 10 mM and 1 mM Mg2+
Sequence analysis of improved class I ligase variants
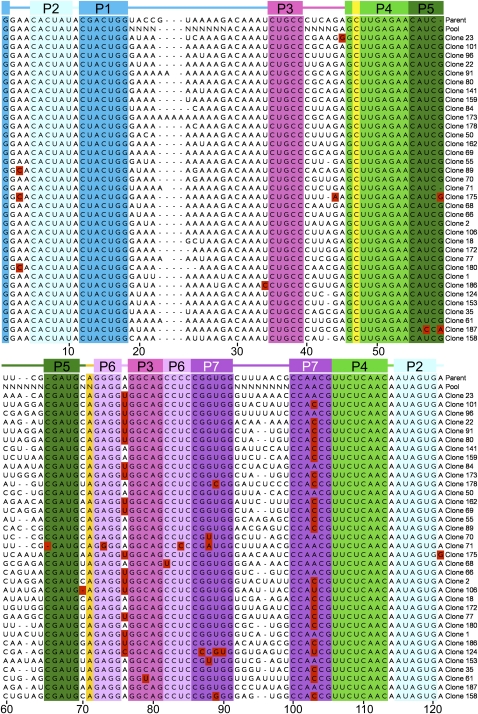
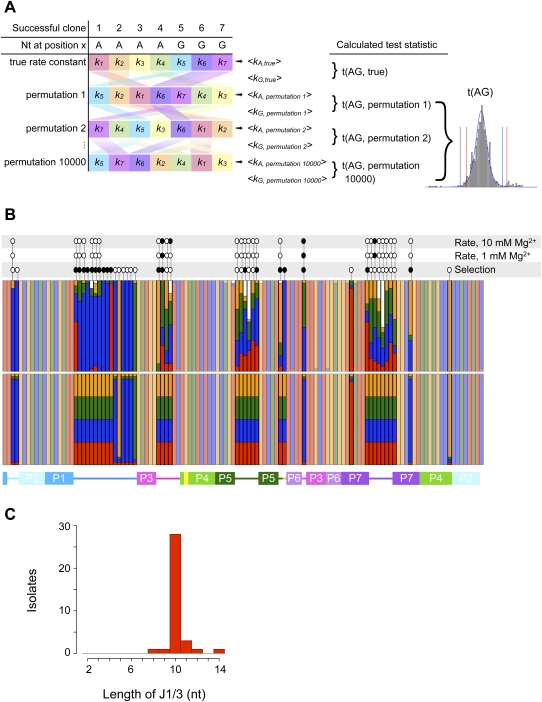
Before undertaking further biochemical experiments, we subjected the set of 35 isolates to statistical analysis to see whether we could identify candidate mutations underlying the observed improvements in catalysis. We aligned the sequences of all isolates (Fig. 2) and compared the nucleotide distribution at each mutagenized position to that of the starting pool (Fig. 3). The first fully randomized region of the ribozyme, positions 19–28, lies in a long joining region, J1/3. Although this segment was varied randomly in the pool from 2 to 10 nt in length, the successful isolates were tightly clustered at 10 nt (Fig. 3C), with five clones even acquiring additional nucleotides during the course of evolution. Notably, this is one nucleotide shorter than the parent J1/3; it is not clear whether this change is connected to the 1-nt extension of P1 made possible by the modified ligase substrate. A strong nucleotide composition bias was also evident in this region of the isolates, with adenosine constituting 74% of the nucleotides in this region, compared with 50% in this region of the parent ligase. Remarkably, the least significant nucleotide enrichment in this region was the preference for G at position 19 with P = 0.011 (Fisher's exact test); positions 20–27 were all preferentially an A with P values ranging from 4 × 10⁻⁵ to 4 × 10⁻¹², and position 28 was preferentially a G with P = 9 × 10⁻¹¹.
FIGURE 2.
Alignment of the 35 isolated variants. Helix P1 is formed when the substrate oligonucleotide hybridizes to nucleotides 13–18. Red blocks highlight nonparental nucleotides in regions that were not fully randomized in the starting pool. Colors are as in Figure 1.
FIGURE 3.
(A) Outline of Monte Carlo analysis of the kinetic effects of different nucleotides at each position in the ribozyme. At each position subjected to analysis, the pairings of nucleotide identity and rate constant were shuffled randomly 10,000 times, and the mean rate constants newly associated with each nucleotide were calculated. The t-statistic describing the difference in mean rate constants of ribozymes bearing, e.g., A and G residues was calculated for each permutation, revealing the underlying t-distribution and the critical values to which the true t-statistic was compared. Note that, whereas the canonical t-distribution (blue curve) has symmetric tails and thus symmetric critical values (blue vertical lines), the Monte Carlo simulation (gray bars) can reveal a t-distribution with markedly asymmetric tails and critical values (red lines). (B) Observed (top) and expected (bottom) nucleotide frequencies in the ligase selection. Red, G; blue, A; green, U; orange, C; white, gap. Less-saturated colors mark positions that were not deliberately varied in the pool. Above the colored bars are the results of Monte Carlo analyses of nucleotide identity effects on ribozyme kinetics at the indicated Mg2+ concentrations and of Fisher's exact test to detect significant deviation of observed from expected nucleotide frequencies. Open ovals indicate that a test was performed but revealed no significant effect; filled ovals indicate significant effects. The secondary-structure schematic below is colored as in Figure 1. (C) Histogram of the observed lengths of J1/3 sequences among successful ligase variants. J1/3 was varied from 2 to 10 nt in the starting pool; how some variants acquired longer J1/3 sequences is unknown.
The 5′ end of the joining segment J3/4 showed somewhat less sequence bias, but a clear length preference. The starting pool varied from 1 to 4 nt here, but 30 out of 35 successful clones maintained the parental length, 4 nt; and in the remaining five clones J3/4 was shortened only to 3 nt. Nucleotides 42 and 43 showed no significant trends, but nucleotide 41 was largely conserved as the parental U (P = 0.004), and the 5′ nucleotide of J3/4, position 40, was strongly conserved as the parental C (P = 3 × 10⁻⁹). Explaining this conservation, C40 pairs with G44, as shown by the crystal structure and accompanying experiments (Shechner et al. 2009). Indeed, both isolates that deviated from the parental C40 had a U at this position, which retained the potential to form either a U:G wobble or U:A base pair with nucleotide 44 (a position not intentionally mutagenized in our pool). The final joining segment to be randomized, J5/6, hewed to the parent ribozyme in both sequence and length. J5/6 is 2-nt long in the parent ligase and in 34 of 35 successful isolates, and 1 nt in the other. Even the sole shortened isolate maintains A71, which was absolutely conserved among successful isolates (P = 4 × 10⁻¹²). The 5′ position of J5/6, though not absolutely conserved, showed significant bias toward the parental C (P = 0.003).
In contrast with the joining regions, the two terminal loops, L5 and L7, showed little conservation in either size or sequence, consistent with previous observations that perturbing these loops has little impact on ligase activity (Ekland and Bartel 1995; Ordoukhanian and Joyce 1999; Schmitt and Lehman 1999). Only three positions in these two loops showed evidence of selection: nucleotides 62 and 64 in L5, and nucleotide 92 in L7. (Note that the improved ligase, clone 23, has a 5-nt L5, whereas 20 other clones have 6 nt here, with the inserted nucleotide falling between improved ligase nucleotides 62 and 63.) Adenosine was favored at both L5 sites, and guanosine at the L7 site; in none of these cases was the favored nucleotide selected to the exclusion of any other. In loops L5 and L7 alike, the first and last nucleotides of loops of the largest allowable size were often (in 12 of the 20 6-nt L5 sequences and 14 of the 18 8-nt L7 sequences) Watson–Crick or wobble complements, such that the paired stem could be extended by one base pair and the loop decreased by 2 nt.
Among the 19 positions mutagenized at the 10% level, two showed significant movement away from the parental identity. The first of these, nucleotide 76, is the sole nucleotide of J6/3; an A in the parent ligase and in 90% of the pool, it remained an A in just 17 isolates, becoming a C in one and a U in the other 17 (P = 2 × 10⁻⁶). The second such position, nucleotide 103, is part of the noncanonical G88:A103 base pair in helix P7. Remaining a G:A pair in nine isolates, mutation of nucleotide 103 gave a G:U wobble in two isolates and a canonical G:C pair in 21 (P = 1 × 10⁻⁸). One clone lost the G:A pair only to gain an A:A mismatch by mutation of G88. Although G88, like A103, was also mutagenized at the 10% level, conversion of the G88:A103 mismatch to a U:A pair was observed only twice. This asymmetry suggests that if canonical pairing at this site confers a selective advantage, the benefit may be tied to the stability of the base pair, or may be secondary to a stronger bias for a purine at position 88.
Although Fisher's exact test can readily detect bias toward nonparental nucleotides at lightly mutagenized positions, the test lacks the statistical power to detect significant conservation of the parental nucleotides at such sites; given expected frequencies of 32 parental and one each nonparental nucleotide at a given position, the probability of observing the parental nucleotide in all 35 isolates is 0.239. The two positions discussed above, nucleotides 76 and 103, account for nearly all of the substitutions and gaps observed among the 19 lightly mutagenized sites; setting these two positions aside and considering the other 17 positions in the aggregate, we observed only 10 nonparental features in all 35 isolates. We performed one million simulated selections at 19 lightly mutagenized sites, discarding from each simulation the two positions with the most nonparental features. On average, the 17 sites remaining in our simulations contained 53 ± 7 nonparental features, significantly more than the 10 observed in our in vitro isolates (P < 10−6). Thus, the parental sequence appears to have been optimal at most of these 17 positions.
Connecting kinetic measurements to sequence variation
We next examined whether any mutations were specifically associated with rapid catalysis at 1 mM or 10 mM Mg2+: at a given position, despite the changing background of variation at different positions, do ribozymes bearing an A (for example) have, on average, a higher mean rate constant than those bearing a G? Although a t-statistic could be calculated for any two such means, the group sizes and variances in our data set are frequently unequal; we could not safely assume that the underlying distribution of t-statistics would closely resemble the canonical t-distribution, and thus did not a priori know the critical values for our test statistic. We therefore took a Monte Carlo approach to determine the true distribution of t-statistics for our data (Fig. 3A; Materials and Methods). Starting with the measured rate constants and known group sizes (e.g., at position 64, 12 isolates carried a G, 12 carried an A, six carried a U, and five carried a C), we randomly reassigned rate constants to different groups. We could then calculate the mean rate constant in the “G” group and the mean in the “A” group, and from these mean values the t-statistic describing the difference between them. By repeating this process 10,000 times, we generated t-statistics with a distribution approaching that characteristic of our data. This distribution allowed us to determine the probability that the means of two random subsets of ligase rate constants would give a t-statistic as extreme as that obtained from the true groupings.
With this approach, we found several positions in the ligase at which nucleotide identity had a significant effect on rate. Two of these positions, 41 and 43, were in J3/4. Isolates bearing a G at position 41 had significantly faster rate constants at 1 mM Mg2+ than did isolates bearing an A (Bonferroni-adjusted P < 0.018), and at 10 mM Mg2+ than isolates bearing either an A or a U (Bonferroni-adjusted P < 0.0066 and 0.041, respectively). Surprisingly, although we did observe significant selection at nucleotide 41, the favored residue was U (8.75 U41 clones and 8.75 G41 clones expected; 18 U41 and 11 G41 clones observed). Because the pool was not prefolded during selection, but was for rapid kinetic assays, one possible interpretation is that G41 might promote catalysis, but U41 might promote more optimal folding. At nucleotide 43, isolates bearing an A had significantly higher rate constants at 10 mM Mg2+ than did isolates with either a C (Bonferroni-adjusted P < 0.002) or a G (Bonferroni-adjusted P < 0.05), but the effects were not significant at 1 mM Mg2+. The crystal structure reveals that P3 is capped by a base pair between positions 40 and 44, with nucleotides 41–43 adopting a GNRA tetraloop-like configuration (Shechner et al. 2009); the base-specific effects at positions 41 and 43 likely reflect the energetics of this very short loop.
At two positions, 76 and 94, the Monte Carlo analysis detected a significant effect at 10 mM Mg2+ that grew stronger at 1 mM Mg2+. At position 76, we had already seen that the parental identity was selected against strongly. Isolates bearing the parental adenosine had a mean ligation rate constant of 1.04 ± 0.55 min−1 at 10 mM Mg2+, compared with 1.54 ± 0.64 min−1 among U76 clones (P < 0.019); at 1 mM Mg2+, the relative gap widened to 0.06 ± 0.04 min−1 versus 0.14 ± 0.12 min−1, respectively (P < 0.013). A kinetic difference that widens with decreasing metal concentrations in this way could reflect either of two situations: a pre-existing, but weak, metal-binding site might have its affinity improved by the favored substitution, allowing it to remain saturated at Mg2+ concentrations that would strip the site in the parent ligase; or the favored substitution might promote a non-metal-mediated interaction that compensates at low [Mg2+] for a missing metal elsewhere in the ribozyme. Examination of the crystal structure of the improved ligase (Shechner et al. 2009) suggests that U76 may fall into the former class.
Several structural elements come together in the neighborhood of nucleotide 76. Moving up helix P6 from the 3′ end, the transition to the pseudoknot helix P3 is seamless; P3 simply continues the P7–P6 coaxial stack. But base pairing to form P3 occupies five of the six residues in what would otherwise be L6; the lone unpaired residue must negotiate the strand's return to P6 in register. That unpaired residue is nucleotide 76. In the improved ligase crystal structure, the U76 sugar and base are flipped out, allowing the base to stack favorably against G45. With the sugar flipped, the phosphate groups flanking U76 are brought closer together; the pro-Rp nonbridging phosphate oxygens at nucleotides 75 and 77 are separated by just 6.22 ± 0.19 Å (averaged across the two ribozyme chains in the crystallographic asymmetric unit), significantly smaller than the mean distance at other positions in the P3/P6 junction (9.84 ± 1.54 Å; P < 5 × 10⁻⁵, unpaired t-test assuming unequal variances). As discussed below, biochemical evidence suggests that the pro-Rp oxygens of positions 75 and 77, together with that of nucleotide 46, jointly ligand a structural Mg2+ ion. Notably, the U76/G45 stacking interaction and this proposed metal-binding site are the sole points of structural communication between the P7–P6–P3 domain of the ribozyme and the P4–P5 domain (Shechner et al. 2009). The flipped-out U76 base nearly fills the small cavity created by nucleotides 45–46; a larger sidechain at nucleotide 76 would likely force small realignments of the backbone, movement on a scale that could affect the affinity of the metal-binding site formed by nucleotides 75, 77, and 46. Thus, the parental adenosine could constrain the backbone at positions 75 and 77 to a conformation that more easily loses a bound Mg2+ ion, while mutation to U76 could improve the affinity of the backbone metal-binding site, such that low metal concentrations magnify the kinetic benefit of this mutation. Additional insights from our comparative sequence analysis are discussed in the supplemental materials.
Interference mapping
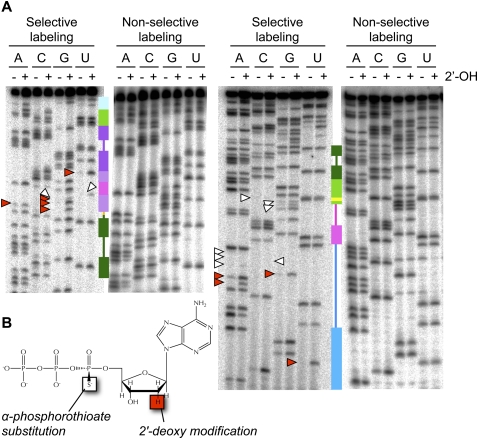
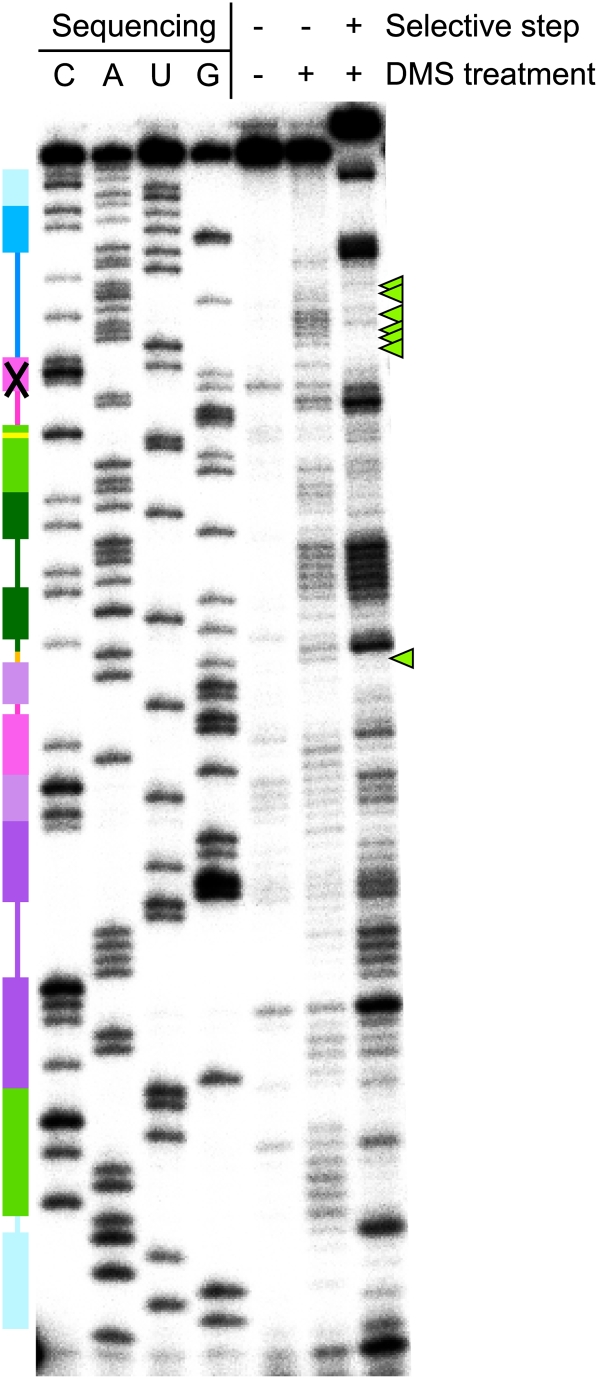
Functional contacts in the class I ligase might have changed in either of two ways over the course of selection of the improved ligase. The change of a base might directly alter key contacts between that base and other base or backbone atoms; it might also have indirect effects if the altered base causes a shift in the positions of its backbone atoms and thus in their hydrogen-bonding or metal-binding potential. Two mapping techniques gave us access to the large majority of positions at which changes of either type might have occurred. First, nucleotide analog interference mapping (NAIM) (Conrad et al. 1995; Strobel and Shetty 1997; Ryder and Strobel 1999) of the parent and improved ligases allowed us to identify functionally significant nonbridging pro-Rp oxygens and 2′-hydroxyl groups (Fig. 4). Following this analysis of backbone contacts, interactions made by the bases themselves were investigated by interference mapping with dimethyl sulfate (DMS) (Fig. 5; Peattie and Gilbert 1980; Peattie and Herr 1981; Moazed et al. 1986; Stern et al. 1988). DMS methylates the Watson–Crick face of adenosine residues (at N1) and cytosine residues (at N3), the favored nucleotides at 15 of the 18 sites that showed significant bias in the ligase selection (Fig. 3), allowing us to investigate regions of the ribozyme where selective pressure for a given nucleotide may signal a tertiary interaction of note.
FIGURE 4.
(A) Representative NAIM gels for quantification of phosphorothioate and 2′-deoxy effects in the improved ligase. Secondary-structure cartoons, colored as in Figure 1, provide landmarks. 6% gels were used to resolve the 3′ half of the ligase (left), and 15% gels were used to resolve the 5′ half of the ligase (right). White arrowheads mark positions of particularly strong phosphorothioate interference; red arrowheads mark positions of particularly strong 2′-deoxy interference. (B) [α-Phosphorothioate]-2′-deoxyadenosine triphosphate (dATPαS), one of the eight nucleotide analogs used for NAIM. Use of the α-phosphorothioate-bearing ribonucleotides ATPαS, CTPαS, GTPαS, and UTPαS permits quantification of phosphorothioate interference effects and establishes a baseline for comparison with the α-phosphorothioate-bearing deoxyribonucleotides dATPαS, dCTPαS, dGTPαS, and dUTPαS to determine 2′-deoxy interference effects (Conrad et al. 1995; Strobel and Shetty 1997; Ryder and Strobel 1999). The stereoisomer shown bears a pro-Sp sulfur substitution; this isomer is the only isomer recognized by T7 RNA polymerase, but because polymerization proceeds with inversion of stereochemistry, all sulfur substitutions in the resulting RNA are in the pro-Rp position (Verma and Eckstein 1998).
FIGURE 5.
A representative primer-extension gel for quantification of DMS interference in the improved ligase, with sites of strong interference in single-stranded regions marked by green arrowheads. The secondary structure cartoon is colored as in Figure 1. Band identities were assigned using dideoxy sequencing ladders; due to extension pausing before modified nucleotides in experimental lanes, there is a one-base offset between experimental lanes and sequencing ladders. The gel compression that prevented analysis of nucleotides 34–41 is indicated by an X on the secondary-structure cartoon.
Independent interpretation of these results and of the crystal structure of the improved ligase reaction product (Shechner et al. 2009) led to a number of concordant conclusions; in other cases, patterns hidden in the interference data and the crystal structure considered separately came into focus when the observations were combined. (In some of these latter cases, the maps and the structure together predict interactions that will require additional mapping to confirm; these positions are discussed in the supplemental material.) Finally, at some positions the interference maps cannot be explained by the crystal structure, perhaps indicating contacts involved in ribozyme folding. We discuss the interference maps and their relation to the crystal structure below, as well as several telltale signs that some contacts particularly important to the polymerase are also central to ligase activity, supporting the notion that the ligase remains a good model for the polymerase core.
Pro-Rp phosphorothioate interference
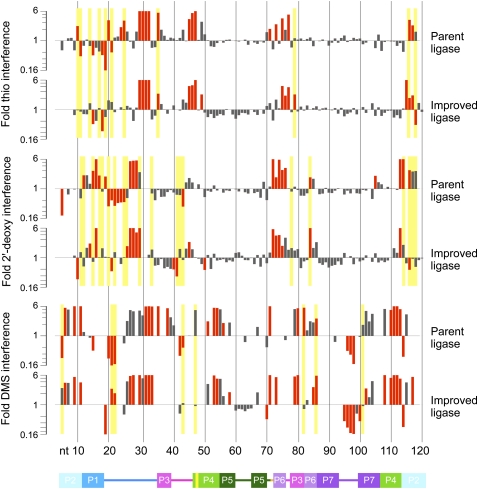
On the whole, the phosphorothioate profiles of the parent and improved ligases were similar, although the magnitude of interference effects was typically greater in the parent ligase than in the improved ligase (Figs. 4, 6, 7). Each of the 20 sites of significant interference we detected has the potential to be an inner-sphere ligand of a functionally important Mg2+ ion. In principle, a metal rescue experiment could lend support to the role of some of these oxygens as inner-sphere ligands (Piccirilli et al. 1993). However, the ligase is strongly inhibited by the transition metals that are the best candidates for metal rescue (Glasner et al. 2002); pilot experiments confirmed that this line of inquiry was unlikely to be productive (data not shown). Instead, the improved ligase crystal structure (Shechner et al. 2009) provided a framework for interpreting the interference maps. Although some phosphorothioate interference effects (and most enhancement effects) remain unexplained, the crystal structure clearly suggests that nearly half of the phosphorothioate-interference effects we observed were related to metal-binding activity.
FIGURE 6.
Log-scale maps of mean phosphorothioate (thio), 2′-deoxy, and DMS interference and enhancement effects in the parent and improved ligases. Positions of significant (95% confidence interval excludes 1.0) and strong (mean greater than or equal to twofold) effects are shown in red. Yellow bars highlight positions at which the mean fold effect differs both significantly (P < 0.05, t-test) and substantially (by a factor of ≥2) between the two ribozymes. Phosphorothioate interferences obscure possible 2′-deoxy effects at several positions in both ligases. DMS mapping by primer extension yields data only for A and C residues. Ribozyme positions are numbered below, with the secondary structure cartoon colored as in Figure 1.
FIGURE 7.
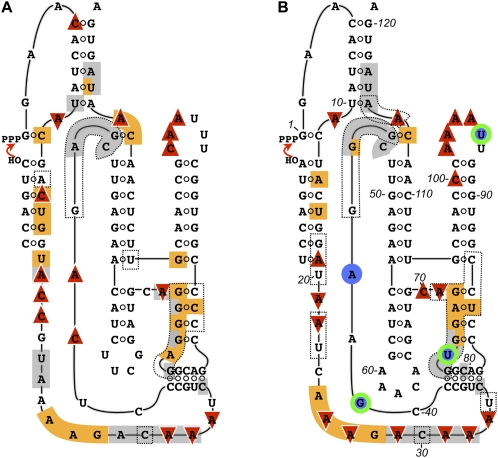
Secondary-structure projections of the (A) parent and (B) improved class I ligase ribozymes, superimposed with the results of structural and sequence mapping. Dotted lines in A indicate the parent residues at which the C4′ atom was protected from Fe-EDTA-generated hydroxyl radicals (Bergman et al. 2004). Dotted lines in B indicate sites at which the C4′ atom was calculated to be solvent inaccessible in the crystal structure (Shechner et al. 2009). Phosphorothioate interference is shown in gray; 2′-deoxy interference is shown in orange; DMS interference is shown by downward-pointing red triangles, and DMS enhancement by upward triangles. In B, positions at which the Monte Carlo analysis revealed a significant association between nucleotide identity and activity are highlighted by blue circles if the effect appeared at 10 mM Mg2+ and by green and blue rings if the effect appeared at both 10 mM and 1 mM Mg2+.
Candidate metal-binding site in the ribozyme core
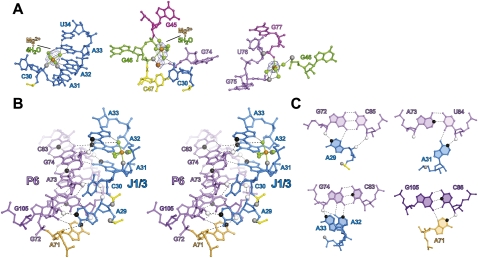
The phosphorothioate interference effects for which the crystal structure offers a clear interpretation largely cluster in and around the ligase active site, proposed by Shechner et al. (2009) to center on phosphates from nucleotides 29 to 30 and the C47 nucleobase (Fig. 8A). As reported in that work, the strongest set of phosphorothioate interference effects lie at the 3′ end of J1/3, at positions 29–32. At each of these positions, the phosphorothioate substitution reduced ligase activity by a factor of ≥6, the limit of the assay's reliable range. Independent of the crystal structure, we hypothesized that this series of contiguous interference sites might indicate a bend in the backbone sharp enough that pro-Rp oxygens at adjacent residues would be positioned to ligate the same metal ion. This prediction was borne out by the backbone geometry at positions 30–32, where J1/3 abruptly makes a right-angled turn, positioning the pro-Rp oxygens of positions 31–32 to coordinate a magnesium ion (Shechner et al. 2009). That the refined |Fobs|-|Fcalc| difference map of the ligated product does not give evidence of a second metal bound at positions 29–30, despite the extremely strong interference effects observed, is consistent with a metal ion bound by these two phosphates that is important early in catalysis, but released later in the reaction trajectory (Shechner et al. 2009).
FIGURE 8.
Structural interactions suggested by the crystal structure (Shechner et al. 2009) and confirmed as functionally significant by NAIM and DMS interference experiments. (A) Contacts with structural metals near (left) A31–A32, (middle) G45–C47, and (right) G75–G77. Pro-Rp phosphate oxygens for which phosphorothioate NAIM interference was significant are shown as larger gray spheres; pro-Sp oxygens are not accessible to NAIM (Verma and Eckstein 1998). Meshes represent simulated-annealing |Fobs|-|Fcalc| OMIT maps in which the hydrated metal clusters were excluded from map calculations, contoured at (left) 4σ, and (middle, right) 2.5σ. Black dashed lines indicate hydrogen bonds. Solid lines bound to Mg2+ ions indicate proposed inner-sphere contacts. (B) Wall-eyed stereograph highlighting interactions between J1/3 and the P3–P6–P7 domain. Functional groups showing significant interference in biochemical experiments are shown as larger spheres, colored white for 2′-deoxy interference, gray for phosphorothioate interference, and black for DMS interference. (C) Individual base triples or quadruples involved in this interaction, rendered as in B.
On the other side of the proposed active site, the J3/4 backbone closely abuts the backbone of the 5′ strand of helix P6, with phosphate–phosphate distances between adjacent strands of just ∼7 Å. A chain of well-ordered metal ions is strung between the J3/4 and P6 backbones, providing the electrostatic screening necessary to permit such close strand–strand packing (Fig. 8A; Shechner et al. 2009). Loss of any of these metal-binding sites by phosphorothioate substitution should lead to repulsion between J3/4 and P6, presumably disrupting the positioning of the proposed catalytic nucleobase C47 in the active site. Indeed, as at nucleotides 29–32, we observed a ≥6-fold phosphorothioate interference effect at nucleotide 47; in the crystal structure, the pro-Rp oxygen of nucleotide 47 is well-positioned to be an inner-sphere ligand of one Mg2+ in the backbone-screening chain of ions. One position upstream, nucleotide 46 directs its pro-Rp oxygen toward the pro-Rp oxygens of P6 residues G75 and G77 (Fig. 8A); as discussed above, the extrusion of U76 and the close approach of J3/4 to P6 produce a spacing of ∼6 Å between each pair of oxygens. This favorable geometry, observed in an early model of the crystal structure, was the first indication of a connection between the strong and, strikingly, nearly equal phosphorothioate interference effects at positions 46, 75, and 77. Subsequent refinement of the crystal structure confirmed the presence of a strong (4–5σ) peak in the |Fobs| – |Fcalc| difference map in between the pro-Rp oxygens of positions 46, 75, and 77, the third apparent metal ion in the chain that links J3/4 with P6.
Hints of evolving interactions in J1/3
As discussed below, several lines of evidence indicate that some key structural difference in the 5′ end of J1/3 separates the improved ligase from the parent. A clear instance of evolving interference effects arose at position 20. Here, the parent ligase showed 3.5-fold phosphorothioate interference, twice as strong as the significant but mild 1.8-fold effect in the improved ligase. But the crystal structure gives no indication of a metal ion; instead, the pro-Rp oxygen is positioned well to serve as a hydrogen-bond acceptor for the 2′-hydroxyl group of position 19. Such an interaction could be disrupted by the electrostatic perturbation of phosphorothioate substitution. Looking to the 2′-deoxy interference map, we find that removing the 2′-hydroxyl group of position 19 produced twice as strong an interference in the parent (2.1-fold) as in the improved ligase (1.1-fold, not significant). The concordant relative impacts of the phosphorothioate effect at position 20 and the 2′-deoxy substitution at position 19 in the two ligases strongly suggest that both effects arose from disrupting the hydrogen bond observed in the crystal structure, and further, that the improved ligase tolerates the loss of this bond more readily than does the parent. The observation in both ribozymes that disrupting the pro-Rp oxygen partner of this hydrogen bond appears to come at a greater cost than disrupting the 2′-hydroxyl partner might be due to additional steric penalties incurred by the phosphorothioate substitution.
Lingering questions in the phosophorothioate map
At most of the remaining sites of significant phosphorothioate effects, the crystal structure offers no suggestion of the source of the effect. At two positions, moreover, the structure suggests an interpretation that is belied by other aspects of the interference maps. First, one might connect the parental phosphorothioate interference at position 71 to an interaction with the 2′-hydroxyl at position 70, but the geometry is suboptimal, and a 2′-deoxy substitution at the latter gives significant enhancement of ligase activity. Second, the structure suggests that the approximate twofold phosphorothioate interference at position 73 could reflect an interaction with the pro-Rp oxygen of nucleotide 107, when, in fact, the latter shows mild but significant phosphorothioate enhancement in both ligases. Such instances of seeming contradiction between crystallographic and biochemical data might mark steric or electrostatic side effects of the phosphorothioate substitution. Alternatively, they could indicate changes that take place along the reaction coordinate, with the interference maps reflecting the early part of the reaction, from folding through the transition state, and the crystal structure reflecting the product.
A mixture of mutability and evolutionary stability in the 2′-deoxy interference map
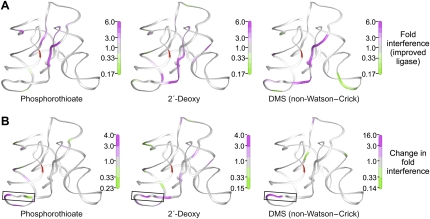
Although the 2′-deoxy interference maps of the parent and improved ligases generally resembled each other, at a few positions the mean interference effects in the parent and improved ligases were not only significantly different according to a t-test, but also differed by at least a factor of two (Figs. 6, 9), sometimes with stronger interference in the parent (e.g., positions 12, 15, and 17) and other times in the improved ligase (e.g., positions 29 and 84). Such changes are not surprising at positions with weak or moderate interference effects; if a mildly favorable 2′-OH interaction is disrupted during selection, a return to the energetic starting point could be as easy as acquisition of a single hydrogen bond elsewhere in the ribozyme. However, the pattern at positions 29 and 114 reveals that even some of the backbone interactions on which ligase activity relies most heavily were in flux during selection. Even more strikingly, the 2′-deoxy interference maps at position 116 showed a more than sixfold change, from more than threefold interference in the parent to more than twofold enhancement in the improved ligase; it is as though in our seven rounds of selection we had taken the ligase apart, put it back together, and then discovered that, for once, leaving out the proverbial spare parts made the system run more smoothly.
FIGURE 9.
Results of interference mapping projected onto the improved class I ligase crystal structure (Shechner et al. 2009). (A) Projections of (left) phosphorothioate, (middle) 2′-deoxyribonucleotide, and (right) dimethyl sulfate interference mapping results in the improved ligase onto the view of the ligase shown in Figure 1A. The ligation junction is highlighted in red. Residue colors are scaled from green (strong enhancement) to magenta (strong interference). Positions at which interference could not be quantified are colored white. For clarity, positions at which DMS interference arises from Watson–Crick pairing in known helices are not colored. (B) Projections of the extent of evolutionary change seen in the (left) phosphorothioate, (middle) 2′-deoxyribonucleotide, and (right) dimethyl sulfate interference maps of the parent and improved ligase ribozymes. The mean effect in the improved ligase was divided by the mean effect in the parent ribozyme and the results scaled from green (stronger enhancement or weaker interference—i.e., less reliance on the unperturbed residue—in the improved ligase) to magenta (weaker enhancement or stronger interference in the improved ligase). The cluster of changes in the boxed region at the 5′ end of J1/3 is discussed in the text.
Among the 2′-hydroxyl-interference effects consistent across the parent ligase and improved ligase, the strongest effect was at position 16 (Figs. 4, 6), in the 5′ strand of helix P1. This strand is the counterpart to the template oligonucleotide added in trans to the polymerase reaction; in both the ligase and the polymerase, this strand pairs both with the oligonucleotide bearing the nucleophilic 3′-OH and with the 5′-triphosphorylated nucleotide or residue, thereby aligning the reactive groups. In the polymerase ribozyme, a 2′-deoxynucleotide at template position –3, the polymerase analog of ligase position 16, is more detrimental than is 2′-deoxy substitution at any other template nucleotide (Müller and Bartel 2003). The robustness of this effect across the ligase family of ribozymes strongly suggests that the phosphoryl transfer reactions performed by all of these ribozymes require this hydroxyl group to form a specific contact with the ribozyme core, a contact likely to contribute substantially to proper alignment of the substrate helix in the active site. The crystal structure suggests that the nucleotide 16 2′-hydroxyl group may be involved in two hydrogen bonds, one to the 4′-oxygen of position 17 and one to the imine nitrogen (N1) of A25. The strong selection for an adenosine at position 25 suggested that the latter base-specific contact could make an important contact, but the DMS interference map does not strongly support this proposition, showing moderate and nonsignificant interference effects at A25 in both the parent and the improved ligase. This potential disparity between the interference maps is unusual; when considered side by side with the crystal structure and the DMS interference map, the 2′-deoxy interference map fully supported the identification and functional significance of a suite of other tertiary interactions that join and brace key elements of secondary structure and explain the longstanding observation of a strong preference for adenosine residues in the 3′ region of J1/3. We discuss these interactions in the context of the DMS map in the sections that follow.
Base-pairing interactions in the dimethyl sulfate interference map
The primer extension assay (Fig. 5) gave rise to a somewhat noisier map than did the NAIM assay, including a number of positions, noted with an asterisk (*) below, at which the two ribozymes had comparably high mean interference factors, but only one achieved significance (Fig. 6). Sequence differences and gel artifacts also precluded comparison between the ribozymes at several positions (see Materials and Methods).
A number of strong interference effects in the DMS map are readily explained as the result of disrupting Watson–Crick base pairing within helices; similarly, DMS interference at C113 supports the predicted participation of this nucleotide in a base pair flanking the catalytic nucleotide C47 (Bergman et al. 2004). However, not all helical regions are equally important for ligase activity; it is known, for instance, that L5 and parts of P5 can be manipulated with little effect on activity, so it is reasonable that the DMS interference effect at A56 in this stem should be relatively weak (just 2.2-fold interference in the parent ligase, and no significant effect in the improved ligase). At the other end of the spectrum, the DMS interference map independently predicted that the crystal structure would reveal an error in our previous secondary-structure model of the ligase. That model (Ekland and Bartel 1995) predicted a noncanonical base pair between A11 and A114. A trans Watson–Crick/Watson–Crick base pair (Leontis and Westhof 2001) would almost certainly give rise to strong DMS interference at both positions, and a trans Hoogsteen/Hoogsteen or trans Watson–Crick/Hoogsteen base pair might do so as well, depending on the modulation of N6 hydrogen bonding by the N1 modification. We observe very strong interference at A11 in both ribozymes, and equally strong enhancement at A114, inconsistent with the formation of this base pair. The crystal structure bears this argument out: A11 forms a cis Hoogsteen/Sugar Edge pair with G2, while A114 is splayed out to stack between A4 and G46. Methylation of A11 N1 would certainly interfere with the A11:G2 pair, and the A114 enhancement effect may indicate that, in the context of the A114 stacking interaction, the additional surface area for van der Waals interactions that is introduced by N1 methylation is beneficial.
Extensive concordance between dimethyl sulfate and 2′-deoxy interference mapping
The DMS interference effects that arose in single-stranded regions were of particular interest, especially those in J1/3, where the DMS interference pattern echoed both the strong 2′-deoxy interference effects at positions 26–29 and the strong phosphorothioate interference effects at positions 29–32 (Figs. 6, 7, 9). The crystal structure suggests that the DMS interference effects at positions *26–*27 arose from interactions with the substrate oligo in helix P1. The N1 groups of these two nucleotides converge on substrate residue –3, with hydrogen bonds between A26 N1 and G–3 N2 and between A27 N1 and G–3 2′-OH. Although our 2′-deoxy interference maps do not encompass the ligase substrate, the proposal that a 2′-OH in this position contributes to ribozyme function draws support from the strong 2′-deoxy interference at the analogous position of the polymerase ribozyme primer strand (Müller and Bartel 2003).
Very strong interference was also observed at nucleotides *29 and 31–33 (Figs. 6, 8B,C). The crystal structure suggests a stack of A-minor interactions (Nissen et al. 2001), with each of these J1/3 adenosine residues packing into the minor groove of P6 in a slightly different geometry (Shechner et al. 2009). A29 docks into the G72:C85 pair at the base of P6, with a hydrogen bond forming between the A29 N1 and the G72 2′-OH, on the 5′ strand of P6; as expected, we see very strong DMS interference at A29 and equally strong 2′-deoxy interference at G72. C30 is flipped out of the stack of J1/3–P6 interactions to form its own stacking interaction with the proposed catalytic nucleobase C47, and J1/3-P6 docking resumes with A31, the first position of the 3′ “A-minor triad” motif (Shechner et al. 2009). This residue docks into the A73:U84 pair, this time with a hydrogen bond forming between the A31 N1 and the position 84 2′-OH, on the 3′ strand of P6; again we observe very strong DMS interference and, in the improved ligase, equally strong 2′-deoxy interference. A32 forms an N3-amino, amino-N1 A:G pair with G74 (which also forms a Watson–Crick pair in P6 with C83), forming hydrogen bonds between A32 N1 and G74 N2 and between A32 N6 and G74 N2, N3, and possibly 2′-OH. And A33 caps this stack of J1/3–P6 interactions with a hydrogen bond from its N1 to the 2′-OH of G74; disrupting either end of this bond produces very strong interference in both ribozymes. A33 may further contribute to ligase activity by forming hydrogen bonds between its N6 and as many as three of the ordered water molecules that coordinate the metal ion bound by the pro-Rp oxygens of nucleotides 31–32. The near-perfect agreement of the interference maps with each other and the crystal structure in this crucial region of the ligase serves to confirm that, whatever structural changes the ligase may undergo in the wake of reaction, the state of P6 and J1/3 captured by the crystal still bears a strong resemblance to the active conformation.
These J1/3 and P6 results also agreed well with the hydroxyl radical footprinting data previously reported for the parent ligase (Bergman et al. 2004). Those experiments revealed robust solvent protection of the ligase backbone on both strands of P6, as expected if the 5′ strand is buried against other helices in the catalytic core and the 3′ strand is protected by J1/3. Notably, the solvent protection calculated from the improved ligase crystal structure corresponds with that measured in the parent ligase at nearly all positions (Shechner et al. 2009), with a handful of intriguing differences (Fig. 7). One of these exceptions is nucleotide 84. In the parent, measured C4′ solvent accessibility at this position was well below average (Bergman et al. 2004); in the improved ligase, calculated C4′ solvent accessibility is above average (Shechner et al. 2009). In the parent, 2′-deoxy interference here was a meager twofold effect; in the improved ligase, it was greater than or equal to sixfold (Fig. 6). As noted above, this base pair was changed from the parental G:C to an A:U during pool construction because an A:U pair slightly improved function (EH Ekland and DP Bartel, unpubl.); perhaps that improvement is tied to a slight realignment of the helix backbone, permitting the improved ligase to further stabilize contact(s) that already play a significant role in the parent.
The idea that a slight but important realignment has taken place here was echoed in the differences in the relative importance of the other 2′-OH groups in the P6 helices of the two ribozymes. For instance, the improved ligase showed nearly twofold higher 2′-deoxy interference than did the parent ligase at A73, the complement to U84, whereas contacts made by the 2′-hydroxyl groups of G74 and G75 appeared less important in the improved ligase than in the parent. Continuing this trend, DMS-based disruptions of helix P6 and the proximal base pair of P7 did not affect the two ribozymes in quite the same way. At *C85, DMS modification gave only a threefold interference effect in the improved ligase, despite presumably disrupting the Watson–Crick base pair that caps P6. At C82, DMS modification had the expected very strong (5.5-fold) effect in the parent ligase, while tending, if anything, toward enhancement in the improved ligase. The tables were turned at C86, the proximal base pair of P7, where the 5.8-fold effect in the improved ligase was just over twice the interference seen in the parent. If indeed both ribozymes do make dense but distinct networks of tertiary contacts in this region of the ribozyme, it is possible that these networks provide an energetic buffer against disruption of the helices, but that the different networks can best accommodate disruption at different positions.
A hotspot of ribozyme evolution?
Selection favored nonparental residues at positions 19 and 21–23, and that change in sequence entailed a change in backbone conformation: C4′ atoms at positions 19–20 and 22–23 are slightly more exposed than average in the parent and far more protected than average in the improved ligase (Shechner et al. 2009). Moreover, the differences between the NAIM and DMS maps of the two constructs cluster in this region (Figs. 6, 7, 9). In particular, positions 21–22, at which our selection favored substitution of adenosines for the parental cytosines, show DMS enhancement in the parent, but interference in the improved ligase (Figs. 6, 7, 9). Whatever the contacts made possible by acquisition of adenosines in this region, the benefits are not confined to the ligase ribozyme. A recent continuation of polymerase ribozyme evolution produced a variant with improved primer extension, as well as improved fidelity (Zaher and Unrau 2007). The key difference—indeed, almost the only difference—between this variant and the original polymerase (Johnston et al. 2001) is the acquisition of three additional adenosine residues at positions analogous to ligase nucleotides 20, 21, and 23. Thus, multiple lines of evidence indicate that the contacts made by these few residues, continuing to improve through evolution, have a substantial impact on ribozyme function despite their distance from the active site.
Conclusions
Continued selection on the class I ligase ribozyme demonstrated that even this efficient catalytic machine had room for optimization, particularly with regard to metal dependence. Statistical analysis of the population of ribozymes that survived selection allowed us to identify residues under selection and candidate residues at which nucleotide identity may buffer the ribozyme against changing Mg2+ concentrations. Targeted structural probing allowed us to interrogate defined subsets of these possible interactions, often revealing congruent results when we separately modified each partner of a proposed interaction. In general, the probe results we report here are in good agreement not only with each other but also with the recently solved crystal structure of the improved class I ligase ribozyme. Together, these methods offered evidence for catalytic metals bound at the ligase active site (Shechner et al. 2009) and revealed a diversity of adenosine-mediated interactions that belies the sequence-level homogeneity of the long single-stranded region J1/3. Our improved understanding of ligase structure and function, and our insights into the regions of the ligase ribozyme that have responded to selective pressure, will inform future efforts to convert the RNA polymerase ribozyme into a general RNA replicase, the proof of principle the RNA world hypothesis requires.
MATERIALS AND METHODS
Pool construction and selection
The DNA encoding a partially randomized Class I ligase pool was synthesized as a single, variable length oligonucleotide [5′-acgactcactataggAAcactatactactgg(N2–10)-ACAAATctgcc(N1–4)gagcttgagaacatcg(N4–6)cgatg(N1–2)gaggAggcagcctccgGtgg(N6–8)-ccaAcgttctcaaCaatagtgATTaatattcctgttgc-3′]. Positions in lowercase were constant, and positions in uppercase were mutagenized at 10% (Fig. 1). Thus, at these positions 90% of the molecules had the parental sequence, and the remaining 10% had one of the other three nucleotides. Positions noted as (Nx–y) were completely randomized, and varied in length within the range noted. Randomized residues were synthesized using phosphoramidite mixtures that compensated for the different efficiencies with which each monomer adds to a growing DNA chain (relative efficiency 0.70:0.73:0.85:1.0, dA:dC:dG:dT). Length variation was introduced at the points indicated using a split-and-pool protocol (Giver et al. 1993). This procedure resulted in a template pool, varying from 134 to 150 nt, made up of a randomized ligase domain ranging from 107 to 123 nt that was flanked by constant primer-binding sites on the 5′- and 3′-ends. The synthetic DNA was purified by denaturing gel electrophoresis and used as a template in a large-scale PCR reaction (150 mL). Six cycles of PCR were done, wherein each cycle was 4 min at 96°C, 5 min at 42°C, and 7 min at 72°C. Primers for PCR were 5′-AAAGCAACAGGAATATT-3′ and 5′-TTCTAATACGACTCACTATAGG-3′. Sequencing of clones from this PCR confirmed that randomization and length variation in the pool were as designed. Amplified DNA was phenol extracted, precipitated, and used as a template for an in vitro transcription reaction that generated pool RNAs.
The first round of selection was performed as diagrammed in Supplemental Figure S1. Pool RNA (580 μg, 1 μM final concentration) was heated in H2O (80°C, 10 min) with an RT primer (5′-AAAGCAACAGGAATATT-3′) that hybridized to the 3′ terminus of the pool. After the RNA was cooled slowly to room temperature, biotinylated substrate (Dharmacon Research, 5′-biotin-taatacgactCCAGUA-3′, DNA bases lowercase) was added to a final concentration of 1.2 μM along with buffer and salts (final concentrations, 10 mM MgCl2, 200 mM KCl, 50 mM EPPS at pH 8.0). The pool and substrate were incubated at 22°C for 5 min, and the reaction was stopped by addition of EDTA to 15 mM. The RNA was then precipitated and purified in a 10% polyacrylamide gel using radiolabeled RNA markers that were 138- and 160-nt long (ligated pool ranged from 141 to 157 nt). After elution and precipitation, ligated product was heated (65°C, 10 min) and cooled (22°C, 10 min), then incubated with streptavidin paramagnetic beads (Promega) for 10 min according to the manufacturer's recommendations. After washes with 0.1X SSC (three times), water (once), and RT buffer (once), additional RT primer was added, and the remaining RNA was reverse transcribed using an RNase H-deficient reverse transcriptase (Superscript II, Gibco-BRL) while rotating in an incubator kept at 48°C. A control reaction was run in parallel without reverse transcriptase to detect any contaminating DNA in subsequent PCR steps. After 1 h, EDTA was added to the RT mixture (final concentration, 3 mM), and the beads were washed three times with 0.1X SSC. Following the final wash, both the RT primer and a 5′-PCR primer (5′-TTCTAATACGACTCCAGTAGG-3′) were added to 10 μM final concentration, and cDNA was removed from beads by alkaline denaturation (100 mM KOH, 20 mM Tris-Base). After removal from the beads, the cDNA solution was heated at 90°C for 10 min to hydrolyze any remaining RNA. It was then adjusted to pH 8.5 with HCl and used as a template for PCR.
Amplification of cDNA was performed using the RT primer and 5′-PCR primer described above, using a standard hot start protocol. After amplification, pool DNA was purified by Qiaquick column (Qiagen) and used as a template in a second PCR in which the 5′ primer was changed to 5′-TTCTAATACGACTCACTGTAGG-3′. The resulting DNA was again purified by Qiaquick column and used as a template in a final PCR reaction using a 5′ primer containing the T7 RNA polymerase promoter sequence (5′-TTCTAATACGACTCACTATAGG-3′). Amplified DNA was extracted with phenol and chloroform, then precipitated and used as template for an in vitro transcription, thereby generating the pool RNA for the next round.
Further rounds of selection were performed as in round 1, with the following changes: Beginning in round 2, RNA was treated with DNase (DNase RQ1, Promega) to eliminate template DNA prior to the selective ligation step. Also, in rounds 2–4 the gel purification following the ligation step was omitted in favor of a simple precipitation. In rounds 5–7, gel purification was again used to eliminate molecules that might have remained on the streptavidin beads because they were able to bind tightly to substrate. Furthermore, in rounds 5–7 RT preceded streptavidin-biotin affinity purification so that the RNAs were hybridized with their cDNAs and thus unable to form structures that might have high affinity for the beads. The stringency of the ligation step was increased in each successive round by decreasing pH or reaction time (round 1, 5 min at pH 8.0; round 2, 20 sec at pH 7.0; round 3, 1 sec at pH 7.0; round 4, 2 sec at pH 6.0; rounds 5–7, 0.2 sec at pH 6.0). Buffers were at a final concentration of 50 mM, and were EPPS (pH 8.0), BES (pH 7.0), or MES (pH 6.0). For ligation steps requiring incubations of ≤2 sec, a KinTek RQF-3 rapid-quench flow apparatus (KinTek Corp.) was used. Finally, we observed that after round 6 the pool activity was identical with and without added RT primer, and thereafter it was omitted from the ligation step. After seven rounds the pool cDNA was cloned (TOPO-XL kit, Novagen), and individual isolates were sequenced.
Ribozyme and substrate RNAs
The parent Class I ligase ribozyme (GenBank no. U26413) was transcribed in vitro from a plasmid template linearized with EarI (Bergman et al. 2000). Transcripts were purified on 6% polyacrylamide/8 M urea gels and stored in water at –20°C. Individual clone RNAs were transcribed from PCR templates and purified in the same way. PCR templates were generated by amplifying specific clone cDNAs using a 5′-primer containing a T7 RNA polymerase promoter and either the RT primer used throughout selection or a primer (5′-AAAGCAACAGGAAATATT-3′) that truncated ribozymes to the same length as that of the parent ligase. Ribozyme constructs in which individual changes were made to a specific clone were prepared in the same way using PCR primers to generate transcription templates with the desired changes. All substrates used in this study (5′-aaaCCAGUC-3′, parent ligase; 5′-taatacgactCCAGUA-3′, selection; and 5′-UCCAGUA-3′, ribozyme clones; DNA bases lowercase) were purchased (Dharmacon Research) and purified by anion-exchange chromatography (Nucleopac 9 × 250 column, Dionex). Substrates were radiolabeled using T4 polynucleotide kinase and [γ32P]-ATP.
Kinetic analyses
In manual ribozyme assays, the ribozyme (1 μM final concentration) was heated (80°C, 2 min, in H2O) and then cooled (22°C, 2 min), and the reaction was initiated by simultaneous addition of 50 mM buffer, the indicated concentration of Mg2+, and trace 32P-labeled substrate. Buffers were the same as described for selection. KCl (200 mM) was included in initial experiments, but omitted in experiments measuring the Mg2+-dependence of ligation, and in all reactions in which the concentration of Mg2+ was <10 mM, because at low Mg2+ concentration it inhibits the parent ligase (Glasner et al. 2002). Omitting KCl did not affect rates of either parent or clones at ≥10 mM Mg2+. Aliquots were taken at appropriate time points and were added to 2 vol of stop solution containing 120 mM EDTA and 8 M urea. Product and substrate were separated in 20% polyacrylamide gels and quantified by phosphorimaging. Ligation rates were calculated as described previously (Bergman et al. 2000).
Statistical analysis of selection results
Fisher's exact test was used to detect positions at which the nucleotide composition of the selected pool deviated significantly from that expected by chance. Analysis was performed in R version 2.7.1 using a 2 × 4 contingency table in the function fisher.test in the package stats (R Development Core Team 2008). For pooled analysis of lightly mutagenized sites, 19 sets of 35 random numbers uniformly distributed between 0 and 1 were generated using the Mersenne-Twister random-number generator as implemented in R; those numbers <0.1 were considered “nonparental.” Simulated nonparental features were counted in each of the 19 sets, and the two sets with the most nonparental features were discarded. The remaining 17 sets' nonparental features were summed to give an aggregate count of in silico “observed” nonparental features. This simulation was repeated 106 times, generating a normally distributed set of in silico observations. The in vitro observation (10 nonparental features) was far smaller than the smallest of our 106 in silico observations (24 nonparental features, from a distribution with mean 53 ± 7), allowing us to conclude that the in vitro observation would arise by chance with P <10−6.
For Monte Carlo analysis, each ligase position x under scrutiny gave rise to a vector of length 35, whose ith element was the nucleotide identity of successful clone i at position x. Some ordered subset {A} of these elements will be adenosines, some subset {G} will be guanosines, some subset {C} cytosines, some subset {U} uracils, and some subset {E} gaps. The rate constants measured for the successful clones at each Mg2+ concentration were treated as another vector of length 35. R was used to re-order the components of the rate constant vector randomly 10,000 times, producing a matrix of 35 rows by 10,000 columns. Simulated mean rate constants for ribozymes bearing A, G, C, U, or a gap at nucleotide x were computed for each iteration of the Monte Carlo by averaging the elements in, respectively, the set of positions {A}, {G}, {C}, {U}, or {E} of column j of the matrix. Simulated standard deviations were computed in similar fashion. The t-statistic for each accessible pairwise comparison of means was then calculated in each column, where “accessible” comparisons were those for which both nucleotide identities had at least three representatives. Thus, if all five nucleotide identities were represented in at least three clones each at position x, all 10 pairwise combinations—A/C, A/G, A/U, A/gap, C/G, C/U, C/gap, G/U, G/gap, and U/gap—were performed; if four identities were represented, six pairwise comparisons were performed; if three, three; if two, one; and if only one, the position was entirely inaccessible to this analysis.
At each accessible position x in the ribozyme, this procedure yielded a histogram of 10,000 t-statistics for each accessible pairwise nucleotide comparison. The true t-statistic was then calculated from the original vector of rate constants for each accessible comparison and compared with the appropriate histogram. Simulated t-statistics more extreme than the true t-statistic were counted, and the reported P value was determined as
 |
where m is the count of more extreme simulated t-statistics, the factor of 2 is a correction to give the two-tailed probability, and B is the appropriate Bonferroni penalty factor (10, 6, 3, or 1) for the number of comparisons performed.
Nucleotide analog interference mapping
To incorporate nucleotide analogs into the ligase RNAs used for NAIM, linearized DNA encoding ribozyme RNAs at a final concentration of 0.5 mg/mL was mixed with 1 mM ATP, 1 mM GTP, 1 mM CTP, 1 mM UTP; the α-phosphorothioate nucleotide analog of interest (Glen Research) at the concentration recommended by the supplier; and 1X T7 Y639F buffer (40 mM Tris-HCl at pH 8, 4 mM spermidine, 10 mM DTT, 15 mM MgCl2, 0.05% Triton X-100). Transcriptions of the parent ligase also included 2.5 μM T7 promoter oligonucleotide. The reaction was mixed by vortexing prior to addition of the Y639F mutant of T7 RNA polymerase (Sousa and Padilla 1995; Ortoleva-Donnelly et al. 1998) and incubated for 60–75 min at 37°C, when a cloudy precipitate had appeared in all reactions, then gel purified.
Levels of nucleotide analog incorporation at each position were measured by nonselectively labeling the transcribed RNAs and subjecting them to I2 cleavage. Briefly, 20 pmol of each transcript was treated with alkaline phosphatase (Roche) according to the manufacturer's instructions, purified by phenol-chloroform extraction and ethanol precipitation, labeled with [γ32P]-ATP and polynucleotide kinase, and then gel purified. Following ethanol precipitation, pellets were resuspended in a 1:2 mixture of water and 2X denaturing gel loading buffer (8 M urea, 25 mM EDTA). Solutions were split into two aliquots; to the first was added 0.1 vol of freshly prepared 100 mM I2 in EtOH, and to the second, 0.1 vol EtOH. These solutions were heated to 50°C for 10 min and loaded onto two sequencing gels, a 15% and a 6% polyacrylamide TBE-urea gel, to permit resolution of the ribozyme 5′ and 3′ regions, respectively. Banding patterns were visualized by phosphorimaging (Fujifilm BAS-2500) and quantified with the Fujifilm program ImageGauge. Two calibration replicates were performed for each nucleotide-analog transcription.
For interference reactions, nucleotide analog-bearing ribozyme transcripts were mixed in a 2:1 molar ratio with [γ32P]-labeled substrate (5′-dAdAdACCAGUC-3′, parent-ligase substrate; 5′-UCCAGUA-3′, improved-ligase substrate), heated to 80°C for 2 min and then cooled to 22°C for 5 min. Reactions were initiated by addition of stringent ligase buffer (final concentration 50 mM MES at pH 6, 1 mM MgCl2). Parent ligase reactions were incubated at 22°C for 100 min; improved ligase reactions, for 1 min. Reactions were stopped by the addition of 2 vol of 2X denaturing gel-loading buffer. Reactions were then split into two aliquots for treatment with freshly prepared dilute I2 or mock-treatment with EtOH and subjected to gel electrophoresis and quantification as described above. The results reported are the average of three replicates of this interference experiment for each nucleotide analog.
2′-deoxy interference effects were calculated from background-subtracted peak intensities as follows. First, for each experimental replicate, the raw interference effect at each modified residue was calculated as
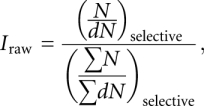 |
where N is the background-subtracted peak intensity for the α-phosphorothioate ribonucleotide analog, dN is the background-subtracted peak intensity for the α-phosphorothioate deoxyribonucleotide analog, and the denominator is a gel loading and exposure normalization factor (total background-subtracted intensity of the α-phosphorothioate ribonucleotide analog lane divided by total background-subtracted intensity of the α-phosphorothioate deoxyribonucleotide analog lane) to permit comparison of replicates run on different gels. Similarly, the relative levels of nucleotide-analog incorporation for each ribo- and deoxyribonucleotide pair were calculated at each position as
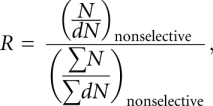 |
from background-subtracted band intensities on the nonselectively labeled calibration gels. The raw interference values from each replicate were then corrected for any differences in α-phosphorothioate ribonucleotide and deoxyribonucleotide analog incorporation at each position:
 |
where 〈R〉 is the average value obtained from two calibration replicates. Calculation of phosphorothioate effects was similar but used only the α-phosphorothioate ribonucleotide analogs:
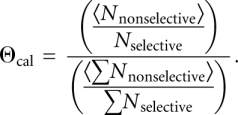 |
Because quantification of band intensities becomes less accurate as bands approach background levels, measured interference values become unreliable at very strong effect levels. We applied a cutoff at the sixfold effect level, truncating Ical values at 6 and 0.167. After application of this cutoff, the Ical values measured at each position were averaged across the three interference replicates run for each nucleotide analog pair. At a given position, interference effects in the two ligase ribozymes were compared using the two-tailed t-test for two populations of equal sizes assuming equal variance. Positions at which average interference effects differed at the P <0.05 level and at which the average parent and improved ligase interference effects were separated by at least a factor of 2 are highlighted in Figure 7.
Dimethyl sulfate interference mapping
For DMS-interference mapping experiments, we used ligase constructs bearing the 18-nt 3′ tail that had been used during selection, which served as a primer-binding site for primer-extension readout. For DMS modification, 44 pmol body-labeled transcript together with 44 μg carrier tRNA in magnesium-free methylation buffer (50 mM Tris-HCl at pH 7.5, 1 mM EDTA) was mixed with 0.05 vol of freshly prepared 5% DMS (in 95% EtOH). After 4 min at 37°C, modification was stopped with 1 vol of freshly prepared DMS-stop solution (1.5 M NaOAc at pH 8.5, 7% β-mercaptoethanol, 0.1 mM EDTA), ethanol precipitated twice, and resuspended in water. This stock of modified RNA was split into two, with one aliquot to serve as the unselected control and the other to be put through the ligase reaction and APM gel-purification. In parallel, mock modifications were performed, using 95% EtOH alone in place of the 5% DMS in 95% EtOH. Because the tRNA required in the DMS reaction inhibited the ligase reaction, the aliquot of modified RNA that was to undergo selection was gel purified. The RNA was then mixed in a 2:1 molar ratio with substrate bearing a 5′-thiophosphate and a 1:1 molar ratio with unlabeled primer (5′-GCGCTGGCGTCTGGCCGG-3′, added to limit misfolding in the presence of the 3′ primer binding site), and incubated at 80°C for 2 min and then at 22°C for 5 min. Ligation was initiated by addition of stringent ligase buffer. Because ligation with the modified substrate and the 3′ extension was slow, reaction times were extended to 11 h and 22 min for the parent and improved ligases, respectively. Reactions were stopped with denaturing gel-loading buffer and resolved on a urea denaturing gel prepared with 6% polyacrylamide and 40 μM APM in the bottom portion of the gel and no APM in the top portion of the gel. Reacted ribozyme, which did not migrate into the bottom portion of the gel, was excised, eluted, and ethanol precipitated.
This reacted RNA was compared with the initial DMS-modified RNA and to mock-DMS-modified RNA using primer extension largely as described in Moazed et al. (1986). Briefly, each sample was mixed with labeled primer and hybridization buffer (final concentrations, 50 mM K-HEPES at pH 7.0, 100 mM KCl) and subjected to denaturation and slow cooling (85°C for 48 sec, followed by a decrease to 40°C at –2.5°C/min) in an MJ Research PTC-100 thermocycler. Primer-extension master mix (final concentrations, 125 mM Tris-HCl at pH 8.4, 200 μM dATP, 200 μM dTTP, 200 μM dGTP, 300 μM dCTP, 6.4 mM MgCl2, 9 mM DTT, 5% glycerol, and 0.027 U/μL AMV-RT [Seikagaku]) was added and extension run at 42°C for 30 min. Extension was stopped with addition of 16 vol of a 1:3 mixture of salt (a solution of one part 300 mM NaOAc pH 8.5 and 1 mM EDTA) and 95% EtOH. After ethanol precipitation, pellets were resuspended in denaturing gel-loading buffer and treated with 0.33 M NaOH for 5 min at 90°C to degrade the RNA from the RT product. Primer extension products were then separated on a sequencing-thickness 8% polyacrylamide TBE-urea gel with a buffer gradient running from 0.5X TBE in the upper buffer chamber to 1X TBE with 0.75 M NaOAc in the lower chamber. To permit identification of bands, RT products were run in parallel with dideoxy sequencing ladders.
We quantified interference with respect to the extent of methylation at a given position as
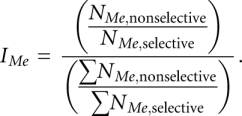 |
Reported interference effects are the average of three replicates, each with its own nonselective control. Significance was determined as for the phosphorothioate and 2′-deoxy interference maps. Not all positions in the ligase ribozymes could be resolved. The cDNAs of the improved ligase consistently showed a gel compression spanning nucleotides 34–41, preventing measurement of interference effects at C35 and C38–C40; all primer-extension reactions performed on the parent ligase, regardless of the presence or absence of DMS modification, showed intense bands at the base of P6, where the reverse transcriptase encounters four stacked G:C pairs; and position 117 could not be resolved on parent ligase gels. Sequence differences also prevented some comparisons between the ribozymes: at positions 19, 20, 45, 73, 76, 84, 95, and 99, only one construct bears a C or A residue; the other is inaccessible to the DMS interference mapping by primer extension.
Figures 1C, 8, and 9 were prepared using the software package PyMOL (Delano 2002).
SUPPLEMENTAL MATERIAL
Supplemental material can be found at http://www.rnajournal.org.
ACKNOWLEDGMENTS
We thank Steven Wang for statistical advice; Piyali Chatterjee, I-hung Shih, and Edward Curtis for useful discussions regarding interference mapping methods; and members of the Bartel laboratory for support and comments. This work was supported by NIH grant GM61835. S.C.B. was an HHMI Pre-doctoral Fellow, D.M.S. was an NSF Pre-doctoral Fellow, and D.P.B. is an HHMI Investigator.
Footnotes
Article and publication date are at http://www.rnajournal.org/cgi/doi/10.1261/rna.1912509.
REFERENCES
- Bartel DP, Szostak JW. Isolation of new ribozymes from a large pool of random sequences. Science. 1993;261:1411–1418. doi: 10.1126/science.7690155. [DOI] [PubMed] [Google Scholar]
- Bergman NH, Johnston WK, Bartel DP. Kinetic framework for ligation by an efficient RNA ligase ribozyme. Biochemistry. 2000;39:3115–3123. doi: 10.1021/bi992654u. [DOI] [PubMed] [Google Scholar]
- Bergman NH, Lau NC, Lehnert V, Westhof E, Bartel DP. The three-dimensional architecture of the class I ligase ribozyme. RNA. 2004;10:176–184. doi: 10.1261/rna.5177504. [DOI] [PMC free article] [PubMed] [Google Scholar]
- Conrad F, Hanne A, Gaur RK, Krupp G. Enzymatic synthesis of 2′-modified nucleic acids: Identification of important phosphate and ribose moieties in RNase P substrates. Nucleic Acids Res. 1995;23:1845–1853. doi: 10.1093/nar/23.11.1845. [DOI] [PMC free article] [PubMed] [Google Scholar]
- Delano WL. PyMOL. DeLano Scientific. 2002. < http://pymol.sourceforge.net>.
- Ekland EH, Bartel DP. The secondary structure and sequence optimization of an RNA ligase ribozyme. Nucleic Acids Res. 1995;23:3231–3238. doi: 10.1093/nar/23.16.3231. [DOI] [PMC free article] [PubMed] [Google Scholar]
- Ekland EH, Bartel DP. RNA-catalysed RNA polymerization using nucleoside triphosphates. Nature. 1996;382:373–376. doi: 10.1038/382373a0. [DOI] [PubMed] [Google Scholar]
- Ekland EH, Szostak JW, Bartel DP. Structurally complex and highly active RNA ligases derived from random RNA sequences. Science. 1995;269:364–370. doi: 10.1126/science.7618102. [DOI] [PubMed] [Google Scholar]
- Giver L, Bartel D, Zapp M, Pawul A, Green M, Ellington AD. Selective optimization of the Rev-binding element of HIV-1. Nucleic Acids Res. 1993;21:5509–5516. doi: 10.1093/nar/21.23.5509. [DOI] [PMC free article] [PubMed] [Google Scholar]
- Glasner ME, Bergman NH, Bartel DP. Metal ion requirements for structure and catalysis of an RNA ligase ribozyme. Biochemistry. 2002;41:8103–8112. doi: 10.1021/bi012179b. [DOI] [PubMed] [Google Scholar]
- Johnston WK, Unrau PJ, Lawrence MS, Glasner ME, Bartel DP. RNA-catalyzed RNA polymerization: Accurate and general RNA-templated primer extension. Science. 2001;292:1319–1325. doi: 10.1126/science.1060786. [DOI] [PubMed] [Google Scholar]
- Joyce GF, Orgel LE. Prospects for understanding the origin of the RNA world. In: Gesteland RF, et al., editors. The RNA world. Cold Spring Harbor Laboratory Press; Cold Spring Harbor, NY: 1999. [Google Scholar]
- Kühne H, Joyce GF. Continuous in vitro evolution of ribozymes that operate under conditions of extreme pH. J Mol Evol. 2003;57:292–298. doi: 10.1007/s00239-003-2480-z. [DOI] [PubMed] [Google Scholar]
- Lawrence MS, Bartel DP. New ligase-derived RNA polymerase ribozymes. RNA. 2005;11:1173–1180. doi: 10.1261/rna.2110905. [DOI] [PMC free article] [PubMed] [Google Scholar]
- Leontis NB, Westhof E. Geometric nomenclature and classification of RNA base pairs. RNA. 2001;7:499–512. doi: 10.1017/s1355838201002515. [DOI] [PMC free article] [PubMed] [Google Scholar]
- Levy M, Griswold KE, Ellington AD. Direct selection of trans-acting ligase ribozymes by in vitro compartmentalization. RNA. 2005;11:1555–1562. doi: 10.1261/rna.2121705. [DOI] [PMC free article] [PubMed] [Google Scholar]
- McGinness KE, Wright MC, Joyce GF. Continuous in vitro evolution of a ribozyme that catalyzes three successive nucleotidyl addition reactions. Chem Biol. 2002;9:585–596. doi: 10.1016/s1074-5521(02)00136-9. [DOI] [PubMed] [Google Scholar]
- Moazed D, Stern S, Noller HF. Rapid chemical probing of conformation in 16 S ribosomal RNA and 30 S ribosomal subunits using primer extension. J Mol Biol. 1986;187:399–416. doi: 10.1016/0022-2836(86)90441-9. [DOI] [PubMed] [Google Scholar]
- Müller UF, Bartel DP. Substrate 2′-hydroxyl groups required for ribozyme-catalyzed polymerization. Chem Biol. 2003;10:799–806. doi: 10.1016/s1074-5521(03)00171-6. [DOI] [PubMed] [Google Scholar]
- Nissen P, Ippolito JA, Ban N, Moore PB, Steitz TA. RNA tertiary interactions in the large ribosomal subunit: The A-minor motif. Proc Natl Acad Sci. 2001;98:4899–4903. doi: 10.1073/pnas.081082398. [DOI] [PMC free article] [PubMed] [Google Scholar]
- Ordoukhanian P, Joyce GF. A molecular description of the evolution of resistance. Chem Biol. 1999;6:881–889. doi: 10.1016/s1074-5521(00)80007-1. [DOI] [PubMed] [Google Scholar]
- Ortoleva-Donnelly L, Szewczak AA, Gutell RR, Strobel SA. The chemical basis of adenosine conservation throughout the Tetrahymena ribozyme. RNA. 1998;4:498–519. doi: 10.1017/s1355838298980086. [DOI] [PMC free article] [PubMed] [Google Scholar]
- Peattie DA, Gilbert W. Chemical probes for higher-order structure in RNA. Proc Natl Acad Sci. 1980;77:4679–4682. doi: 10.1073/pnas.77.8.4679. [DOI] [PMC free article] [PubMed] [Google Scholar]
- Peattie DA, Herr W. Chemical probing of the tRNA–ribosome complex. Proc Natl Acad Sci. 1981;78:2273–2277. doi: 10.1073/pnas.78.4.2273. [DOI] [PMC free article] [PubMed] [Google Scholar]
- Piccirilli JA, Vyle JS, Caruthers MH, Cech TR. Metal ion catalysis in the Tetrahymena ribozyme reaction. Nature. 1993;361:85–88. doi: 10.1038/361085a0. [DOI] [PubMed] [Google Scholar]
- R Development Core Team. R: A language and environment for statistical computing. 2008. < http://www.R-project.org>.
- Ryder SP, Strobel SA. Nucleotide analog interference mapping. Methods. 1999;18:38–50. doi: 10.1006/meth.1999.0755. [DOI] [PubMed] [Google Scholar]
- Schmitt T, Lehman N. Nonunity molecular heritability demonstrated by continuous evolution in vitro. Chem Biol. 1999;6:857–869. doi: 10.1016/s1074-5521(00)80005-8. [DOI] [PubMed] [Google Scholar]
- Shechner DM, Grant RA, Bagby SC, Koldobskaya Y, Piccirilli J, Bartel DP. Crystal structure of the catalytic core of an RNA polymerase ribozyme. Science. 2009 doi: 10.1126/science.1174676. (in press). [DOI] [PMC free article] [PubMed] [Google Scholar]
- Sousa R, Padilla R. A mutant T7 RNA polymerase as a DNA polymerase. EMBO J. 1995;14:4609–4621. doi: 10.1002/j.1460-2075.1995.tb00140.x. [DOI] [PMC free article] [PubMed] [Google Scholar]
- Stern S, Moazed D, Noller HF. Structural analysis of RNA using chemical and enzymatic probing monitored by primer extension. Methods Enzymol. 1988;164:481–489. doi: 10.1016/s0076-6879(88)64064-x. [DOI] [PubMed] [Google Scholar]
- Strobel SA, Shetty K. Defining the chemical groups essential for Tetrahymena group I intron function by nucleotide analog interference mapping. Proc Natl Acad Sci. 1997;94:2903–2908. doi: 10.1073/pnas.94.7.2903. [DOI] [PMC free article] [PubMed] [Google Scholar]
- Verma S, Eckstein F. Modified oligonucleotides: Synthesis and strategy for users. Annu Rev Biochem. 1998;67:99–134. doi: 10.1146/annurev.biochem.67.1.99. [DOI] [PubMed] [Google Scholar]
- Wright MC, Joyce GF. Continuous in vitro evolution of catalytic function. Science. 1997;276:614–617. doi: 10.1126/science.276.5312.614. [DOI] [PubMed] [Google Scholar]
- Zaher HS, Unrau PJ. Selection of an improved RNA polymerase ribozyme with superior extension and fidelity. RNA. 2007;13:1017–1026. doi: 10.1261/rna.548807. [DOI] [PMC free article] [PubMed] [Google Scholar]


