

Abstract
The brains of large mammals have lower rates of metabolism than those of small mammals, but the functional consequences of this scaling are not well understood. An attractive target for analysis is axons, whose size, speed and energy consumption are straightforwardly related. Here we show that from shrews to whales, the composition of white matter shifts from compact, slow-conducting, and energetically expensive unmyelinated axons to large, fast-conducting, and energetically inexpensive myelinated axons. The fastest axons have conduction times of 1–5 ms across the neocortex and <1 ms from the eye to the brain, suggesting that in select sets of communicating fibers, large brains reduce transmission delays and metabolic firing costs at the expense of increased volume. Delays and potential imprecision in cross-brain conduction times are especially great in unmyelinated axons, which may transmit information via firing rate rather than precise spike timing. In neocortex, axon size distributions can account for the scaling of per-volume metabolic rate and suggest a maximum supportable firing rate, averaged across all axons, of 7 ± 2 Hz. Axon size distributions also account for the scaling of white matter volume with respect to brain size. The heterogeneous white matter composition found in large brains thus reflects a metabolically constrained trade-off that reduces both volume and conduction time.
Keywords: allometry, axon scaling, conduction, evolution, optimization, timing
Introduction
To survive, owners of large brains must compete with owners of small brains. However, in large brains, action potentials must travel for long distances, placing limits on the speed at which information can be processed. This scaling problem is particularly apparent in mammalian brains, which, from shrew to whale, can vary in diameter by nearly 100-fold and in volume by ∼100,000-fold. Even in brains as small as that of the rabbit, cross-brain conduction times on the order of 100 ms have been observed (Swadlow, 2000), comparable with the time course of synaptic conductances. Axonal conduction can therefore have a substantial impact on the operation of networks that are distributed across the brain (Ringo et al., 1994) and, therefore, on real-world performance.
Vertebrate axons can respond to selection pressure for speed with two adaptations that increase conduction velocity: myelination and increased diameter (Ritchie, 1995). However, these adaptations are accompanied by significant volume and construction costs. Myelination requires considerable amounts of protein and lipid synthesis, as well as mechanisms to add multiple sheaths of myelin to axons. Both myelination and widening increase axonal volume. Increasing diameter is particularly expensive in terms of construction costs because conduction velocity is approximately linearly proportional to axon diameter in both myelinated (Hursh, 1939) and unmyelinated (Hoffmeister et al., 1991) axons, whereas volume is proportional to the square of the diameter. Maintaining constant conduction delays in larger brains by widening all axons therefore results in an unsupportable increase in the volume of the white matter (Ringo et al., 1994). Indiscriminate scaling up of all axons is thus impractical as a means of maximizing overall processing speed.
White matter volume and brain metabolic rate scale with brain and body size by orderly power laws spanning five orders of magnitude of body size (Hofman, 1988; West et al., 1997; Harrison et al., 2002), suggesting that variation in these quantities is constrained by general design principles. We made measurements to explore how white matter axons have been shaped by competing functional principles. Here, we report that axon size distributions shift in a way that can account for cross-species changes in white matter metabolic rates under the assumption that the mean firing rate is invariant. Within these distributions, we further report special populations of axons that largely preserve the minimum cross-brain conduction time, independent of brain size.
Materials and Methods
Electron microscopy.
Two least shrews (Cryptotis parvus, adult, sex unknown), three mice (Mus musculus, strain B6CBAF1/J, male, 4 months), one rat (Rattus norvegicus, Sprague Dawley, male, 4 months; Taconic Farms, Germantown, NY), two marmosets (Callithrix jacchus, young adult, male), one cat (Felis cattus, male, 17 months), and one macaque monkey (Macaca mulatta, young adult, male) were transcardially perfused manually (in cat, by gravity) under deep anesthesia with DMEM at 37°C followed by Karnovsky's fixative (1.5% glutaraldehyde, 2.0% paraformaldehyde, and 2 mm CaCl2 in 0.1 m sodium cacodylate buffer, pH 7.2) at 37°C, and brains were removed immediately. Sections were taken at rostral postgenu and caudal presplenial locations [at or near macaque sections 4 and 8 in the study be LaMantia and Rakic (1990)]. Sections were postfixed in a 1:4 solution of Karnovsky's fixative:0.1 m sodium cacodylate buffer overnight at 4°C and then sliced to obtain thin sagittal sections as close to the midline as possible. Additional sections were also taken from macaque genu, midpoint, and splenium, from macaque supramarginal gyrus, and from cat anterior sylvian gyrus.
Tissue blocks were osmicated with 2% OsO4 in 0.1 m sodium cacodylate, reduced with 20 mg/ml potassium ferrocyanide, and stained en bloc in the dark with 0.5–1.5% uranyl acetate. Sections were then serially dehydrated into ethanol followed by infiltration with propylene oxide and then 1:1 propylene oxide:Embed-812 resin overnight, and finally embedded in Epon epoxy resin. Thick sections (0.5 μm) were stained with toluidine blue or Azure II and examined under light microscopy to select an area for ultrathin sectioning. Ultrathin sections (80 nm) from each slice were stained with lead acetate, modified Sato's lead solution, or a double stain of Sato's and 1% uranyl acetate. Grids were examined using Zeiss (Oberkochen, Germany) 910 and JEOL (Tokyo, Japan) 100C electron microscopes. Micrographs were taken systematically by taking nonoverlapping images around the border and four to five images near the center of the grid.
Axon density and myelination fraction were determined from electron micrographs either from 5000× or 10,000× film negatives or from digital images taken at 18,000× (270 pixels/μm). Each observation was made over a 100–200 μm2 region. Myelination fraction was calculated once per image and statistics calculated from these observations.
Light microscopy.
Great ape specimens (Pongo pygmaeus, orangutan; Pan troglodytes, common chimpanzee; and Gorilla gorilla, Western lowland gorilla) were obtained from adult animals (31- to 38-year-old) who presented with no signs of neurologic illness and either died naturally or were killed for humane reasons. Brains were immersion-fixed in 10% neutral formalin for up to 9 d, starting within 14 h of death. Tissue blocks from rostral and caudal locations were cryoprotected by immersion in graded sucrose solutions (up to 30%) in PBS, pH 7.4, frozen on dry ice, and sectioned at 60 μm on a freezing sliding microtome. Sections were stained for myelin with black gold; all sections were stained together to ensure identical staining conditions across samples. Axon diameters were estimated at 600× on an Olympus (Tokyo, Japan) brightfield microscope equipped with a Microfire CCD camera.
Cetacean brains (Phocoena phocoena, harbor porpoise; Stenella coeruleoalba, striped dolphin; Tursiops truncatus, bottlenose dolphin; and Megaptera novaeangliae, humpback whale) were immersion-fixed in large volumes of 10% formalin over 3–4 months, dehydrated in graded alcohols, embedded whole in celloidin, and entirely cut in a parasagittal serial series of 40-μm-thick sections on a Goddard brain microtome (Morgane et al., 1980). Every fifth section was mounted on large glass slides, stained with the Loyez modification of the Weigert method for myelin sheaths, and coverslipped (Morgane et al., 1980). Regions of the corpus callosum corresponding topographically to those studied in the other species were identified and sampled. Axon diameters were estimated at 400× on a Zeiss Axiophot photomicroscope equipped with a Zeiss ZVS-47E video camera. Because of the fixation procedure measurements were adjusted based on an estimated volume shrinkage factor of 2 (Blinkov and Glezer, 1968) (diameter correction factor, 21/3 = 1.26).
Detailed axon morphometry.
Axons were traced using ScionImage (Scion, Frederick, MD) and ImageJ (National Institutes of Health, Bethesda, MD). Axon diameter was defined as the average of the fitted major and minor axis lengths for major-minor ratios <1.5, and otherwise as the minor axis. Axon area was defined as the area of the fitted ellipse. In regions that had axons larger than 2.5 μm, to avoid under-representation, counts and measurements were made from image montages covering an area of 6500 to 10,000 μm2. In tissue of light micrographic quality (great apes, human and cetaceans) because of the lack of full preservation only the largest axons were analyzed.
Unless otherwise specified, values cited are mean ± SD in the text and mean ± SEM in graphs.
White matter volume and cross-brain conduction.
White matter volume was estimated using the formula V = π (r2)avLηdG, where (r2)av is the mean-squared radius of all axons for a given species; L is the median axon length, assumed to be one-third of the brain diameter (Braitenberg and Schüz, 1998); η is the proportion of neurons that project axons into white matter; d is the density of neurons in gray matter taken from Schüz and Palm (1989) and extrapolated to different species by brain volume (Tower, 1954); and G is gray matter volume (Zhang and Sejnowski, 2000). η is assumed to be 0.8 ± 0.1, reflecting the fraction of neurons that are pyramidal (Braitenberg and Schüz, 1998) and, thus, project axons into white matter (Jones, 1984). Brain diameters were measured directly or calculated as the diameter of a sphere of the reported brain weight (see Supplemental Material, available at www.jneurosci.org as supplemental material). Conduction velocities v were calculated as v = 0.75*D (Hoffmeister et al., 1991) and v = 5.7*D in myelinated axons (Hursh, 1939), where v is in meters per second and D is the outer axon diameter in micrometers.
Energetic costs of action potentials.
Energy expenditure per action potential was calculated as the energetic cost of discharging the capacitance of an axon through its sodium channels. This measure, although lower than the actual total energetic expenditure by the requirements of basal energy-consuming processes (Attwell and Laughlin, 2001), provides an estimate that scales up with the total metabolic cost. The charge movement resulting from sodium influx in a single action potential is Q=αCΔV, where C is the axon capacitance per unit length and ΔV, taken as 100 mV, is the height of an action potential. α is estimated as 4, reflecting the fact that sodium entry is counteracted by simultaneous recharging of the membrane by potassium efflux during the action potential (Hodgkin, 1975). Unmyelinated axon capacitance was calculated assuming a specific capacitance of 0.90 μF/cm2, giving a specific capacitance for unmyelinated axons that is linearly proportional to axon diameter, and over a diameter range of 0.1–0.5 μm is 3–14 fF/μm axon. Myelinated axon capacitance per length λ of axon was estimated using the concentric capacitor formula C = −2πkε0λ/ln (g), where g is the ratio of inner to outer axon diameter and is 0.8 for myelinated axons (Waxman and Bennett, 1972), and kε0 is the dielectric constant of myelin, with k = 5 and ε0 = 8.85 × 10⁻¹² F/m. Because the thickness of the myelin sheath is linearly proportional to axon diameter, the per-length specific capacitance of myelinated axons is independent of diameter, and is 1.2 fF/μm axon.
The glucose cost of generating one action potential was calculated given that 1 molecule of glucose is used to generate 31 molecules of ATP, and 1 ATP molecule can transport three sodium ions. Under these assumptions, the cost of activity in an unmyelinated axon is 12.6*d amol glucose/action potential/cm axon, where d is the diameter in micrometers, and in all myelinated axons is 0.56 amol glucose/action potential/cm axon, independent of axon diameter. The uncertainty in the calculated macroscopic metabolic rate (see below) (see Fig. 5) stems principally from the variability in myelination fraction among regions and uncertainty in the dielectric constant of myelin and was estimated as 1.2-fold in either direction except for macaque where it was estimated as 1.4-fold.
Figure 5.

Scaling of per-action potential metabolic costs. a, The estimated metabolic cost per fiber of generating an action potential for unmyelinated axons, for myelinated axons, and for all white matter axons averaged. b, The estimated metabolic cost per unit weight of white matter of generating an action potential in all fibers, GAP, decreases as the −0.31 ± 0.03 power of body weight (○). Direct measurement of white matter metabolic rates per unit time, Gt, measured by autoradiographic methods (●; for data sources see the supplemental material, available at www.jneurosci.org), gives a power law slope of −0.32 ± 0.06. c, The same quantities plotted against brain size. The GAP and Gt axes are on logarithmic scales and are aligned with one another by a factor of 14.3 spikes/s.
Results
We used transmission electron microscopy to examine the brains of six species (least shrew, mouse, rat, marmoset, cat, and macaque) and light microscopy to examine eight more species (four cetaceans, three great apes, and one human). These 14 species span nearly five orders of magnitude of brain volume, from least shrew (Cryptotis parva; brain weight 120 mg) to humpback whale (Megaptera novaeangliae; brain weight 7.5 kg). In total, we examined ∼115,000 axons.
Adaptations for conduction velocity: myelination and increased diameter
To survey overall distributions of axon type (unmyelinated and myelinated), we examined sagittal sections of the corpus callosum, which is composed entirely of long-distance axons aligned in parallel and is therefore well suited for detailed structural analysis. In these surveys, we examined electron micrographs in six species at rostral and caudal locations immediately posterior to the genu (postgenu) and anterior to the splenium (presplenium), respectively (Fig. 1a).
Figure 1.

Long-distance axons in the mammalian neocortex. a, Sagittal view of macaque brain with corpus callosum indicated in white. The gray rectangles indicate rostral (r) and caudal (c) locations sampled for transmission electron microscopy. b, Representative micrographs of callosal tissue. Scale bar, 1 μm. c, The fraction of axons that are myelinated increases with brain diameter (slope, 1.04 ± 0.14% myelination per centimeter of brain diameter). Each symbol represents pooled values from one animal. The gray bars indicate ranges of previous adult measurements. d, Volume-filling efficiency of callosal axons. The fraction of volume filled by axons was determined by measuring the fraction of each electron micrograph occupied by myelinated and unmyelinated axons. e, Distribution of axon densities. Box plots indicate median, 25th and 75th percentiles, and dots indicate measurements outside this range. The gray bar indicates the range of previous measurements (Swadlow et al., 1980; LaMantia and Rakic, 1990).
If animals are selected for fast cross-brain impulse conduction, then myelination should be more prevalent in larger-brained mammals. Past measurements, done under nonuniform fixation conditions, have reported widely diverging values for the fraction of myelinated axons even within a single species (for review, see Olivares et al., 2001). A source of error in some surveys is the use of brains preserved by postmortem immersion in fixative, which can lead to tissue degradation, especially in small, unmyelinated fibers. To resolve this problem, we made ultrastructural measurements in six species from tissue prepared by uniform perfusion and tissue preparation methods. In larger brains, we found a clear tendency for more axons to be myelinated (Fig. 1b,c), ranging from least shrew (fraction of myelinated axons, 10 ± 5%, mean ± SD, n = 12 locations in two animals) and mouse (fraction of myelinated axons, 33 ± 10%, n = 59 locations in three animals) to macaque (70 ± 11%, n = 32 locations in one animal). These measurements are consistent with previous reports from individual species in perfused tissue (Fig. 1c, gray bars) (for references, see the supplemental material, available at www.jneurosci.org). The average fraction of myelinated axons increases monotonically with brain diameter (Fig. 1c) (Spearman rank correlation, rS = 1.0, p < 0.01, one-tailed test), supporting the idea that longer conduction distances are associated with the adaptation of increased myelination.
Our observations contrast with a previous comparative study using immersion-fixed brains (Olivares et al., 2001) that failed to find systematic variation in myelination fraction and failed to report any axons wider than 1 μm. To assess the quality of our perfused tissue, we calculated the fraction of our micrographs filled with axons to be 87 ± 5% of the available space (mean ± SD) (Fig. 1d), consistent with adequate preservation of axons. The difference in results therefore may be explained by improvements in our tissue quality compared with past work.
A possible source of uncertainty when comparing myelination fractions is the degree of variability of the fiber composition of the corpus callosum with location. To determine the likely range of variation we made counts at four locations in marmoset corpus callosum. We found that the myelination fraction varied considerably less among locations [coefficient of variation (CV), 0.13; 42 ± 8% genu, n = 5 negatives/montages; 43 ± 4% rostral postgenu, n = 12; 40 ± 6% caudal presplenium, n = 22; 32 ± 10% splenium, n = 8, mean ± SD] than among the six species (CV, 0.50). In other species, variation among locations and over adult life is similarly smaller (Fig. 1c, gray bars) (see supplemental material, available at www.jneurosci.org). We conclude that interspecies variation is sufficiently sampled.
In addition to myelination, a second factor that affects conduction velocity is axon diameter. The hypothesis that axons are under selection for conduction velocity predicts that in larger brains, axons would increase in diameter to compensate for longer conduction paths. To quantify this, in electron micrographs we measured axon densities (Fig. 1e), which depend on axon size distributions. Densities were higher in small-brained animals and declined steadily with increasing brain size (negative trend in rank order of medians, rS = −0.94, p < 0.01). Conversely, mean cross-sectional areas increased monotonically with brain diameter [from shrew axons (0.12 ± 0.01 μm2) and rostral mouse axons (0.22 ± 0.01 μm2) to rostral macaque axons (0.92 ± 0.01 μm2), mean ± SEM; positive trend in rank order, rS = 1.0, p < 0.01].
From smaller to larger brains, myelinated axons differ systematically in their size distribution. In the largest brains for which electron microscopy was done, marmoset, cat, and macaque, the largest myelinated axons constitute extended tails in the size distributions (outer diameter measurements) (Fig. 2a). These tails indicate the presence of very large axons that were wider than 2 μm, which had no counterpart in shrew, mouse or rat (Fig. 2b). Size distributions were shifted progressively to larger axons in larger brains in the order shrew < {mouse, rat} < {marmoset, cat, macaque}, a rank ordering observed for every pairwise comparison of cumulative size (>1 μm) distributions among these three groups. Using light microscopy, we also found very large axons in all cetaceans (two locations examined in each of four species), all great apes (two locations examined in each of three species), and in human (one location examined). Together, these measurements indicate that callosal axons wider than 2 μm are a feature of brains heavier than ∼100 g (marmoset).
Figure 2.

Cross-brain conduction times in large myelinated axons. a, Histograms of size distributions of myelinated axons for mouse and macaque. b, Cumulative histograms of myelinated axon diameter. c, Micrographs demonstrating large myelinated axons (indicated by arrowheads) at noncallosal locations in white matter. Samples were taken from macaque supramarginal gyrus and cat anterior sylvian gyrus. Scale bars, 2 μm. d, The diameters of the widest callosal axons (points) increase with brain diameter, in contrast with mean diameters of unmyelinated (●) and myelinated (○) axons. SEM error bars are smaller than the symbols. Horizontal markers indicate averages of the widest callosal axons, except for shrew, mouse, and rat, where they indicate the largest observed axon. e, Estimated cross-brain conduction times for myelinated axons (average values; open triangles, r) and the widest axons (box plots). The widest axons were taken to be the widest 10 axons per 10,000 μm2, except for shrew, mouse, and rat, in which case the widest observed axon was used.
To test whether the presence of wide axons was a general feature of neocortical white matter we examined noncallosal regions. Figure 2c shows sections from cat anterior sylvian gyrus and macaque supramarginal gyrus. Axons wider than 2 μm were found easily; the widest axons observed were 4.2 μm in cat and 5.5 μm in macaque. However, reliable measurements of the distribution of axon sizes could not be made because axons ran in all directions. To measure the extent to which this variability might depend on the functional type of connection, we selected one brain, marmoset, for electron microscopic measurement at two additional locations, the genu and the splenium. We found axons 2 μm wide or larger in both of these new sampled locations. These findings support the view that throughout neocortical white matter, wide axons play a variety of functional roles in corticocortical communication.
The widest callosal axons increased in size with brain diameter (Fig. 2d), in contrast to the mean diameters of unmyelinated axons (filled symbols) and myelinated axons overall (open symbols). Because conduction speed among myelinated axons is linearly proportional to axon diameter (Hursh, 1939), the observation of progressively larger axons led us to hypothesize that the shortest cross-brain conduction times might be approximately equal across species. To characterize these very large axons in greater detail, we measured the diameters of the 10 largest axons per 10,000 μm2 of callosum. This definition of large axons allowed the use of both perfused brains and immersion-fixed brains. We estimated cross-brain conduction times using the relationships between conduction velocity and diameter for unmyelinated (Hoffmeister et al., 1991) and myelinated (Hursh, 1939) axons (Fig. 2e). We found that the shortest predicted cross-brain conduction times were 1–5 ms in all species examined, much shorter than predicted previously (Ringo et al., 1994), but consistent with the shortest times observed in cat by antidromic activation experiments (Innocenti et al., 1995). These short conduction times suggest that for a specialized population of large myelinated axons, a major selection factor has been a need for fast conduction.
It is important to note that axons with conduction times <5 ms constitute only a small fraction of all axons. Because of variation in axon diameters, within each species the overall distribution of estimated cross-brain conduction times is quite variable. In macaque, the narrowest axons have expected conduction times in the hundreds of milliseconds, comparable with the longest times observed by direct physiological measurement (Swadlow, 2000).
Wide axons that scale up with increasing brain size are also found in the optic nerve. In mammalian optic nerve, most axons are 0.5–2 μm wide and myelinated. However, the size of the largest axons varies greatly across species (Guy et al., 1989). The diameter of the widest axon increased with brain size (rank correlation, rS = 0.90, n = 17, p < 10−6, two-tailed test). The widest axons scale up as the +0.18 ± 0.02 power of brain weight (Fig. 3). In mouse, the widest axons are <2 μm wide (Black et al., 1988), and in least shrew, one-third of optic nerve axons are small and unmyelinated (L. C. Towns, unpublished observations). At the other extreme, large mammals such as horses and bottlenose dolphins have optic nerve axons up to 15–16 μm wide (Dawson et al., 1982; Guo et al., 2001). Over a >10,000-fold range of brain weights, minimum estimated conduction times for a distance of one brain radius (used as an approximation for the eye-to-brain distance) were 0.3 ± 0.2 ms (mean ± SD, 17 species; range, 0.1–0.8 ms). Thus, the appearance of subpopulations of exceptionally wide axons with submillisecond conduction times may be a recurring theme in large brains.
Figure 3.

Increase in widest optic nerve axon diameter with brain size. The widest reported axon in each species was plotted against brain size, giving a fitted log–log slope of +0.18 ± 0.03. Literature sources for data are listed in supplemental material (available at www.jneurosci.org).
Metabolic costs in white matter
The restoration of transmembrane ionic gradients dissipated by neural activity makes up a major component of total metabolic outlay in neural tissue (Attwell and Laughlin, 2001). The architecture of white matter may be shaped by the overall energetic cost of generating action potentials. This cost can be viewed in terms of the macroscopic, per-volume metabolic rate. A shift toward larger axons affects metabolic rates in two ways. First, small axons are predominantly unmyelinated, and thus have high capacitance per unit length. Because the charge movement needed to fire action potentials and to maintain resting potential is proportional to capacitance, unmyelinated axons are therefore energetically more expensive to operate than unmyelinated axons. Second, macroscopic metabolic rates are affected by the fact that different axons occupy different amounts of space. For these reasons, metabolic rate, a per-volume quantity, would be expected to vary inversely with the abundance and size of myelinated axons.
A cost that can be calculated from ultrastructure alone is the relative per-volume amount of glucose consumed per action potential averaged across all axons, GAP. GAP is approximately proportional to the total amount of capacitance per unit volume. As a general rule, unmyelinated axons were smaller than myelinated axons, and the two populations were separated by a size threshold of 0.4–0.5 μm (Fig. 4). As a consequence, unmyelinated and myelinated axons fall into separate broad categories of capacitance and volume. Unmyelinated axons have small volume, but they have high capacitance per unit surface area, an estimated 3–14 fF/cm axon, depending on the diameter, because they are bounded only by a single thickness of lipid bilayer. Myelinated axons have large volume, but have far less capacitance, an estimated 1.2 fF/cm, independent of axon diameter (see Materials and Methods) (Jack et al., 1975).
Figure 4.
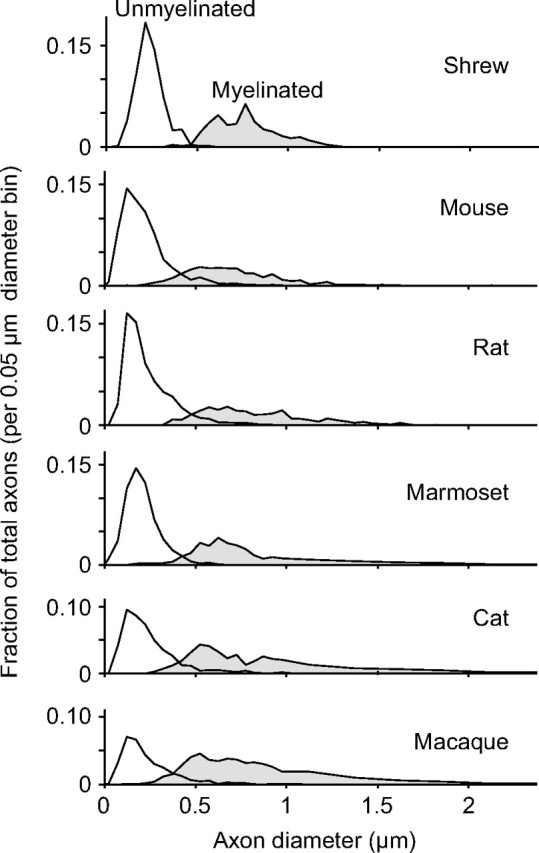
Size distributions of callosal axons as determined by transmission electron microscopy. In all species, the distributions are separated by a diameter threshold of 0.4–0.5 μm.
Because the energy required to discharge a membrane is expected to be proportional to its capacitance, detailed ultrastructural measurements could be used to estimate GAP. We assumed that the amount of Na+ that crosses the membrane from one action potential is Q = αCΔV, where C is the capacitance of an axon, ΔV is the peak voltage change attained by the action potential, and the scaling factor α incorporates a realistic estimate of the amount of Na+ entry needed to generate an action potential. In unmyelinated axons, capacitance is proportional to surface area and therefore to axon diameter. In myelinated axons, whose sheath thickness scales up with axon size, capacitance is independent of axon diameter. The corresponding amount of glucose consumed per action potential per axon is shown in Figure 5a.
Total capacitance per volume was calculated as the sum of mean per-axon unmyelinated and myelinated capacitance (averaged over all diameters), weighted by their counted density. Using our ultrastructural measurements, in rat we find that the expected GAP is 570 pmol glucose/action potential in all fibers/g tissue. The corresponding energy production based on 31 molecules of ATP/molecule of glucose and 31 kJ/mol ATP is 550 μJ/action potential in all fibers/g tissue, comparable with direct measurements of “recovery heat” in unmyelinated mammalian nerve, 390 μJ/action potential/g tissue (Ritchie, 1973). For larger brains, the calculated cost decreases considerably because of the growing prevalence of myelinated axons, which have far less capacitance than unmyelinated axons and occupy large amounts of volume per axon. Because their greater capacitance, unmyelinated axons dominate GAP, accounting for 81% (macaque) to 97% (shrew) of total metabolic rate. The overall per-volume, per-action potential expected metabolic rate is approximately proportional to the −0.31 ± 0.03 power of body size (Fig. 5b, filled circles).
This per-action potential metabolic cost across all fibers GAP can be compared with direct measurements of the per-time glucose consumption rate Gt, which has been determined using deoxyglucose consumption measurements from white matter (supplemental text and Table 1, available at www.jneurosci.org as supplemental material). Measured metabolic rates are shown in Figure 5, b and c, as open circles. Deoxyglucose consumption rates from the corpus callosum and from other white matter regions show an interspecies power slope of −0.32 ± 0.06 power, indistinguishable from the per-action potential calculated cost (p = 0.8, two-tailed t test, 9 df) (Fig. 5b, open circles). A close match between calculation and experiment is also seen when brain size is used as the reference variable (per-action potential cost calculated from anatomy, slope = −0.34 ± 0.04; actual metabolic measurements, slope = −0.38 ± 0.05; p = 0.5, two-tailed test) (Fig. 5c).
Table 1.
Estimates of spike timing precision and the energetic cost of timing-based transmission as a function of axon type and diameter
| Axon diameter (μm) | Axon type | Conduction speed (m/s) | Spike-time precision (ms) |
Energetic cost per centimeter of axon per spike (fJ) | |
|---|---|---|---|---|---|
| 1 cm | 10 cm | ||||
| 0.3 | Unmyelinated | 0.2 | 9 | 90 | 3500 |
| 1 | Myelinated | 5.7 | 0.35 | 3.5 | 375 |
| 3 | Myelinated | 17.1 | 0.12 | 1.2 | 375 |
Because GAP is a cost per action potential and Gt is a rate per unit time, similiarity of the fitted slopes implies that the two quantities are proportional by a factor expressible in units of action potentials per second. For mouse, rat, cat and macaque the ratio Gt/GtAP corresponds to a conversion factor of 14 ± 2 (mean ± SD) spikes/s. Thus, the composition of white matter axons varies in a species-specific way that is consistent with previously observed variations in metabolic rates if activity levels are similar across species.
Axon scaling and white matter volume
The observation that axon diameters vary so much indicates that a functional advantage may exist not only for wide axons, but also for small, slowly conducting axons. One possible advantage of small axons is their volume, because large axons make a considerable contribution to the total volume of the neocortical white matter. Indeed, a 10-μm-wide myelinated axon occupies 2500 times as much volume per unit length as a 0.2-μm-wide unmyelinated axon of equal length (Fig. 6a).
Figure 6.

Contribution of large axons to neocortical white matter volume. a, Relative cross sections of typical unmyelinated axons, myelinated axons, and giant myelinated axons. b, Estimated cumulative fraction of callosal axon volume above a given axon diameter. For clarity, cumulative fractions for diameters smaller than 1 μm (see Fig. 4) are not shown. c, The empirical scaling relationship between white matter volume and gray matter volume (Zhang and Sejnowski, 2000) shows a power law with a log–log slope of 1.23 ± 0.01. d, The estimated total volume of white matter axons (filled squares) can account for the supralinear growth in white matter volume (open circles) relative to gray matter. Replacing the overall axon distribution with that of mouse (open squares) reduces the axon volume to an approximately linear relationship. Inset, Calculated axon volume versus actual white matter volume.
We estimated the total fraction of the callosal axon volume occupied by the largest axons. We did this by calculating one minus the cumulative fraction of axon area (Fig. 6b), a measure that corresponds to the volume fraction occupied by axons of a certain size or wider if axons crossing the brain are of similar length. In small-brained mammals, axons with diameter larger than 2 μm are rare or nonexistent (0.0% of myelinated axons in shrew, 0.4% in mouse, 0.0% in rat) and therefore make little contribution to total white matter volume. In contrast, such wide axons are considerably more abundant in larger brains (3.9% of myelinated axons in marmoset, 8.4% in cat, and 3.3% in macaque) and, thus, make a large contribution to white matter volume. Thus, although these large axons are numerically few, because of their size they contribute disproportionately to callosal axon volume.
An estimate of the total volume of white matter axons can be obtained by multiplying the typical axon length (Schüz and Palm, 1989; Zhang and Sejnowski, 2000), the number of projecting neurons, which can be estimated from neuron density measurements (Tower, 1954), and the average cross-sectional area of callosal axons (Fig. 1d), assuming that the length of long-range axons is proportional to the cube root of brain volume. Because axons are closely packed throughout white matter, this volume should be approximately equal to the white matter volume. To account for variation in axon composition between corpus callosum and other white matter regions, the average cross-sectional area was assumed to have an uncertainty of 20% for purposes of estimating the uncertainty in GAP. The well defined scaling relationship between white matter volume and gray matter volume (Fig. 6c) (Zhang and Sejnowski, 2000) provides a standard for comparison.
The estimated total axon volume does in fact closely match the actual white matter volume (Fig. 6d). The total axonal volume accounts for the previous observation that white matter volume W increases disproportionately with respect to gray matter volume G according to the allometric relationship W ∼ G1.23±0.01 (Zhang and Sejnowski, 2000; Changizi, 2001). The exponent for the predicted total axon volume gives the relationship Vaxon ∼ G1.21±0.01 (exponents not different, p = 0.2, two-tailed test). Scaling of large axons plays a key role in this supralinear (power law slope >1) scaling because neuron density declines in larger brains (Tower, 1954) so that the estimated number of neocortical neurons is actually a less-than-linear function of gray matter volume (approximately proportional to G0.68). If the axon size distribution were the same as the observed distribution in mouse, the total axonal volume would be approximately proportional to gray matter volume (fitted power law G1.01 ± 0.001), removing the observed supralinearity. These results suggest that the proliferation of very large axons may be limited by a need to prevent runaway growth in brain volume (Ringo et al., 1994). Thus, small axons represent a compact solution to the problem of maintaining connectivity while contributing minimally to the growth in white matter volume.
Discussion
Our results indicate that neocortical white matter axons can be divided into three populations: unmyelinated, myelinated, and giant myelinated fibers wider than ∼2 μm. As brain diameter increases, myelinated and giant myelinated fibers become more prevalent. Unmyelinated, high-capacitance fibers decrease in abundance in larger brains, consistent with the lower metabolic rates seen in a variety of tissues as animals become larger (West et al., 1997). Among myelinated fibers, the largest axons scale up in size with brain diameter, indicating that these very fast axons maintain short cross-brain conduction times. The variation seen among myelinated axons suggests that white matter is composed of populations separable not only by size but also by functional role.
Because they have very slow conduction velocities, unmyelinated axons are poorly suited to convey information in the form of precise spike timing (Table 1). Transmission speeds can increase or decrease by up to 20% if an axon has fired recently (Swadlow, 2000), presumably because of changes in the activation/inactivation state of voltage-gated channels or accumulation of intracellular sodium. For axons with long conduction times, changes in transmission speed introduce potentially large amounts of timing jitter. For instance, an action potential traveling at <0.3 m/s across a 15 cm human brain would take over half a second to arrive at its destination, with variation in arrival time of up to 100 ms. In contrast, arrival times in myelinated axons would vary at most by a few milliseconds. Thus unmyelinated long-distance neocortical axons may encode signals in the form of firing rates and brief bursts rather than precisely timed spikes, and represent a case in which a premium is placed on volume minimization with the accompanying penalties of higher metabolic rate and slower speed.
At the other size extreme, large myelinated axons are likely to play functional roles requiring speed or precise timing. These axons constitute only a small fraction of the total number present in white matter, suggesting that they constitute highly specific highways for neural activity. Their low capacitance and intrinsically precise timing allows them to transmit information with much less energy expenditure than unmyelinated axons. Larger axons may also be able to support more extensive terminal arborizations, thus making more synapses and enhancing their influence in long-distance communication. In the case of callosal axons, which originate from neurons in both supragranular and infragranular layers, communication over rapidly conducting axons may be necessary to synchronize activity between distant cortical areas (Swadlow, 2000). Computational models (Bush and Sejnowski, 1996) suggest that during oscillatory activity, the generation of synchronous firing requires the participation of axons that have conduction delays of <5 ms. However, the great majority of midline-crossing axons have much longer conduction times (Ringo et al., 1994). Thus, although large axons are costly to build, they may be necessary for synchrony at the level of the whole neocortex (Varela et al., 2001).
Another possible role for fast transmission is the preservation of precise spike timing. In the optic nerve, submillisecond conduction times preserve the timing of action potentials relative to one another as they propagate down wide axons. Similarly, the extrastriate areas MT and MST, which are thought to help process moving visual stimuli, are heavily myelinated. MT receives a population of very large (2–3 μm) axons originating from primary visual cortex (Rockland, 2002) with exceptionally short conduction times of 1–2 ms (Movshon and Newsome, 1996), which would minimize the timing jitter in action potentials. Fast conduction all the way from the retina through MT would allow spike timing to convey differences in stimulus timing in a Reichardt-style motion detector (DeFelipe et al., 2002).
Application of our measurements to neocortical white matter scaling shows a possible means of filling gaps in several theoretical analyses based on wiring architecture (Zhang and Sejnowski, 2000; Changizi, 2001; Harrison et al., 2002). Zhang and Sejnowski (2000) used the principle of wire length minimization to account for the disproportionate increase in white matter volume in large brains. However, their extrapolation from wiring length to wiring volume required the assumption that the mean axon cross-sectional area is constant because, unlike idealized wires, axons have nonzero thickness and therefore occupy an amount of space that cannot be specified by length-minimization arguments alone. Because the mean axon cross-sectional area varies by at least eight-fold, this particular scenario is invalid. Replacement of another assumption by Zhang and Sejnowski (2000), that the neuron density per unit area of neocortical sheet is constant (Rockel et al., 1980), a claim that is superseded by stereologically more rigorous measurements (Tower, 1954; Changizi, 2001) suggests that per-surface-area neuron density in fact declines with brain size by the same factor as the increase in axon cross section. Our measurements are consistent with this revised assumption (Changizi, 2001; Harrison et al., 2002).
Although the distribution of firing rates among neocortical neurons is not known (Shoham et al. 2006), the ratio of the predicted per-action-potential and observed per-gram energy consumption corresponds to a supportable mean firing rate of ∼14 Hz if all metabolic energy is converted to action potential firing. However, a substantial fraction of the brain's metabolism continues in the absence of electrical activity; the rate of glucose consumption drops by no more than half under conditions such as coma, barbiturate anesthesia, and ouabain blockade of sodium pump activity (for review, see Sokoloff, 1996). A more conservative assumption, that half the metabolic energy in white matter is available for generating action potentials, indicates that the maximum supportable firing rate, averaged across all neurons, is 7 ± 2 Hz for brain sizes ranging from shrew to macaque. This estimated maximum rate carries many uncertainties because of the assumptions necessary in making the calculation, and should be directly testable by future cellular-level physiological investigations in awake, behaving animals (Dombeck et al., 2007).
The availability of enough metabolic energy to support an estimated firing rate of 7 Hz is broadly consistent with the mean rate of 4 Hz assumed by Attwell and Laughlin (2001) in their estimates of the energetic costs of signaling processes in rat neocortical gray matter. Another calculation based on metabolic rate has suggested the possibility that in human neocortex the mean firing rate might be <1 Hz (Lennie, 2003). However, that calculation used mouse anatomical parameters for axonal and dendritic structure. Both our current findings and previous observations (for review, see Wittenberg and Wang, 2007) illustrate that interspecies variations in neuron structure are considerable and must be taken into account in energetic calculations. Therefore the calculation of energetic costs in human neocortical tissue is a topic worth revisiting. Energetic cost breakdowns in white matter are of particular interest because, compared with gray matter, calculation is simplified by the white matter's predominantly axonal composition. Such a calculation will require high-quality ultrastructural measurements. Because human brain metabolism is somewhat higher than expected from simple extrapolation of the scaling law seen in smaller brains (supplemental text and Table 1, available at www.jneurosci.org as supplemental material), it is likely that human neocortical white matter is capable of supporting firing rates equal to or >7 Hz.
Unmyelinated axons should consume 2.5- to 10-fold more energy per spike than myelinated axons. However, this concept is contradicted by a previous claim. Ritchie (1967) suggested that the per-fiber cost of firing was similar for unmyelinated and myelinated axons. He arrived at this conclusion by comparing per-axon oxygen consumption for C fibers, which are unmyelinated, with an estimated value for myelinated axons obtained by dividing the oxygen consumption of whole sciatic nerve (Brink et al., 1952) by the total number of axons (Dunn, 1909; Gasser and Erlanger, 1927). However, anatomical work since that time has established that two-thirds of the axons in adult sciatic nerve are unmyelinated (Jenq et al. 1986). Thus, in both C fibers and sciatic nerve, oxygen consumption is likely to be dominated by contributions from unmyelinated axons, leaving the claim unsupported.
The parameters of speed, timing, and energetic cost can be combined to estimate the cost of transmitting information. Although an exact calculation of information would require experimental knowledge that is currently unavailable, such as the distribution of firing rates and patterns among neocortical axons, an upper bound can be estimated. The maximum possible amount of information carried by spike timing can be expressed in terms of the bit content of a single action potential (Brenner et al. 2000). For a mean firing rate of r, a single action potential arriving at a random time during an interval Δt can carry up to log2(1/rΔt) bits of information. For example, if the interval Δt represents variability in transit time and is ± 10% of the total conduction time, in a 1-cm-long axon with a mean firing rate of 7 Hz the maximum information content is between 4 and 10 bits per spike depending on the axon diameter, with the most information per spike per axon carried by the widest myelinated axons.
If transmission time is variable, as has been observed (Swadlow et al., 1980; Swadlow, 2000), timing precision should decrease with increasing transmission distance, thus leading to the loss of information. For a 10-fold longer conduction distance the maximum information content decreases by log2(10) = 3.3 bits per spike. Thus, the amount of spike timing-based information potentially lost over long-distance transmission is a substantial fraction of the total information. In unmyelinated axons the fractional loss of timing-based information is particularly great, favoring the transmission of information via changes in firing rate (e.g., C fibers) (Basbaum and Jessell, 2000). Finally, in all cases energetic costs scale up linearly with conduction distance. Taking these factors into account, sending information costs considerably more energy in a large brain than in a small brain.
We suggest that neocortical white matter architecture must follow a limited energy budget within which to optimize both volume (Hsu et al., 1998; Chklovskii, 2004) and conduction time (Ringo et al., 1994). Our work suggests that the mean firing rate of long distance-projecting neocortical pyramidal neurons may be relatively unvarying across species. Moreover, within a species, white matter metabolic rates at other neocortical locations appear to be similar: among neocortical regions that include both callosal and noncallosal tissue, the range of observed values is ∼1.2-fold in mouse (Nowaczyk and Des Rosiers, 1981), in rat (Sokoloff et al., 1977; Collins et al., 1987), and in macaque (Kennedy et al., 1978; Shapiro et al., 1978). Metabolic rate may be limited by the energy-supplying capacity of the circulatory network (West et al., 1997). If this is so, then the mean firing rate and the distribution of axon sizes are strongly linked to one another by a general constraint, the metabolic rate. In this hypothesis, higher firing rates are achievable in white matter, but only if a structure contains fewer unmyelinated axons than what we report here for the corpus callosum. Conversely, predominantly unmyelinated structures might only be able to support low-frequency and/or sparse firing. In this context, our measurements provide a view of neocortical architecture that is centered on metabolic constraints on axon composition. Further characterization of the sizes, origins, and targets of neocortical white matter axons will help in understanding system-wide dynamics of neural activity.
Footnotes
This work was supported by Howard Hughes Medical Foundation undergraduate summer fellowships (M.J.B., M.W.W.), by the Alfred P. Sloan Foundation, the W. M. Keck Foundation (S.S.-H.W.), by National Institutes of Health Grant MH58911, and James S. McDonnell Foundation Grant 22002078 (P.R.H.). We thank N. Yao, J. Woodruff, J. Goodhouse, and P. Bisher for help with electron microscopy; N. Hastings, G. Brackee, C. Fornal, N. Darmani, E. Gould, C. Gross, B. Jacobs, and O. Mock for help with animals; J. Erwin for access to great ape brains; H. Yu and D. Matthews for measurements; and M. J. Berry II, G. Dienel, A. Fairhall, S. Shoham and G. Wittenberg for discussions.
References
- Attwell D, Laughlin SB. An energy budget for signaling in the grey matter of the brain. J Cereb Blood Flow Metab. 2001;21:1133–1145. doi: 10.1097/00004647-200110000-00001. [DOI] [PubMed] [Google Scholar]
- Basbaum AJ, Jessell TM. The perception of pain. In: Kandel ER, Schwartz JH, Jessell TM, editors. Principles of neural science. Ed 4. New York: McGraw-Hill; 2000. pp. 472–491. [Google Scholar]
- Black JA, Fields RD, Waxman SG. Macromolecular structure of axonal membrane in the optic nerve of the jimpy mouse. J Neuropathol Exp Neurol. 1988;47:588–598. doi: 10.1097/00005072-198811000-00002. [DOI] [PubMed] [Google Scholar]
- Blinkov SM, Glezer II. New York: Basic Books; 1968. The human brain in figures and tables: a quantitative handbook. [Google Scholar]
- Braitenberg V, Schüz A. Cortex: statistics and geometry of neuronal connectivity. Ed 2. Berlin: Springer; 1998. [Google Scholar]
- Brenner N, Strong SP, Koberle R, Bialek W, de Ruyter van Steveninck RR. Synergy in a neural code. Neural Comput. 2000;12:1531–1552. doi: 10.1162/089976600300015259. [DOI] [PubMed] [Google Scholar]
- Brink F, Bronk DW, Carlson FD, Connelly CM. The oxygen uptake of active axons. Cold Spring Harb Symp Quant Biol. 1952;17:53–67. doi: 10.1101/sqb.1952.017.01.008. [DOI] [PubMed] [Google Scholar]
- Bush P, Sejnowski TJ. Inhibition synchronizes sparsely connected cortical neurons within and between columns in realistic network models. J Comput Neurosci. 1996;3:91–110. doi: 10.1007/BF00160806. [DOI] [PubMed] [Google Scholar]
- Changizi MA. Principles underlying mammalian neocortical scaling. Biol Cybern. 2001;84:207–215. doi: 10.1007/s004220000205. [DOI] [PubMed] [Google Scholar]
- Chklovskii DB. Synaptic connectivity and neuronal morphology: two sides of the same coin. Neuron. 2004;43:609–617. doi: 10.1016/j.neuron.2004.08.012. [DOI] [PubMed] [Google Scholar]
- Collins RC, McCandless DW, Wagman IL. Cerebral glucose utilization: comparison of [14C]deoxyglucose and [6-14C]glucose quantitative autoradiography. J Neurochem. 1987;49:1564–1570. doi: 10.1111/j.1471-4159.1987.tb01028.x. [DOI] [PubMed] [Google Scholar]
- Dawson WW, Hawthorne MN, Jenkins RL, Goldston RT. Giant neural systems in the inner retina and optic nerve of small whales. J Comp Neurol. 1982;205:1–7. doi: 10.1002/cne.902050102. [DOI] [PubMed] [Google Scholar]
- DeFelipe J, Elston GN, Fujita I, Fuster J, Harrison KH, Hof PR, Kawaguachi Y, Martin KA, Rockland KS, Thomson AM, Wang SSH, White EL, Yuste R. Neocortical circuits: Evolutionary aspects and specificity versus non-specificity of synaptic connections. Remarks, main conclusions and general comments and discussion. J Neurocytol. 2002;30:387–416. doi: 10.1023/a:1024142513991. [DOI] [PubMed] [Google Scholar]
- Dunn EH. A statistical study of the medullated nerve fibers innervating the legs of the leopard frog, Rana pipiens, after unilateral section of the vertical roots. J Comp Neurol. 1909;19:685–720. [Google Scholar]
- Gasser HS, Erlanger J. The role played by the sizes of the constituent fibers of a nerve trunk in determining the form of its action potential wave. Am J Physiol. 1927;80:522–547. [Google Scholar]
- Dombeck DA, Khabbaz AN, Collman F, Adelman TL, Tank DW. Imaging large-scale neural activity with cellular resolution in awake, mobile mice. Neuron. 2007;56:43–57. doi: 10.1016/j.neuron.2007.08.003. [DOI] [PMC free article] [PubMed] [Google Scholar]
- Guo X, Aoyama M, Sugita S. Quantitative anatomy of the optic nerve of the horse (Thoroughbred) J Vet Med Sci. 2001;63:971–975. doi: 10.1292/jvms.63.971. [DOI] [PubMed] [Google Scholar]
- Guy J, Ellis EA, Kelley K, Hope GM. Spectra of G ratio, myelin sheath thickness, and axon and fiber diameter in the guinea pig optic nerve. J Comp Neurol. 1989;287:446–454. doi: 10.1002/cne.902870404. [DOI] [PubMed] [Google Scholar]
- Harrison KH, Hof PR, Wang SS-H. Scaling laws in the mammalian neocortex: does form provide clues to function? J Neurocytol. 2002;31:289–298. doi: 10.1023/a:1024178127195. [DOI] [PubMed] [Google Scholar]
- Hodgkin A. The optimum density of sodium channels in an unmyelinated nerve. Philos Trans R Soc Lond B Biol Sci. 1975;270:297–300. doi: 10.1098/rstb.1975.0010. [DOI] [PubMed] [Google Scholar]
- Hoffmeister B, Jänig W, Lisney SJ. A proposed relationship between circumference and conduction velocity of unmyelinated axons from normal and regenerated cat hindlimb cutaneous nerves. Neurosci. 1991;42:603–611. doi: 10.1016/0306-4522(91)90402-a. [DOI] [PubMed] [Google Scholar]
- Hofman MA. Size and shape of the cerebral cortex in mammals. II. The cortical volume. Brain Behav and Evol. 1988;32:17–26. doi: 10.1159/000116529. [DOI] [PubMed] [Google Scholar]
- Hsu A, Tsukamoto Y, Smith RG, Sterling P. Functional architecture of primate cone and rod axons. Vision Res. 1998;38:2539–2549. doi: 10.1016/s0042-6989(97)00370-2. [DOI] [PubMed] [Google Scholar]
- Hursh JB. Conduction velocity and diameter of nerve fibers. Am J Physiol. 1939;127:131–139. [Google Scholar]
- Innocenti GM, Aggoun-Zouaoui D, Lehmann P. Cellular aspects of callosal connections and their development. Neuropsychologia. 1995;33:961–987. doi: 10.1016/0028-3932(95)00033-y. [DOI] [PubMed] [Google Scholar]
- Jack JJB, Noble D, Tsien RW. Electric current flow in excitable cells. Oxford: Oxford UP; 1975. [Google Scholar]
- Jenq CB, Chung K, Coggeshall RE. Postnatal loss of axons in normal rat sciatic nerve. J Comp Neurol. 1986;244:445–450. doi: 10.1002/cne.902440404. [DOI] [PubMed] [Google Scholar]
- Jones EG. Laminar distribution of cortical efferent cells. In: Peters A, Jones EG, editors. Cerebral cortex, Vol I: Cellular components of the cerebral cortex. New York: Plenum; 1984. pp. 521–553. [Google Scholar]
- Kennedy C, Sakurada O, Shinohara M, Jehle J, Sokoloff L. Local cerebral glucose utilization in the normal conscious macaque monkey. Ann Neurol. 1978;4:293–301. doi: 10.1002/ana.410040402. [DOI] [PubMed] [Google Scholar]
- LaMantia AS, Rakic P. Cytological and quantitative characteristics of four cerebral commissures in the rhesus monkey. J Comp Neurol. 1990;291:520–537. doi: 10.1002/cne.902910404. [DOI] [PubMed] [Google Scholar]
- Lennie P. The cost of cortical computation. Curr Biol. 2003;13:493–497. doi: 10.1016/s0960-9822(03)00135-0. [DOI] [PubMed] [Google Scholar]
- Morgane PJ, acobs MS, McFarland WL. The anatomy of the brain of the bottlenose dolphin (Tursiops truncatus). Surface configurations of the telencephalon of the bottlenose dolphin with comparative anatomical observations in four other cetacean species. Brain Res Bull. 1980;5(Suppl 3):1–107. [Google Scholar]
- Movshon JA, Newsome WT. Visual response properties of striate cortical neurons projecting to area MT in macaque monkeys. J Comp Neurol. 1996;16:7733–7741. doi: 10.1523/JNEUROSCI.16-23-07733.1996. [DOI] [PMC free article] [PubMed] [Google Scholar]
- Nowaczyk T, Des Rosiers MH. Application of the 2-deoxy-d-[14C]-glucose method to the mouse for measuring local cerebral glucose utilization. Eur Neurol. 1981;20:169–172. doi: 10.1159/000115227. [DOI] [PubMed] [Google Scholar]
- Olivares R, Montiel J, Aboitiz F. Species differences and similarities in the fine structure of the mammalian corpus callosum. Brain Behav Evol. 2001;57:98–105. doi: 10.1159/000047229. [DOI] [PubMed] [Google Scholar]
- Ringo JL, Doty RW, Demeter S, Simard PY. Time is of the essence: a conjecture that hemispheric specialization arises from interhemispheric conduction delay. Cere Cortex. 1994;4:331–343. doi: 10.1093/cercor/4.4.331. [DOI] [PubMed] [Google Scholar]
- Ritchie JM. The oxygen consumption of mammalian non-myelinated nerve fibres at rest and during activity. J Physiol. 1967;188:309–329. doi: 10.1113/jphysiol.1967.sp008141. [DOI] [PMC free article] [PubMed] [Google Scholar]
- Ritchie JM. Energetic aspects of nerve conduction: the relationships between heat production, electrical activity and metabolism. Prog Biophys Mol Biol. 1973;26:147–187. doi: 10.1016/0079-6107(73)90019-9. [DOI] [PubMed] [Google Scholar]
- Ritchie JM. Physiology of axons. In: Waxman SG, Kocsis JD, Stys PK, editors. The axon: structure, function and pathophysiology. New York: Oxford UP; 1995. pp. 68–96. [Google Scholar]
- Rockel AJ, Hiorns RW, Powell TPS. The basic uniformity in structure of the neocortex. Brain. 1980;103:221–244. doi: 10.1093/brain/103.2.221. [DOI] [PubMed] [Google Scholar]
- Rockland KS. Visual cortical organization at the single axon level: a beginning. Neurosci Res. 2002;42:155–166. doi: 10.1016/s0168-0102(01)00321-2. [DOI] [PubMed] [Google Scholar]
- Schüz A, Palm G. Density of neurons and synapses in the cerebral cortex of the mouse. J Comp Neurol. 1989;286:442–455. doi: 10.1002/cne.902860404. [DOI] [PubMed] [Google Scholar]
- Shapiro HM, Greenberg JH, Reivich M, Ashmead G, Sokoloff L. Local cerebral glucose uptake in awake and halothane-anesthetized primates. Anesthesiology. 1978;48:97–103. doi: 10.1097/00000542-197802000-00004. [DOI] [PubMed] [Google Scholar]
- Shoham S, O'Connor DH, Segev R. How silent is the brain: is there a “dark matter” problem in neuroscience? J Comp Physiol A Neuroethol Sens Neural Behav Physiol. 2006;192:777–784. doi: 10.1007/s00359-006-0117-6. [DOI] [PubMed] [Google Scholar]
- Sokoloff L, Reivich M, Kennedy C, Des Rosiers MH, Patlak CS, Pettigrew KD, Sakurada O, Shinohara M. The [14C]deoxyglucose method for the measurement of local cerebral glucose utilization: theory, procedure, and normal values in the conscious and anesthetized albino rat. J Neurochem. 1977;28:897–916. doi: 10.1111/j.1471-4159.1977.tb10649.x. [DOI] [PubMed] [Google Scholar]
- Sokoloff L. Cerebral metabolism and visualization of cerebral activity. In: Greger R, Windhorst U, editors. Comprehensive human physiology. Vol I. Berlin: Springer; 1996. pp. 579–602. [Google Scholar]
- Swadlow HA. Information flow along neocortical axons. Time and the brain. In: Miller R, editor. Conceptual advances in brain research. Amsterdam: Harwood Academic; 2000. pp. 131–155. [Google Scholar]
- Swadlow HA, Waxman SG, Geschwind N. Small-diameter nonmyelinated axons in the primate corpus callosum. Arch Neurol. 1980;37:114–115. doi: 10.1001/archneur.1980.00500510072016. [DOI] [PubMed] [Google Scholar]
- Tower DB. Structural and functional organization of mammalian cerebral cortex: the correlation of neurone density with brain size. J Comp Neurol. 1954;101:9–52. doi: 10.1002/cne.901010103. [DOI] [PubMed] [Google Scholar]
- Varela F, Lachaux JP, Rodriguez E, Martinerie J. The brainweb: phase synchronization and large-scale integration. Nat Rev Neurosci. 2001;2:229–239. doi: 10.1038/35067550. [DOI] [PubMed] [Google Scholar]
- Waxman SG, Bennett MVL. Relative conduction velocities of small myelinated and non-myelinated fibres in the central nervous system. Nature New Biol. 1972;238:217–219. doi: 10.1038/newbio238217a0. [DOI] [PubMed] [Google Scholar]
- West GB, Brown JH, Enquist BJ. A general model for the origin of allometric scaling laws in biology. Science. 1997;276:122–126. doi: 10.1126/science.276.5309.122. [DOI] [PubMed] [Google Scholar]
- Wittenberg GM, Wang SS-H. Evolution and scaling of dendrites. In: Hausser M, Spruston N, Stuart G, editors. Dendrites. Ed 2. Oxford: Oxford UP; 2007. [Google Scholar]
- Zhang K, Sejnowski TJ. A universal scaling law between gray matter and white matter of cerebral cortex. Proc Natl Acad Sci USA. 2000;97:5621–5626. doi: 10.1073/pnas.090504197. [DOI] [PMC free article] [PubMed] [Google Scholar]