Introduction
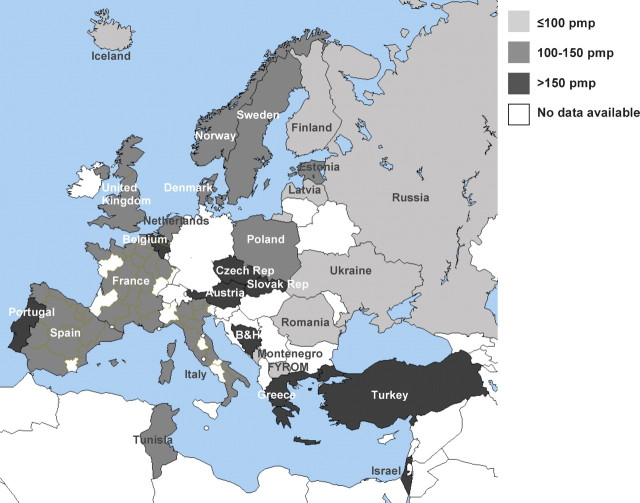
This summary of the 2007 ERA-EDTA Registry Report includes data on renal replacement therapy (RRT) from 49 national and regional registries in 28 countries in Europe and bordering the Mediterranean Sea (Figure 1). Data sets with individual patient data for analysis were received from 34 registries, whereas 17 registries contributed data only in aggregated form. For both types of registries, we present incidence and prevalence data as well as transplant rates. Survival analysis used the data from countries and regions that provided individual patient records. More detailed data than those presented in this paper can be found in the 2007 ERA-EDTA Registry Report [1] that is also available on www.era-edta-reg.org.
Fig. 1.
Incidence of RRT per million population (pmp) at Day 1, 2007. B&H = Bosnia–Herzegovina; FYROM = Former Yugoslav Republic of Macedonia.
The incidence of RRT for ESRD across Europe
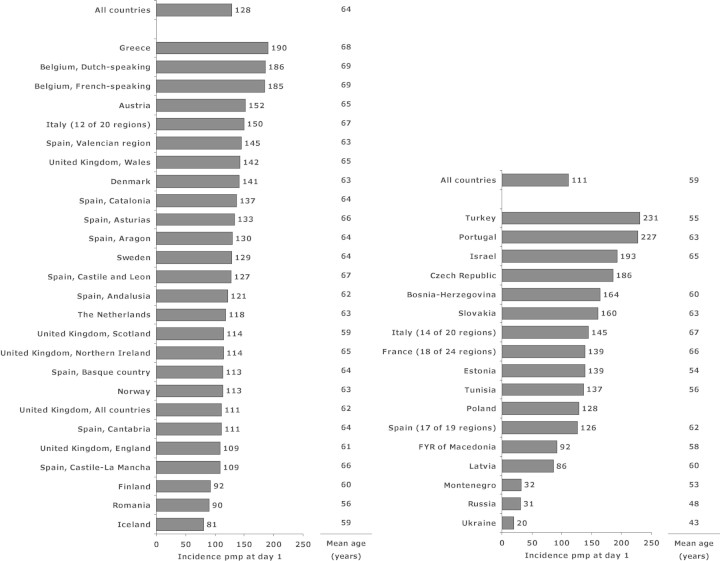
In 2007, the overall incidence rate of RRT for end-stage renal disease (ESRD) among all registries reporting to the ERA-EDTA Registry was 116 per million population (pmp). Figure 2 shows that the highest incidence rates at Day 1 were reported by Turkey (231 pmp), Portugal (227 pmp) and Israel (193 pmp), whereas incidence rates below 100 pmp were reported by Ukraine (20 pmp), Russia (31 pmp), Montenegro (32 pmp), Iceland (81 pmp), Latvia (86 pmp), Romania (90 pmp), Finland (92 pmp) and FYR of Macedonia (92 pmp). The mean age at the start of RRT ranged from 43 years (Ukraine) to 69 years (Belgium) (Figure 2). Table 1 shows the incidence rate of RRT over the period 2003–2007 for countries and regions providing individual patient data, adjusted for age and gender distribution.
Fig. 2.
Incidence of RRT per million population (pmp) and mean age (years) at Day 1 in 2007, unadjusted. Figures include data from renal registries providing individual patient data (left figure) and aggregated data (right figure). Data of Estonia and Tunisia are based on Day 91 of RRT.
Table 1.
Incidence of RRT over the period 2003–2007 per million population (pmp) at Day 1, adjusted for age and gender distribution
| Country /regions | |||||
| providing individual | 2003 | 2004 | 2005 | 2006 | 2007 |
|---|---|---|---|---|---|
| patient data | pmp | pmp | pmp | pmp | pmp |
| Austria | 138 | 156 | 148 | 153 | 146 |
| Belgium, Dutch-speaking | 160 | 163 | 163 | 169 | 161 |
| Belgium, French-speaking | 156 | 179 | 171 | 180 | 178 |
| Denmark | 133 | 131 | 119 | 117 | 136 |
| Finland | 93 | 94 | 92 | 83 | 85 |
| Greece | 168 | 177 | 171 | 172 | 164 |
| Iceland | 83 | 87 | 81 | 79 | 84 |
| Italy, Calabria | 130 | 137 | 127 | 121 | 132 |
| Norway | 97 | 102 | 101 | 101 | 113 |
| Spain, Andalusia | 137 | 138 | 141 | 139 | 125 |
| Spain, Aragon | 87 | 114 | 119 | 93 | 113 |
| Spain, Asturias | 108 | 132 | 101 | 102 | 103 |
| Spain, Basque country | 128 | 112 | 107 | 99 | 98 |
| Spain, Cantabria | 126 | 135 | 142 | 115 | 99 |
| Spain, Castile and Leon | 98 | 100 | 91 | 101 | 99 |
| Spain, Castile-La Mancha | 105 | 113 | 125 | 109 | 102 |
| Spain, Catalonia | 144 | 132 | 141 | 125 | 130 |
| Spain, Valencian region | 148 | 157 | 140 | 144 | 137 |
| Sweden | 113 | 113 | 110 | 117 | 117 |
| The Netherlands | 108 | 110 | 109 | 114 | 117 |
| United Kingdom, England | 73 | 86 | 107 | 111 | 107 |
| United Kingdom, Scotland | 117 | 110 | 119 | 109 | 106 |
| United Kingdom, Wales | 121 | 112 | 122 | 126 | 129 |
| All countries | 111 | 118 | 123 | 124 | 122 |
For the age group 0–19 years at the start of RRT, data were available for a limited number of registries including those of Austria, Denmark, Finland, Greece, Iceland, Norway, Romania, Spain (Andalusia), Spain (Aragon), Spain (Basque country), Spain (Catalonia), Spain (Valencian region), Sweden, The Netherlands, and United Kingdom (Scotland). As numbers of children starting RRT were low, we present averages for 2006–2007 (Table 2). In 2007, the ERA-EDTA Registry started a close collaboration with the ESPN/ERA-EDTA Registry that initiated data collection from paediatric registries across Europe [2]. For an overview of paediatric RRT data collected from those registries, please visit www.espn-reg.org.
Table 2.
Incidence of RRT over the period 2006–2007 per million age-related population (pmarp) per year at Day 1, by age group, unadjusted
| 0–19 | 0–4 | 5–9 | 10–14 | 15–19 | |
|---|---|---|---|---|---|
| Cohort | pmarp | pmarp | pmarp | pmarp | pmarp |
| 2006–2007 | 10 | 8 | 5 | 8 | 16 |
Table 3 shows the incidence rate of RRT by age group, for countries and regions providing individual patient data. For the highest age groups, the highest incidence rates were reported from Belgium and Greece, whereas Finland and Romania belong to the countries reporting the lowest incidence rates.
Table 3.
Incidence of RRT per million age related population (pmarp) at Day 1 in 2007, by age group, unadjusted
| Country/regions | |||||
|---|---|---|---|---|---|
| providing individual | 0–19 | 20–44 | 45–64 | 65–74 | 75+ |
| patient data | pmarp | pmarp | pmarp | pmarp | pmarp |
| Austria | 10 | 41 | 191 | 488 | 551 |
| Belgium, Dutch-speaking | 39 | 171 | 542 | 899 | |
| Belgium, French-speaking | 34 | 209 | 649 | 848 | |
| Denmark | 10 | 51 | 179 | 435 | 524 |
| Finland | 11 | 40 | 132 | 231 | 238 |
| Greece | 9 | 43 | 188 | 536 | 839 |
| Iceland | 11 | 45 | 137 | 163 | 340 |
| Italy (12 of 20 regions) | 7 | 42 | 143 | 406 | 561 |
| Norway | 6 | 42 | 151 | 381 | 416 |
| Romania | 8 | 47 | 161 | 251 | 136 |
| Spain, Andalusia | 9 | 46 | 160 | 442 | 437 |
| Spain, Aragon | 9 | 47 | 136 | 490 | 304 |
| Spain, Asturias | 44 | 141 | 323 | 378 | |
| Spain, Basque country | 3 | 38 | 132 | 340 | 326 |
| Spain, Cantabria | 41 | 145 | 362 | 263 | |
| Spain, Castile and Leon | 34 | 128 | 378 | 358 | |
| Spain, Castile-La Mancha | 31 | 145 | 360 | 369 | |
| Spain, Catalonia | 7 | 44 | 176 | 402 | 523 |
| Spain, Valencian region | 8 | 51 | 187 | 392 | 582 |
| Sweden | 9 | 44 | 156 | 396 | 428 |
| The Netherlands | 10 | 42 | 147 | 393 | 448 |
| United Kingdom, All countries | 55 | 154 | 331 | 334 | |
| United Kingdom, England | 55 | 153 | 325 | 321 | |
| United Kingdom, Northern Ireland | 42 | 141 | 463 | 493 | |
| United Kingdom, Scotland | 15 | 59 | 158 | 278 | 317 |
| United Kingdom, Wales | 54 | 163 | 435 | 491 |
The incidence rates of RRT for ESRD due to diabetes mellitus were highest in Israel (81 pmp), Turkey (64 pmp), and Slovakia (60 pmp), whereas the highest incidence rates of RRT for ESRD due to hypertension/renal vascular disease were reported from Turkey (58 pmp), and Belgium (52 pmp) (Table 4).
Table 4.
Incidence of RRT per million population (pmp) at Day 1 in 2007, by primary renal disease, unadjusted
| Country/regions | HT/ | Unkn/ | ||||
|---|---|---|---|---|---|---|
| providing individual | All | DM | RVD | GN | Other | missing |
| patient data | pmp | pmp | pmp | pmp | pmp | pmp |
| Austria | 152 | 48 | 34 | 16 | 37 | 17 |
| Belgium, Dutch-speaking | 186 | 44 | 52 | 19 | 56 | 16 |
| Belgium, French-speaking | 185 | 42 | 52 | 19 | 64 | 8 |
| Denmark | 141 | 32 | 18 | 15 | 50 | 27 |
| Finland | 92 | 32 | 6 | 11 | 24 | 18 |
| Greece | 190 | 53 | 22 | 16 | 37 | 62 |
| Iceland | 81 | 10 | 35 | 6 | 26 | 3 |
| Italy (12 of 20 regions) | 150 | 30 | 36 | 16 | 35 | 34 |
| Norway | 113 | 15 | 35 | 19 | 40 | 4 |
| Romania | 90 | 11 | 6 | 15 | 30 | 28 |
| Spain, Andalusia | 121 | 27 | 20 | 16 | 33 | 25 |
| Spain, Aragon | 130 | 31 | 24 | 24 | 41 | 11 |
| Spain, Asturias | 133 | 28 | 21 | 10 | 33 | 41 |
| Spain, Basque country | 113 | 17 | 25 | 12 | 42 | 17 |
| Spain, Cantabria | 111 | 19 | 36 | 40 | 12 | 4 |
| Spain, Castile and Leon | 127 | 32 | 22 | 14 | 33 | 26 |
| Spain, Castile-La Mancha | 109 | 33 | 14 | 12 | 30 | 20 |
| Spain, Catalonia | 137 | 28 | 23 | 19 | 32 | 34 |
| Spain, Valencian region | 145 | 25 | 37 | 18 | 33 | 32 |
| Sweden | 129 | 35 | 25 | 16 | 38 | 14 |
| The Netherlands | 118 | 21 | 26 | 11 | 28 | 32 |
| United Kingdom, All countries | 111 | 23 | 12 | 13 | 31 | 32 |
| United Kingdom, England | 109 | 22 | 11 | 12 | 30 | 33 |
| United Kingdom, Northern Ireland | 114 | 26 | 16 | 12 | 44 | 17 |
| United Kingdom, Scotland | 114 | 20 | 13 | 13 | 41 | 27 |
| United Kingdom, Wales | 142 | 36 | 15 | 25 | 32 | 34 |
| Bosnia-Herzegovina | 164 | 33 | 16 | 14 | 70 | 31 |
| Czech Republic | ||||||
| Estonia | ||||||
| France (18 of 24 regions) | 139 | 31 | 36 | 16 | 37 | 19 |
| FYR of Macedonia | 92 | 21 | 24 | 7 | 21 | 19 |
| Israel | 193 | 81 | 19 | 9 | 28 | 57 |
| Italy (14 of 20 regions) | 145 | 29 | 36 | 15 | 33 | 32 |
| Latvia | 86 | 15 | 11 | 11 | 40 | 10 |
| Montenegro | 32 | 18 | 6 | 3 | 5 | |
| Poland | 128 | 32 | 17 | 23 | 38 | 17 |
| Portugal | ||||||
| Russia | 31 | 5 | 2 | 11 | 11 | 2 |
| Slovakia | 160 | 60 | 16 | 13 | 63 | 7 |
| Spain (17 of 19 regions) | 126 | 30 | 22 | 16 | 32 | 26 |
| Tunisia | ||||||
| Turkey | 231 | 64 | 58 | 24 | 41 | 45 |
| Ukraine | 20 | 3 | 1 | 10 | 6 | 1 |
DM: diabetes mellitus; HT: hypertension; RVD: renal vascular disease; GN: glomerulonephritis/sclerosis; others include pyelonephritis, polycystic kidneys, adult type and miscellaneous; Unkn: unknown.
Categories may not add up because of rounding off.
When cells are left empty, (complete) data are unavailable.
The prevalence of RRT for ESRD across Europe
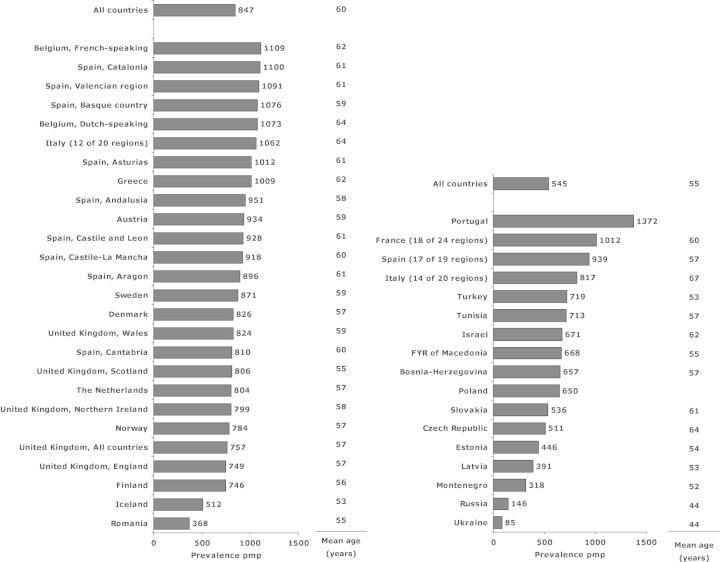
The overall prevalence among all registries reporting to the ERA-EDTA Registry was 662 pmp. Figure 3 shows that the prevalence of RRT pmp at 31 December 2007 was highest in Portugal (1372 pmp), Belgium (French-speaking) (1109 pmp) and Spain (Catalonia) (1100 pmp). The lowest prevalence was reported by Ukraine (85 pmp) and Russia (146 pmp). The mean age at 31 December 2007 ranged from 44 years (Russia and Ukraine) to 64 years (Belgium, Dutch speaking) for registries providing data both on dialysis and transplant patients (Figure 3). Table 5 shows the overall prevalence of RRT, adjusted for age and gender distribution.
Fig. 3.
Prevalence of RRT per million population (pmp) and mean age (years) on 31 December 2007, unadjusted. Figures include data from renal registries providing individual patient data (left figure) and aggregated data (right figure). Data from Czech Republic, Israel, Italy (14 of 20 regions), Slovakia and Tunisia include dialysis patients only, and in Italy (12 of 20 regions) the percentage of missing prevalent RRT patients is estimated at 11%, due to an estimated 25–30% underreporting of patients living on a functioning graft.
Table 5.
Prevalence of RRT on 31 December over the period 2003–2007 per million population (pmp), adjusted for age and gender distribution
| Country/region | |||||
|---|---|---|---|---|---|
| regions providing | 2003 | 2004 | 2005 | 2006 | 2007 |
| individual patient data | pmp | pmp | pmp | pmp | pmp |
| Austria | 794 | 829 | 854 | 875 | 894 |
| Belgium, Dutch-speaking | 848 | 876 | 908 | 939 | 962 |
| Belgium, French-speaking | 929 | 978 | 1010 | 1054 | 1087 |
| Denmark | 730 | 751 | 760 | 768 | 798 |
| Finland | 642 | 659 | 680 | 686 | 699 |
| Greece | 848 | 851 | 872 | 885 | 900 |
| Iceland | 535 | 532 | 527 | 526 | 551 |
| Italy, Calabria | 897 | 906 | 909 | 913 | 928 |
| Norway | 687 | 725 | 743 | 763 | 791 |
| Spain, Andalusia | 939 | 968 | 999 | 996 | 981 |
| Spain, Aragon | 699 | 727 | 755 | 769 | 792 |
| Spain, Asturias | 765 | 814 | 827 | 835 | 837 |
| Spain, Basque country | 872 | 902 | 937 | 948 | 965 |
| Spain, Cantabria | 722 | 746 | 747 | 745 | 736 |
| Spain, Castile and Leon | 742 | 764 | 776 | 784 | 779 |
| Spain, Castile-La Mancha | 865 | 867 | 897 | 900 | 901 |
| Spain, Catalonia | 1007 | 1037 | 1028 | 1028 | 1060 |
| Spain, Valencian region | 1022 | 1058 | 1044 | 1047 | 1050 |
| Sweden | 753 | 772 | 783 | 804 | 816 |
| The Netherlands | 691 | 711 | 736 | 768 | 791 |
| United Kingdom, England | 441 | 538 | 690 | 712 | 742 |
| United Kingdom, Scotland | 707 | 717 | 741 | 759 | 782 |
| United Kingdom, Wales | 658 | 663 | 685 | 710 | 780 |
| All countries | 686 | 733 | 798 | 815 | 834 |
Only a limited number of registries provided complete data for prevalent patients in the age group 0–19 years in 2007, including those of Austria, Denmark, Finland, Greece, Iceland, Norway, Romania, Spain (Andalusia), Spain (Aragon), Spain (Basque country), Spain (Catalonia), Spain (Valencian region), Sweden, The Netherlands and United Kingdom (Scotland). The prevalence for age group 0–19 years is presented in Table 6.
Table 6.
Prevalence of RRT per million age-related population (pmarp) on 31 December 2007, by age group, unadjusted
| 0–19 | 0–4 | 5–9 | 10–14 | 15–19 | |
|---|---|---|---|---|---|
| Year | pmarp | pmarp | pmarp | pmarp | pmarp |
| 2007 | 57 | 19 | 38 | 57 | 108 |
Table 7 shows that for the highest age groups, the highest prevalence was reported by Belgium, Greece, Italy, and several Spanish registries.
Table 7.
Prevalence of RRT per million age related population (pmarp) on 31 December 2007, by age group, unadjusted
| Country/regions | |||||
|---|---|---|---|---|---|
| providing individual | 0–19 | 20–44 | 45–64 | 65–74 | 75+ |
| patient data | pmarp | pmarp | pmarp | pmarp | pmarp |
| Austria | 59 | 461 | 1558 | 2417 | 1829 |
| Belgium, Dutch-speaking | 410 | 1450 | 2709 | 3466 | |
| Belgium, French-speaking | 484 | 1698 | 3072 | 3322 | |
| Denmark | 65 | 562 | 1273 | 1957 | 1662 |
| Finland | 110 | 432 | 1237 | 1559 | 1220 |
| Greece | 50 | 428 | 1395 | 2532 | 2764 |
| Iceland | 68 | 454 | 819 | 1035 | 1303 |
| Italy (12 of 20 regions) | 41 | 402 | 1350 | 2566 | 3024 |
| Norway | 61 | 494 | 1308 | 2054 | 1618 |
| Romania | 21 | 228 | 728 | 825 | 396 |
| Spain, Andalusia | 61 | 509 | 1653 | 2623 | 2213 |
| Spain, Aragon | 30 | 398 | 1394 | 2119 | 1867 |
| Spain, Asturias | 489 | 1404 | 2243 | 1810 | |
| Spain, Basque country | 122 | 501 | 1629 | 2549 | 2032 |
| Spain, Cantabria | 380 | 1340 | 2031 | 1383 | |
| Spain, Castile and Leon | 445 | 1373 | 2024 | 1732 | |
| Spain, Castile-La Mancha | 446 | 1613 | 2542 | 1831 | |
| Spain, Catalonia | 57 | 467 | 1775 | 2967 | 2800 |
| Spain, Valencian region | 58 | 480 | 1705 | 2913 | 2966 |
| Sweden | 66 | 488 | 1439 | 2063 | 1610 |
| The Netherlands | 68 | 484 | 1254 | 2095 | 1731 |
| United Kingdom, All countries | 535 | 1232 | 1809 | 1462 | |
| United Kingdom, England | 526 | 1227 | 1812 | 1436 | |
| United Kingdom, Northern Ireland | 545 | 1294 | 2275 | 2097 | |
| United Kingdom, Scotland | 76 | 620 | 1253 | 1683 | 1259 |
| United Kingdom, Wales | 536 | 1257 | 1754 | 1892 |
Renal transplants
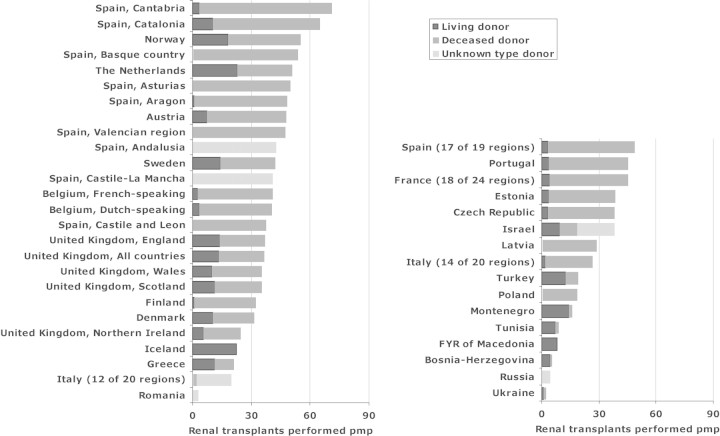
Figure 4 shows that the highest transplant rates were reported from Spain (Cantabria) (71 pmp), Spain (Catalonia) (65 pmp) and Norway (55 pmp). Countries with the highest transplant rates with living donor kidneys included Iceland (23 pmp), The Netherlands (23 pmp) and Norway (18 pmp).
Fig. 4.
Renal transplants performed per million population (pmp) in 2007, by donor type, unadjusted. Figures include data from renal registries providing individual patient data (left figure) and aggregated data (right figure).
Patient and graft survival
Survival analysis used the data from 20 registries in 12 countries that provided individual patient records for the periods 1998–2002 and 2001–2005. Data are presented for all countries and regions together (Table 8 and Figures 5–7). Comparisons of survival by treatment modality were all adjusted for fixed values of age, gender and distribution of PRD. Similar adjustments have been applied to survival comparisons by PRD (please, consult appendix for fixed values and further methodology).
Table 8.
One-, 1- and 5-year survival probabilities, unadjusteda
| Cohort 1998–2002 | Cohort 2001–2005 | ||||
|---|---|---|---|---|---|
| 1 year | 2 years | 5 years | 1 years | 2 years | |
| Patient survival on RRT | 80.9 (80.7–81.2) | 69.3 (69.0–69.5) | 46.1 (46.0–46.3) | 80.9 (80.6–81.1) | 69.5 (69.3–69.7) |
| Patient survival on dialysis | 80.3 (80.0–80.5) | 67.2 (67.0–67.5) | 38.3 (38.2–38.5) | 80.2 (79.9–80.4) | 67.6 (67.3–67.8) |
| Patient survival after first transplant (deceased donor) | 95.6 (95.3–96.0) | 93.7 (93.2–94.1) | 86.6 (86.1–87.2) | 95.6 (95.3–96.0) | 93.7 (93.3–94.0) |
| Patient survival after first transplant (living donor) | 97.7 (97.0–98.1) | 96.9 (96.2–97.5) | 94.0 (93.1–94.7) | 97.4 (96.8–97.9) | 96.6 (96.0–97.1) |
| Graft survival after first transplant (deceased donor) | 90.0 (89.5–90.5) | 87.0 (86.5–87.6) | 77.5 (76.9–78.1) | 90.0 (89.5–90.4) | 87.1 (86.5–87.5) |
| Graft survival after first transplant (living donor) | 94.4 (93.5–95.2) | 92.6 (91.7–93.5) | 86.0 (84.9–87.1) | 93.8 (93.0–94.5) | 92.0 (91.2–92.8) |
aFor analysis methods, see the appendix.
Acknowledgments
The ERA-EDTA Registry is funded by the European Renal Association-European Dialysis and Transplant Association (ERA-EDTA). The ERA-EDTA Registry would like to thank the patients and staff of all the dialysis and transplant units who have contributed data via their national and regional renal registries. In addition, we would like to thank the following persons and organizations for their contribution to the work of the ERA-EDTA Registry. Affiliated registries—Austria: R Kramar and R Oberbauer; Belgium, Dutch-speaking: H Augustijn, B De Moor and J De Meester; Belgium, French-speaking: JM des Grottes and F Collart; Bosnia-Herzegovina: H Resić, E Mešić and A Hukeljic; Czech Republic: I Rychlík, J Potucek and F Lopot; Denmark: J Heaf; Estonia: Ü Pechter, M Luman and M Rosenberg; Finland: P Finne and C Grönhagen-Riska; France (18 of 24 regions): M Lassalle and C Couchoud; FYR of Macedonia: O Stojceva-Taneva and A Sikole; Greece: GA Ioannidis; Iceland: R Palsson; Israel: The Israeli Society for Nephrology and Hypertension and The Israel Center for Disease Control; Italy (7 of 20 regions): P Riegler, F Antonucci, G Cappelli, M Bonomini, F Casino, M Postorino and AM Pinna; Italy (14 of 20 regions): A Limido, A Rustici and M Nichelatti; Latvia: H Cernevskis and V Kuzema; Montenegro: M Ratkovic and S Ivanovic; Norway: T Leivestad; Poland: B Rutkowski, G Korejwo and P Jagodzinski; Portugal: F Macário, E Rocha and J Vinhas; Romania: G Mircescu, L Garneata and E Podgoreanu; Russia: NA Tomilina and BT Bikbov; Slovakia: J Fekete, M Demeš and M Hassan; Spain, Andalusia: P Castro de la Nuez and JM Munoz Terol; Spain, Aragon: Registro de Insuficiencia Renal Crónica en Tratamiento Sustitutivo de Aragón; Spain, Asturias: R Alonso de la Torre, Á Roces and E Sánchez; Spain, Basque country: Á Magaz, J Aranzabal, I Lampreabe and J Arrieta; Spain, Cantabria: J González Cotorruelo and O García Ruíz; Spain, Castile and Leon: AM Olmos and R González; Spain, Castile-La Mancha: G Gutierrez and I Moreno; Spain, Catalonia: E Arcos, J Comas, R Deulofeu and J Twose; Spain, Valencian region: O Zurriaga and M Ferrer; Spain (17 of 19 regions): Spanish RRT National Registry, Spanish Regional Registries and Spanish Society of Nephrology; Sweden: S Schön, KG Prütz, A Seeberger, L Bäckman and B Rippe; The Netherlands: A Hoitsma and A Hemke; Tunisia: C Mahjoubi, H Trimech and F Jarraya; Turkey: K Serdengeçti and G Süleymanlar; Ukraine: M Kolesnyk, G Vladzijevskaya and J Samuseva; United Kingdom, England/Northern Ireland/Wales: D Ansell and C Tomson; United Kingdom, Scotland: W Metcalfe and K Simpson. ERA-EDTA registry Committee Members—GM London, France (ERA-EDTA President); C Wanner, Germany (Newsletter Editor); D Ansell, United Kingdom; C Combe, France; F García López, Spain; R Kramar, Austria; T Leivestad, Norway; A MacLeod, United Kingdom; J Tizard, United Kingdom; and E Verrina, Italy. Other ERA-EDTA Registry Office Staff—AM van den Broek, R Cornet, FW Dekker, MWM van de Luijtgaarden, M Noordzij and KJ van Stralen.
Conflict of interest statement. None declared.
Appendix: statistical methods
To Table 8
Data presented include the survival of incident patients on RRT and of patients receiving a first transplant between 1998–2002 or between 2001–2005 with their 95% confidence intervals. The patients were followed until 31 December 2007. Statistical analysis of unadjusted survival was performed by the Kaplan–Meier method.
For the analysis of patient survival on RRT, the day at the start of RRT was taken as the starting point and the event studied was death. Censored observations were recovery of renal function, loss to follow-up and end of follow-up time.
For the analysis of patient survival on dialysis, the first day on dialysis was the starting point, the event was death and reasons for censoring were recovery of renal function, loss to follow-up, end of follow-up time and renal transplantation.
For the analysis of patient and graft survival after transplantation, the date of the first renal transplantation was defined as the first day of follow-up.
For the patient survival after transplantation, the event studied was death and for the graft survival the events were graft failure and death. Reasons for censoring were loss to follow-up and end of follow-up time.
To Figure 5
Fig. 5.
Survival of incident dialysis patients and of patients receiving a first transplant between 1998–2002, by treatment modality, adjusted for age, gender and primary renal disease.
For the analyses of patient survival on dialysis the starting point was Day 91 on dialysis. Analyses were adjusted for the fixed values of age (60 years), gender (60% men) and primary renal disease (20% diabetes mellitus, 17% hypertension/renal vascular disease, 15% glomerulonephritis and 48% other cause).
For the analyses of patient survival after transplantation, the starting point was the time of the first transplant. The analyses were adjusted for the fixed values of age (45 years), gender (60% men) and primary renal disease (10% diabetes mellitus, 8% hypertension/renal vascular disease, 28% glomerulonephritis and 54% other cause).
To Figures 6 and 7
Fig. 6.
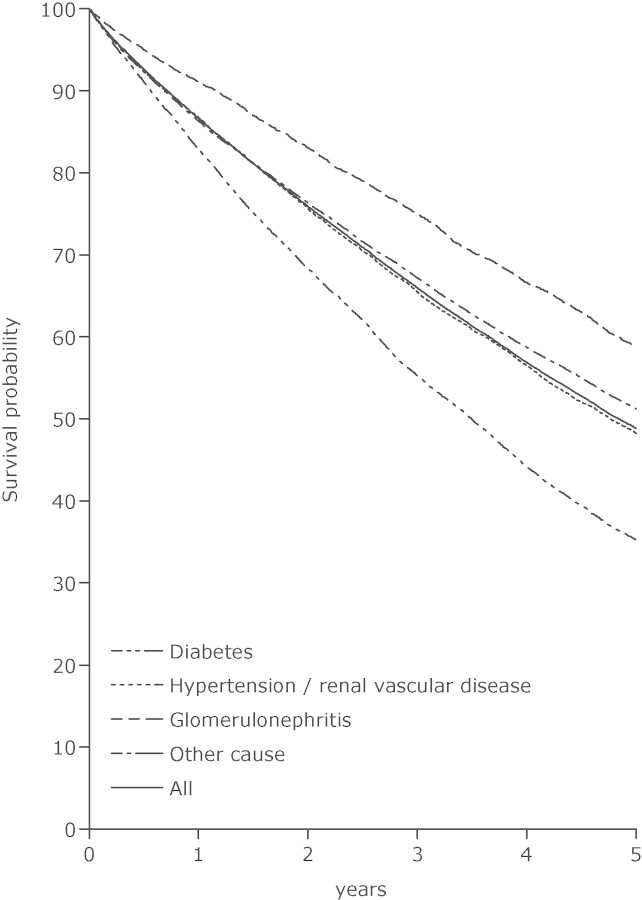
Survival of incident haemodialysis patients in 1998–2002, from Day 91, by primary renal disease, adjusted for age and gender.
Fig. 7.
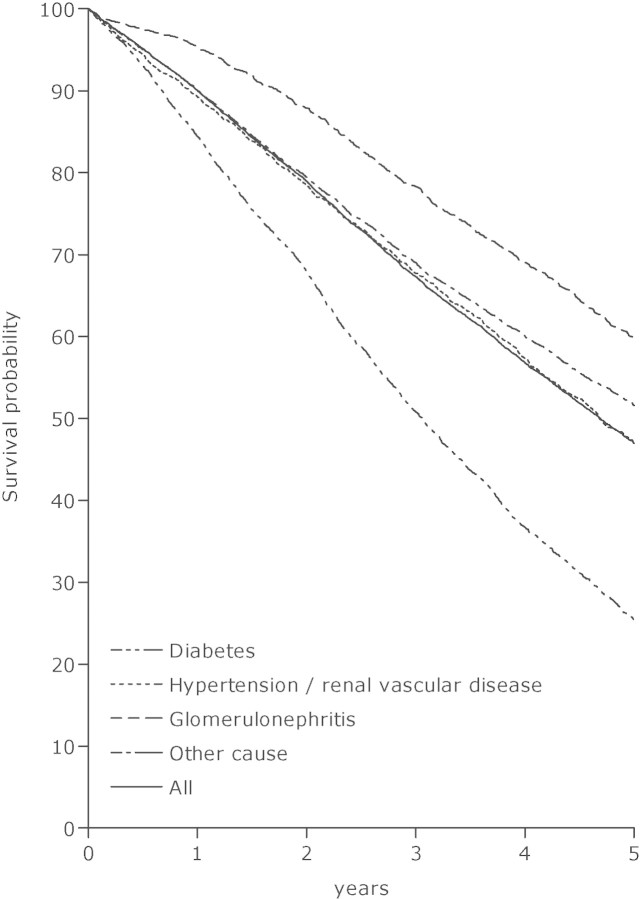
Survival of incident peritoneal dialysis patients in 1998–2002, from Day 91, by primary renal disease, adjusted for age and gender.
For the analyses presented in each figure, the starting point was Day 91 on dialysis. The analyses were adjusted for the fixed values of age (60 years) and gender (60% men).
References
- 1.ERA-EDTA Registry ERA-EDTA Registry Annual Report 2007. Academic Medical Center, Department of Medical Informatics, Amsterdam, The Netherlands, 2009.
- 2.Tizard EJ, Verrina E, van Stralen KJ, et al. Progress with the European Society for Paediatric Nephrology (ESPN)/ERA-EDTA Registry for children with established renal failure (ERF) Nephrol Dial Transplant. 2009 doi: 10.1093/ndt/gfp275. 24: 2615–2617. [DOI] [PMC free article] [PubMed] [Google Scholar]


