

Abstract
Microsatellite (MS) polymorphism is an important source of genetic diversity, providing support for map-based cloning and molecular breeding. We have developed a new database that contains 52 845 polymorphic MS loci between indica and japonica, composed of ample Class II MS markers, and integrated 18 828 MS loci from IRGSP and genetic markers from RGP. Based on genetic marker positions on the rice genome (http://rise.genomics.org.cn/rice2/index.jsp ), we determined the approximate genetic distances of these MS loci and validated 100 randomly selected markers experimentally with 90% success rate. In addition, we recorded polymorphic MS positions in indica cv. 9311 that is the most important paternal parent of the two-line hybrid rice in China. Our database will undoubtedly facilitate the application of MS markers in genetic researches and marker-assisted breeding. The data set is freely available from www.wigs.zju.edu.cn/achievment/polySSR.
Key words: polymorphism, microsatellite or MS, database, whole-genome sequences, rice
1. Introduction
Microsatellites (MSs), or simple sequence repeats (SSRs), are short consecutive repetitive DNA sequence motifs with 1–6 bp in length. The frequency and distribution of MSs have been studied in detail in genomes of bacteria,1 animals,2 and plants.3 MSs have become a valuable source of molecular markers, widely used in genetic diversity analysis4 and positional cloning in rice5,6 because of their ubiquity and polymorphism.7
Starting with screening genomic DNA libraries with MS probes,8,9 many investigators have been involved in generating new MS markers10–12 and integrating them into the rice genetic map.13 However, the desire to have more markers is still strong, since the amount and their density over rice genomes are not sufficient for satisfying the need of geneticists and breeders.
It is fortunate that Beijing Genomics Institute14 (BGI) and the International Rice Genome Sequencing Project15 have released their rice genomic data that provide comparative basis for a thorough analysis on MS between indica and japonica subspecies. Although such a survey has been done recently for chromosome 4 without eliminating MSs with multiple copies,16 the report focused on MSs in japonica rice cv. Nipponbare, mainly composed of DNRs, TNRs, and TTRs. In this study, we emphasize our newly discovered MS makers through a comparative analysis on MSs between the indica and japonica genome sequences, and have developed a genome-wide MS polymorphism database that have markers indexed in both rice genomes to facilitate molecular studies and marker-assisted breeding practice.
2. Materials and methods
2.1. Rice genome sequences and MS screening
The genome sequences for indica (Oryza sativa ssp. indica cv. 9311) and japonica (O. sativa ssp. japonica cv. Nipponbare) (Version build4) were downloaded from http://rise.genomics.org.cn/rice2/index.jsp17 and http://rgp.dna.affrc.go.jp15 respectively. The 5′-UTR, coding, intronic, 3′-UTR, and intergenic regions were determined based on their original annotations. An MS motif scanning tool, SSRIT11 written in Perl was downloaded from Cornell University (http://www.gramene.org/) and modified to search for perfect MS repeats in the two rice genome sequences, including mono-nucleotide repeats (MNRs), di-nucleotide repeats (DNRs), tri-nucleotide repeats (TNRs), tetra-nucleotide repeats (TTRs), penta-nucleotide repeats (PNRs), and hexa-nucleotide repeats (HNRs) with numbers of repeat units of 10, 7, 6, 5, 4 and 4, respectively. Some of these MS sequences were combined into one repeat complex if the lengths between two adjacent units were less than 20 bp.
2.2. MS Polymorphism and primer design
An MS locus is defined as a tract of genomic sequences that include a perfect repeat motif and two unique 160-bp flanking sequences on each sides of the repeat. These MS candidate sequences were aligned to their source genome sequences with BLASTN (E-value cutoff of 1e-40); those with unique hit were selected as candidate MS loci together with their specific flanking sequences. The selected MS sequences were then used as queries against another genome without filtering low complexity sequences. We wrote a Perl script (Supplementary script: polymorphism.pl) to determine the presence of polymorphisms among MS motifs between indica and japonica. Primers pairs were automatically designed on the basis of unique flanking sequences aided by Primer318 with its default parameters. Candidate primer sequences were subsequently filtered through following parameters: length range from 18 to 24 bp, devoid of consecutive tracts of single nucleotide, GC content around 50% with a theoretical Tm approximately 60°C, and perfect ending with G- or C-rich at the 3′ end.
2.3. Experimental validation
One hundred primer pairs covering all rice chromosomes and covering all MS types were used for our validation experiment. The DNA templates used in this experiment are O. sativa ssp. indica cv. 9311 and O. sativa ssp. japonica cv. Nipponbare grown in a green house. Genomic DNA was extracted from 1-week-old seedlings, using the CTAB method.19 The quality of DNA was evaluated electrophoretically with 0.8% agarose gel.
Oligonucleotide primers were made by Shanghai DNA Biotechnologies Co., Ltd. PCR was performed in 25 µl reactions containing 3.0 µl buffer, 2.5 µl MgCl2 (25 mM), 2.0 µl dNTP (2.5 mM), 0.5 µl Taq polymerase (5 U/µl), 3.0 µl template DNA (10 ng/µl), 13 µl ddH2O, 0.1 µg primers. A PTC-100TM thermal cycler (MJ Research Inc. Incline Village, NV, USA) was used along with the following PCR profile settings: 2 min at 96°C, 35 cycles of 40 s at 95°C, 30 s at 61°C, 1 min 30 s at 72°C, and a final extension at 72°C for 10 min. PCR products were electrophoresed on 1.0% agarose gel containing ethidium bromide. Montage TM PCR96 Cleanup Kits were used to purify PCR products before being sequenced with an ABI 377 DNA sequencer.
3. Results and discussion
3.1. MS identification and distribution in the indica and japonica genomes
We identified 102 706 and 102 423 candidate MSs in the indica and japonica genomes, respectively, and the average distances between the repeat units are shorter in the indica genome (3.6 kb) than in the japonica (3.7 kb) genome. These candidate MSs reside largely within intergenic regions (58 094 or 56.6% for the indica and 58 812 or 57.4% for the japonica), as compared to those in intronic regions (20 868 or 20.3% in the indica and 19 631 or 19.2% for the japonica) (Table 1). However, the average MS lengths in the indica and japonica genomes were found similar, from 17.4 bp to 17.8 bp. The fractions of MSs with unique flanking sequences in the indica and japonica are 67.1% and 72.5%, respectively. We also found that one-third of the total MSs are polymorphic and that the number of MS with unique flanking sequences was slightly lower in the indica (68 895) than in the japonica (74 227), but the number of MS sequences with polymorphisms and their average lengths were nearly the same between the two subspecies (Table 1). It implies that the number of MS with polymorphisms and the average length of polymorphic SSRs are independent parameters in the two rice subspecies. MS loci most likely to be useful as genetic markers are those that are single copy in both genomes and polymorphic when the genomes are compared.
Table 1.
Frequency and polymorphism of MSs in different genomic regions of indica and japonica genomes
| Genome region | Alla | Wsfsb | Wpmc | Rate of pmd (%) | |||||||
|---|---|---|---|---|---|---|---|---|---|---|---|
| Count | Interval (kbp) | Lengthe | GC (%) | Count | Interval (kbp) | Perf (%) | Count | Interval (kbp) | Perg (%) | ||
| Indica | |||||||||||
| 5′-UTR | 12 411 | 2.1 | 17.4 | 40.1 | 9324 | 2.8 | 75.1 | 4613 | 5.6 | 37.2 | 49.5 |
| CDS | 5406 | 8.1 | 20.8 | 81.4 | 4217 | 10.4 | 78 | 1162 | 37.6 | 21.5 | 27.6 |
| Intron | 20 868 | 2.9 | 15.7 | 21.5 | 15 670 | 3.8 | 75.1 | 8551 | 7 | 41 | 54.6 |
| 3′-UTR | 5927 | 3.2 | 16.6 | 20.1 | 4338 | 4.4 | 73.2 | 2312 | 8.3 | 39 | 53.3 |
| Intergenic | 58 094 | 3.9 | 17.8 | 19.9 | 35 346 | 6.4 | 60.8 | 19 053 | 11.8 | 32.8 | 53.9 |
| Total | 102 706 | 3.6 | 17.4 | 26.5 | 68 895 | 5.4 | 67.1 | 35 691 | 10.5 | 34.8 | 51.8 |
| Japonica | |||||||||||
| 5′-UTR | 12 569 | 2 | 17.6 | 42.0 | 10 462 | 2.4 | 83.2 | 4871 | 5.1 | 38.8 | 46.6 |
| CDS | 5685 | 7.7 | 20.6 | 81.4 | 4854 | 9 | 85.4 | 1249 | 35 | 22 | 25.7 |
| Intron | 19 631 | 2.9 | 15.7 | 22.2 | 16 316 | 3.5 | 83.1 | 8281 | 6.9 | 42.2 | 50.8 |
| 3′-UTR | 5726 | 3.2 | 16.7 | 20.8 | 4647 | 3.9 | 81.2 | 2321 | 7.9 | 40.5 | 49.9 |
| Intergenic | 58 812 | 4 | 18.5 | 21.1 | 37 948 | 6.3 | 64.5 | 19 057 | 12.5 | 32.4 | 50.2 |
| Total | 102 423 | 3.7 | 17.8 | 27.7 | 74 227 | 5.1 | 72.5 | 35 779 | 10.7 | 34.9 | 48.2 |
aAll MSs in the genomes.
bMSs with unique flanking sequences.
cMSs with polymorphisms.
dRate of MS Wpm in MS Wsfs.
eAverage length of MSs expressed in base pairs (bp).
fPercent of MSs with unique flanking sequences against all.
gPercent of MSs with polymorphisms against all.
3.2. MS polymorphisms in different genomic regions
We have noticed that the average MS length and distance between candidate MS loci within coding regions of the two subspecies were slightly different. The indica genome has an average MS length of 20.8 bp and an average distance between candidate MS loci of 8.1 kb; the corresponding numbers in the japonica genome are 20.6 bp and 7.7 kb, respectively. In the regions other than the coding sequences, the average MS length and the average distance between candidate MS loci become 2.1–3.9 bp and 2.0–4.0 kb, respectively, although MS sequences are most abundant in 5′-UTR, followed in an order of intronic, 3′-UTR, intergenic, and coding regions. The trend was found consistent with previous reports in Arabidopsis and rice.3,20,21 In addition, GC contents of MS in other regions (19.9–40.1 and 20.8–42.0) are far lower than that of coding regions that are 81.4% and 81.4 % for the indica and japonica, respectively.
We also looked into details of MSs and their unique flanking sequences among different regions in the indica genome and found that there are higher numbers of MSs with unique flanking sequences in intergenic, intronic, and 5′-UTR regions, and the trend is similar in japonica. MSs with both polymorphism and unique flanking sequences vary in different genomic regions, there are as low as 21.5 and 22% in coding regions in the indica and japonica genomes, respectively, whereas there is up to 40% observed in the intronic region (Table 1). We concluded that MSs within intronic regions are most polymorphic, and followed by UTR, intergenic, and coding regions.
3.3. Polymorphisms and distribution of different MS repeat types
In our collection, there are 62.5% MNRs, 17.2% DNRs, and 10.6% TNRs, which form the rice genome sequences; these repeat types are collectively over 90% of the total MS sequences. The distributions of these MS types are rather similar between indica and japonica in general. TNRs were predominately found in coding regions (87.5% for indica and 87.6% for japonica, respectively). MNRs and DNRs are highly dispersed in intronic, 3′-UTR, intergenic, and 5′-UTR regions (Fig. 1A). The distribution of polymorphic MS loci is similar among all types, except the percentage of TNRs in various genomic regions varies significantly (Fig. 1B). With respect to the polymorphism rate (the ratio between MSs with polymorphism and the total) and those with unique flanking sequences, we found that MNRs and DNRs are better than TNRs in all genomic regions (Fig. 1C). The polymorphism rate of TTRs, PNRs, and HNRs varies from 32 to 40% (data not shown), and they may provide additional sources for molecular makers when called upon.
Figure 1.
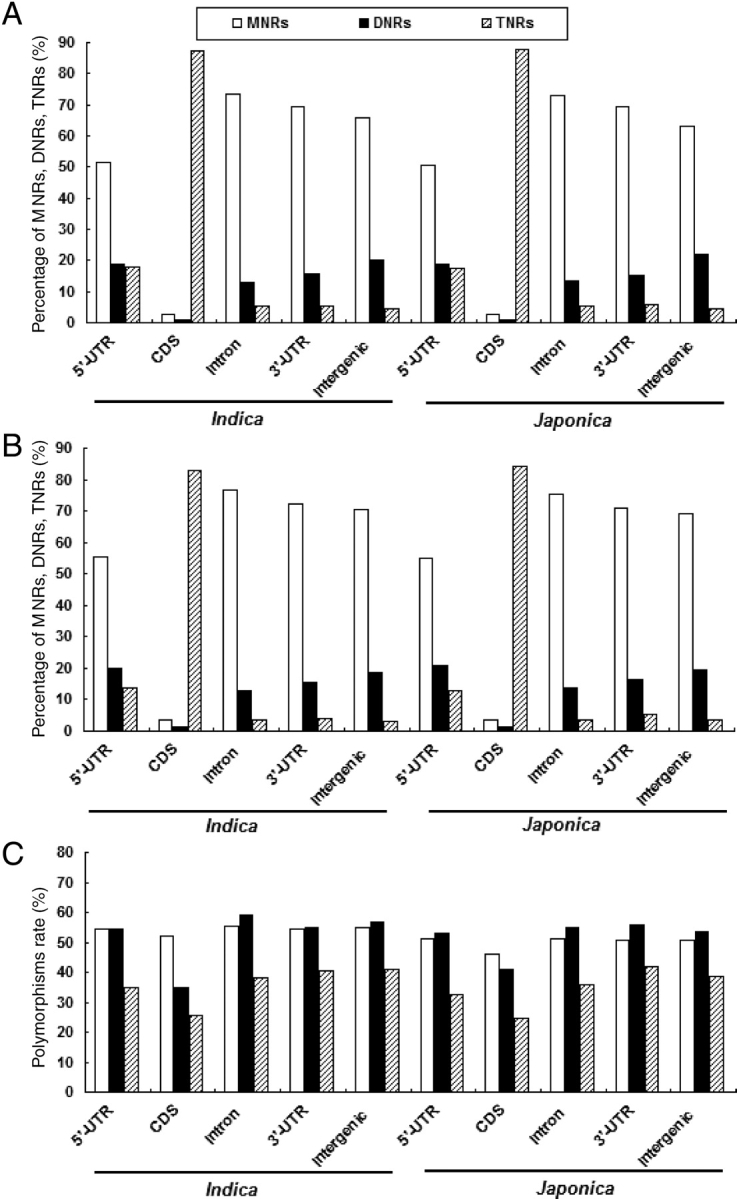
Percentages and polymorphic rates of MNR, DNR, and TNR in different regions of the two rice genomes. (A) Percentages of MNR, DNR, and TNR in the overall MS. (B) Percentages of MNR, DNR, and TNR with polymorphisms. (C) Polymorphic rates of MNR, DNR, and TNR.
3.4. Polymorphisms of the candidate MS loci with different repeat units
The number of A/T repeats is 8.5 and 6.8 times of all repeat types in the indica and japonica genomes, respectively; it is 7.5 and 6.6 times more polymorphic than C/G repeats. The average MS length (13.8 bp in the indica and 13.6 bp in the japonica) and the average length of MSs with polymorphisms (14.4 bp in indica and 14.1 bp in japonica) in C/G repeats are slightly longer than those of A/T repeats (10.8–11.2 bp). The polymorphism rate of C/G MNR class of SSR is slightly higher (68.6% for indica and 61.3% for japonica) than that of A/T MNRs (53.5% for indica and 49.6% for japonica). Therefore, when targeting MNRs as the basis for developing genetic markers, the C/G repeat class is likely to be more useful, at least when comparing indica and japonica genotypes. Among DNRs, both AG/CT (59.8–56.4%) and AT/TA (>50%) repeats are more polymorphic than CG/GC repeats (15.6%). AT/TA repeats in the indica and japonica assemblies have a longer average length (>30 bp) than AG/CT repeats (22.6–22.5 bp; Table 2). The polymorphism rate of GC-rich TNRs is relatively lower than that of GC-poor TNRs, despite the fact that CCG/CGG repeats are the most abundant, contributing more than 40% to the total TNRs. The GC-poor repeats, such as AAT/ATT, AAG/CTT, and ACT/AGT, have polymorphic rates greater than 40% (Table 2). Another example is AGG/CCT that contributes to 15% of the total TNRs but the polymorphic rate of AGG/CCT repeats is relatively low, 35.5% for indica and 31.7% for japonica. The numbers of polymorphic ATC/GCT, AAC/GTT, and ACT/AGT repeats are scarce. Among TTRs, AGAT/ATCT, AAAT/ATTT, AAAG/CTTT, ACAT/ATGT, AGCT/AGCT, and AATT/AATT are quite dominant, and the two kinds of TTR (ACAT/ATGT and AGAT/ATCT) have longer average lengths and higher polymorphism rates. Among PNRs, AAAAG/CTTTT, AAAAT/ATTTT, AGAGG/CCTCT, and AGGGG/CCCCT are rather dominant, AGAGG/CCTCT is more polymorphic, 24.8% in indica and 31.7% in japonica; all other kinds of PNR have much lower polymorphic rates (data not shown).
Table 2.
Polymorphism distribution of MS motifs in indica and japonica genomes
| Motifs | Indica | Rate of pm | Japonica | Rate of pm | ||||||
|---|---|---|---|---|---|---|---|---|---|---|
| All | Wpm | All | Wpm | |||||||
| Count | Length | Count | Length | Count | Length | Count | Length | |||
| A/T | 57 467 | 10.9 | 21 393 | 11.2 | 53.5 | 53 940 | 10.8 | 20 637 | 11.1 | 49.6 |
| C/G | 6710 | 13.8 | 2849 | 14.4 | 68.6 | 7923 | 13.6 | 3104 | 14.1 | 61.3 |
| AC/GT | 1405 | 18.2 | 541 | 19.6 | 54.4 | 1318 | 18.1 | 560 | 19.4 | 52.5 |
| AG/CT | 8371 | 20.1 | 3220 | 22.6 | 59.8 | 8664 | 19.7 | 3351 | 22.5 | 56.4 |
| AT/AT | 7271 | 34.5 | 2147 | 36.8 | 56.6 | 8041 | 35.9 | 2287 | 38.1 | 54.4 |
| CG/CG | 668 | 14.8 | 59 | 15.7 | 15.6 | 755 | 14.7 | 64 | 15.5 | 15.6 |
| AAC/GTT | 186 | 24.5 | 45 | 30.7 | 37.8 | 185 | 22.7 | 57 | 25.2 | 41.6 |
| AAG/CTT | 892 | 25.1 | 304 | 29.0 | 46.5 | 863 | 26.0 | 305 | 30.1 | 41.8 |
| AAT/ATT | 683 | 45.0 | 248 | 51.7 | 55.6 | 671 | 49.5 | 253 | 59.5 | 49.6 |
| ACC/GGT | 603 | 20.1 | 111 | 21.3 | 23.8 | 632 | 20.1 | 120 | 21.7 | 22.2 |
| ACG/CGT | 832 | 19.7 | 117 | 21.6 | 20.8 | 942 | 19.5 | 122 | 20.6 | 19.5 |
| ACT/AGT | 151 | 22.2 | 44 | 24.8 | 40.7 | 139 | 22.2 | 57 | 24.9 | 44.5 |
| AGC/GCT | 958 | 19.7 | 216 | 20.9 | 31.3 | 999 | 19.9 | 264 | 20.7 | 33.2 |
| AGG/CCT | 1540 | 20.6 | 424 | 22.1 | 35.5 | 1557 | 20.5 | 415 | 21.8 | 31.7 |
| ATC/GAT | 310 | 22.2 | 70 | 22.7 | 37.8 | 303 | 21.6 | 74 | 22.4 | 37.0 |
| CCG/CGG | 4734 | 19.7 | 999 | 21.2 | 28.0 | 5009 | 19.6 | 1087 | 20.8 | 26.6 |
Labels are the same as in Table 1.
We detected 35 691 polymorphic MS loci with unique flanking sequences in the indica genome and 35 779 in the japonica genome (Table 3). If we took away 18 016 loci common for both, there were 53 454 subspecific MS loci left, and we were able to design primer pairs for 52 845 MSs (Table 3), which gave rise to one polymorphic MS for every 7.1 and 7.2 kb in lengths in indica and japonica, respectively. Of these MSs, there were 36 374 MNRs, 8298 DNRs, 3878 TNRs, 802 TTRs, 683 PNRs, 487 HNRs, and 2323 complex repeats that comprised two or more repeat units (Table 3). We also analyzed the length polymorphism of MSs in indica and japonica sequences (Fig. 2), and found that approximately 38% of MSs have a length difference of 1 bp. Only about 8% of MSs have a length polymorphism of more than 10 bp, and the number of MSs with polymorphism length of 5 and 7 bp is relatively small (Fig. 2), since the length polymorphism is related to the length of the repeat units or types.
Table 3.
Summary of polymorphic MS loci
| MNR | DNR | TNR | TTR | PNR | HNR | Complex | Total | ||
|---|---|---|---|---|---|---|---|---|---|
| (1) | Indica MS | 24 242 | 5967 | 2578 | 477 | 394 | 281 | 1752 | 35 691 |
| (2) | Japonica MS | 23 741 | 6262 | 2754 | 562 | 451 | 275 | 1734 | 35 779 |
| (3) | Common MS | 11 378 | 3658 | 1413 | 231 | 156 | 53 | 1127 | 18 016 |
| (4) | Theoretical estimates of polymorphic MS | 36 605 | 8571 | 3919 | 808 | 689 | 503 | 2359 | 53 454 |
| (5) | Observed values of polymorphic MS | 36 555 | 8546 | 3942 | 803 | 688 | 503 | 2417 | 53 454 |
| (6) | MS with primers | 36 374 | 8298 | 3878 | 802 | 683 | 487 | 2323 | 52 845 |
(1) The identified polymorphic MS loci in indica; (2) The identified polymorphic MS loci in japonica; (3) The common polymorphic MS loci that are found to be the same in both indica and japonica; (4) The theoretical estimates of all polymorphic MS loci in rice that can be estimated according to the following formula polymorphic MS = (1) + (2) − (3); (5) Observed values of all polymorphic MS loci in rice. The data discrepancies between (4) and (5) are due in part to the fact that some MS in indica belong to MNR or DNR, also some MS in japonica can be changed into the Complex kinds; (6) MS with primers: polymorphic MS loci with primers that were designed successfully with Primer3 (http://www.genome.wi.mit.edu/cgi-bin/primer/primer3).
Figure 2.

Length distribution of polymorphic MSs in indica and japonica rice genomes.
3.5. Development of the polymorphic MS database for rice subspecies
A total of 18 828 SSR markers have been recently reported based on sequence analysis of the japonica cv. Nipponbare genome,15 and 2240 of the total were experimentally confirmed.13 Since some of the markers between the two genomes may not be polymorphic and their physical positions may not be unique, we may not be able to include all of them in our database. Although some MS polymorphisms in chromosome 4 between the indica and japonica have been reported,16 it was limited to a single chromosome without eliminating multiple-hitting copies. In addition, previous works have mainly focused on Class I MSs, such as DNRs, TNRs, and TTRs, whereas Class II MSs, including MNRs, PNRs, and HNRs have not drawn enough attention for marker development.
By comparing MS sequences between the sequenced indica and japonica genomes, we developed a new database for 52 845 (Table 3) polymorphic MS loci with specific flanking sequences, including polymorphic ample Class II MSs. To avoid confusion in MS naming convention used by the rice community, we integrated 18 828 MSs published by IRGSP15 into our collection, and the same loci are cross-referenced (6294 MSs from IRGSP). However, 6641 MSs were excluded because they have multiple copies in the rice genome. Some 3988 MSs were found lack of polymorphism between the indica and japonica genomes, and 1905 MSs were not mapped due to the absence of reciprocal polymorphic sequences between the two genomes. Only 4509 Class I polymorphic MS loci were detected in the indica genome (Table 4), 1775 (6284 − 4509) loci were missed because the length of their repeat motif was less than 20 bp and do not satisfy the criteria of Class I in indica, although they were Class I loci in japonica. These 1775 shorter MS alleles in indica may not represent any technical or biological anomalies but simply happened by chance since MSs are in general short in length. In addition, we also mapped the genetic markers consisting of mostly RFLPs from RGP (http://rgp.dna.affrc.go.jp) on the indica (from http://rise.genomics.org.cn), IRGSP, and TIGR pseudomolecules in silico. Although there is a misunderstanding about the BGI's sequence assemblies, the indica pseudomolecules are believed as useful as the BAC-to-BAC assembly when evaluated carefully according to scientific rationales.22
Table 4.
Comparative analysis of MSs identified in indica with different cutoffs
| Class I | Class II | |||||||||||
|---|---|---|---|---|---|---|---|---|---|---|---|---|
| All count | Wsfs | Wpm | Rate of pm | All count | Wsfs | Wpm | Rate of pm | |||||
| Count | Perf | Count | Perg | Count | Perf | Count | Perg | |||||
| MNRs | 789 | 641 | 81.2 | 417 | 52.9 | 65.1 | 61 074 | 45 996 | 75.3 | 23 324 | 38.2 | 50.7 |
| DNRs | 6753 | 4071 | 60.3 | 2747 | 40.7 | 67.5 | 16 947 | 9654 | 57.0 | 3825 | 22.6 | 39.6 |
| TNRs | 3763 | 2770 | 73.6 | 1345 | 35.7 | 48.6 | 54 824 | 33 480 | 61.1 | 2638 | 4.8 | 7.9 |
Class I: MNRs with 20, DNRs with 10, and TNRs with seven repeat units; Class II: MNRs with 10 repeat units, DNRs with seven, and TNRs with six repeat units. The rest of the labels are the same as in Table 1.
3.6. Classes of complex MS, such as MNRs, PNRs, and HNRs, could be used as genetic markers in the future
At present, only some of the MSs, such as DNRs, TNRs, and TTRs, are used as genetic markers for rice, and other types have been largely ignored, perhaps due to the lack of adequate experimental methods, such as in the case of MNRs, although they are accounted for more than 60% of all MSs and approximately half of them are believed polymorphic. In this report, we validated a few MNRs (such as P005 and P010 in Fig. 3), proving their usefulness, and a recent report in typing method23 also suggested a new opportunity for the MNR application as genetic markers for rice. Although PNRs and HNRs have been previously used as molecular markers in sorghum and cotton,24,25 they have not been developed for rice. We found many polymorphic PNRs and HNRs with polymorphisms in the rice genome, and verified some of them experimentally, including eight PNRs, five HNRs, and four complex MSs. We believe that they should be used as genetic markers in rice in the future. It is important to note that polymorphisms found between 9311 and Nipponbare may not be generalized to other indica and japonica genomes, and additional sequence and genotyping information from diverse cultivars will broaden our understanding of SSR polymorphism in O. sativa.
Figure 3.

Experimental validation (PCR) of polymorphic MSs. Left lanes show PCR products from indica cv. 9311, and right lanes are samples from japonica cv. Nipponbare. MS involved MNR (P005, P010), DNR (P041, P031, P050, P043, P009, P039, P026, P040, P025, P024, P027), TNR (P055, P058, P062), TTR (P077), and other complex MS (P008, P095, P097, P100). Four PCR products for 9311 (P025, P026, P058, P062) and two for Nipponbare (P025, P058) showed complex band patterns and seven products (P008, P010, P025, P050, P055, P058, P062) appeared polymorphic.
Comparison of MSs identified in indica were made with different cut-off values. MS polymorphisms have two basic parameters, types of the repeat units and numbers of units. By adjusting cut-off values for the number of repeat units toward a lower boundary, we discovered more polymorphic MS loci that are both highly polymorphic and can be uniquely identified in the genomes. We did try to define Class 1 MS by using a standard protocol, but only detected 417 MNRs, 2747 DNRs, and 1345 TNRs in the indica genome assembly. In this report, we found that when the MNR length reaches 10 bp, the polymorphism numbers increases up to 23 324 for MNR with a length of 10 bp, 3825 for DNR with a length of 7 bp, and 2638 for TNR with a length of 6 bp (Table 3). It was evident that polymorphism counts of most Class II MNRs, DNRs, and TNRs are far higher than those of many Class I MS; the result suggests that different numbers of repeat units should be used for screening different MS types as genetic markers, such as 10 for MNRs, 7 for DNRs, 7 for TNRs, 6 for TTRs, 5 for PNRs, and 5 for HNRs.
Most MS repeats have unique flanking sequences (62.1% for indica and 73.1% for japonica in our study), and MSs may be preferentially associated with non-repetitive regions in rice genome as reported by Morgante et al.3 except for AT/TA and AAT/ATT repeats.3,10,11 Furthermore, the fraction of MSs with unique flanking sequences in the indica is about 10% lower than that in the japonica, suggesting that there may be more repetitive sequences assembled in the indica genome when compared with the japonica genome. It was reported previously that MS polymorphism is positively correlated with their length,4,12 and the distribution of GC-rich DNRs and TNRs have a bias toward exons where polymorphisms occur scarcely.3,11,17,21 We also found in our current study that the degree of the polymorphisms in MSs depends on their genomic locations and the repeat types. For instance, higher polymorphism rates were found within intronic and UTR regions, whereas the lowest within coding regions. The relationship between GC content and MS polymorphism is unclear. For instance, A/T-containing MNRs have a slightly lower polymorphism rate than the G/C containing repeats. The opposite seems true in DNRs, where AG/CG repeats have higher polymorphism rates of 52–60%, than those in CG/GC repeats (15–16%). Similarly, CCG/CGG repeats contributing almost half of the total TNRs have a polymorphism rate of less than 30%, whereas AAT/ATT AAG/CTT and ACT/AGT have polymorphism rates of greater than 40%. Our results are in agreement to previous observations.4,12 The suggested reason was that GC-rich regions are relatively stable and resulted in less replication slippage.26
3.7. Experimental validation of 100 polymorphic MS loci
To validate our results, we chose 100 polymorphic MSs randomly for validation, using genomic DNA from indica cv. 9311 and japonica cv. Nipponbare as PCR templates. The PCR products were sequenced, and the result is summarized in Table 5 (other detailed information was summarized in Supplementary Table 1). We have 98 polymorphic MSs PCR-amplified in the two cultivars, and four of them worked for 9311 (P025, P026, P058, and P062 in Fig. 3) and two for Nipponbare (P025 and P058), showing complex banding patterns that were perhaps due to lack of sequence specificity in the genomic DNA sample. Sequencing results confirmed 91 PCR products to be polymorphic, and seven (P008, P010, P025, P050, P055, P058, and P062) of the remaining PCR products that failed in sequencing appeared polymorphic based on the existence of multiple DNA bands on agarose gels. Only one (P055) showed unexpected products with a length less than 150 bp. In addition, the sequences amplified with six primer pairs (P060, P016, P037, P087, P020, and P030 in Supplementary Table 1) appeared inconsistent with the expected genomic sequences. This could be explained by the fact that the low-complexity sequences were difficult to be sequenced and relatively error-prone. We concluded that our new MS collection contains at least 90% valid polymorphic MS markers.
Table 5.
Summary of PCR amplification and sequencing in indica and japonica genomes
| MS type | Total No. | 9311 | Nipponbare | No. both sequenced | ||
|---|---|---|---|---|---|---|
| No. of amplified | No. of sequenced | No. of amplified | No. of sequenced | |||
| MNRs | 12 | 12 | 10 | 12 | 11 | 10 |
| DNRs | 37 | 35 (1) | 34 | 36 (1) | 36 | 34 |
| TNRs | 23 | 23 (2) | 22 | 23 (1) | 19 | 19 |
| TTRs | 7 | 7 | 7 | 7 | 7 | 7 |
| PNRs | 8 | 8 | 8 | 8 | 8 | 8 |
| HNRs | 5 | 5 | 5 | 5 | 5 | 5 |
| Complex | 8 | 8 | 8 | 8 | 8 | 8 |
| Total | 100 | 98 | 94 | 99 | 94 | 91 |
Numbers in parentheses are the number of products with complex band pattern.
Acknowledgements
This work was supported by National Natural Science Foundation of China (No. 30571146), the Key Research Project of Zhejiang Province (No. 2003C22007), and Rice Project of Zhejiang Province (04-06).
Supplementary data
Supplementary data are available online at www.dnaresearch.oxfordjournals.org.
References
- 1.Gur-Arie R., Cohen C. J., Eitan Y., Shelef L., Hallerman E. M., Kashi Y. Simple sequence repeats in Escherichia coli: abundance, distribution, composition, and polymorphism. Genome Res. 2000;10:62–71. [PMC free article] [PubMed] [Google Scholar]
- 2.Elgar G., Clark M. S., Meek S., et al. Generation and analysis of 25 Mb of genomic DNA from the pufferfish Fugu rubripes by sequence scanning. Genome Res. 1999;9:960–971. doi: 10.1101/gr.9.10.960. [DOI] [PMC free article] [PubMed] [Google Scholar]
- 3.Morgante M., Hanafey M., Powell W. Microsatellites are preferentially associated with nonrepetitive DNA in plant genomes. Nat. Genet. 2002;30:194–200. doi: 10.1038/ng822. [DOI] [PubMed] [Google Scholar]
- 4.Cho Y. G., Ishii T., Temnykh S., et al. Diversity of microsatellites derived from genomic libraries and GenBank sequences in rice (Oryza sativa L.) Theor. Appl. Genet. 2000;100:713–722. [Google Scholar]
- 5.Xiao J., Li J., Grandillo S., Ahn S. N., Yuan L., Tanksley S. D., McCouch S. R. Identification of trait-improving quantitative trait loci alleles from a wild rice relative. Oryza rufipogon, Genetics. 1998;150:899–909. doi: 10.1093/genetics/150.2.899. [DOI] [PMC free article] [PubMed] [Google Scholar]
- 6.Zou J. H., Pan X. B., Chen Z. X., et al. Mapping quantitative trait loci controlling sheath blight resistance into rice cultivars (Oryza sativa L.) Theor. Appl. Genet. 2000;101:569–573. [Google Scholar]
- 7.Tautz D. Hypervariability of simple sequences as a general source for polymorphic DNA markers. Nucleic Acids Res. 1989;17:6463–6471. doi: 10.1093/nar/17.16.6463. [DOI] [PMC free article] [PubMed] [Google Scholar]
- 8.Panaud O., Chen X., McCouch S. R. Development of microsatellite markers and characterization of simple sequence length polymorphism (SSLP) in rice (Oryza sativa L.) Mol. Gen. Genet. 1996;252:597–607. doi: 10.1007/BF02172406. [DOI] [PubMed] [Google Scholar]
- 9.Wu K. S., Tanksley S. D. Abundance, polymorphism and genetic mapping of microsatellites in rice. Mol. Gen. Genet. 1993;241:225–235. doi: 10.1007/BF00280220. [DOI] [PubMed] [Google Scholar]
- 10.Akagi H., Yokozeki Y., Inagaki A., Fujimura T. Microsatellite DNA markers for rice chromosomes. Theor. Appl. Genet. 1996;94:61–67. doi: 10.1007/BF00230127. [DOI] [PubMed] [Google Scholar]
- 11.Temnykh S., DeClerck G., Lukashova A., Lipovich L., Cartinhour S., McCouch S. R. Computational and experimental analysis of microsatellites in rice (Oryza sativa L.): frequency, length variation, transposon associations, and genetic marker potential. Genome Res. 2001;11:1441–1452. doi: 10.1101/gr.184001. [DOI] [PMC free article] [PubMed] [Google Scholar]
- 12.Temnykh S., Park W. D., Ayers N., et al. Mapping and genome organization of microsatellite sequences in rice (Oryza sativa L.) Theor. Appl. Genet. 2000;100:697–712. [Google Scholar]
- 13.McCouch S. R., Teytelman L., Xu Y., et al. Development and mapping of 2240 new SSR markers for rice (Oryza sativa L.) DNA Res. 2002;9:199–207. doi: 10.1093/dnares/9.6.199. [DOI] [PubMed] [Google Scholar]
- 14.Yu J., Wang J., Lin W., Li S., Li H., Zhou J., et al. The Genomes of Oryza sativa: a history of duplications. PLoS Biol. 2005;3 doi: 10.1371/journal.pbio.0030038. [DOI] [PMC free article] [PubMed] [Google Scholar]
- 15.IRGSP. The map-based sequence of the rice genome. Nature. 2005;436:793–800. doi: 10.1038/nature03895. [DOI] [PubMed] [Google Scholar]
- 16.Li C., Zhang Y., Ying K., Liang X., Han B. Sequence variations of simple sequence repeats on chromosome-4 in two subspecies of the Asian cultivated rice. Theor. Appl. Genet. 2004;108:392–400. doi: 10.1007/s00122-003-1457-z. [DOI] [PubMed] [Google Scholar]
- 17.Zhao W., Wang J., He X., et al. BGI-RIS: an integrated information resource and comparative analysis workbench for rice genomics. Nucleic Acids Res. 2004;32:D377–D382. doi: 10.1093/nar/gkh085. [DOI] [PMC free article] [PubMed] [Google Scholar]
- 18.Rozen S., Skaletsky H. Primer3 on the WWW for general users and for biologist programmers. In: Krawetz S., Misener S., editors. Bioinformatics Methods and Protocols: Methods in Molecular Biology. Humana Press: Totowa, NJ; 2000. pp. 365–386.. [DOI] [PubMed] [Google Scholar]
- 19.Murray M. G., Thompson W. F. Rapid isolation of high molecular weight plant DNA. Nucleic Acids Res. 1980;8:4321–4325. doi: 10.1093/nar/8.19.4321. [DOI] [PMC free article] [PubMed] [Google Scholar]
- 20.Fujimori S., Washio T., Higo K., et al. A novel feature of microsatellites in plants: a distribution gradient along the direction of transcription. FEBS Lett. 2003;554:17–22. doi: 10.1016/s0014-5793(03)01041-x. [DOI] [PubMed] [Google Scholar]
- 21.Zhang L., Yuan D., Yu S., et al. Preference of simple sequence repeats in coding and non-coding regions of Arabidopsis thaliana. Bioinformatics. 2004;20:1081–1086. doi: 10.1093/bioinformatics/bth043. [DOI] [PubMed] [Google Scholar]
- 22.Yu J., Ni P., Wong G.-K. S. Comparing the whole-genome-shotgun and map-based sequences of the rice genome. Trends Plant Sci. 2006;11:387–391. doi: 10.1016/j.tplants.2006.06.005. [DOI] [PubMed] [Google Scholar]
- 23.Cohen H., Danin-Poleg Y., Cohen C. J., Sprecher E., Darvasi A., Kashi Y. Mono-nucleotide repeats (MNRs): a neglected polymorphism for generating high density genetic maps in silicon. Hum. Genet. 2004;115:213–220. doi: 10.1007/s00439-004-1135-5. [DOI] [PubMed] [Google Scholar]
- 24.Samina N., Sukumar S., Ramesh V., Jenkins J. EST-SSR: A new class of genetic markers in cotton. J. Cotton Sci. 2004;8:112–123. [Google Scholar]
- 25.Schloss J., Mitchell E., White M., et al. Characterization of RFLP probe sequences for gene discovery and SSR development in Sorghum bicolor (L.) Moench. Theor. Appl. Genet. 2002;105:912–920. doi: 10.1007/s00122-002-0991-4. [DOI] [PubMed] [Google Scholar]
- 26.Schlotterer C., Tautz D. Slippage synthesis of simple sequence DNA. Nucleic Acids Res. 1992;20:211–215. doi: 10.1093/nar/20.2.211. [DOI] [PMC free article] [PubMed] [Google Scholar]