Abstract
Dihydroorotate dehydrogenases (DHODs) are FMN-containing enzymes that catalyze the conversion of dihydroorotate (DHO) to orotate in the de novo synthesis of pyrimidines. During the reaction, a proton is transferred from C5 of DHO to an active site base and the hydrogen at C6 of DHO is transferred to N5 of the isoalloxazine ring of the flavin as a hydride. In Class 2 DHODs, a hydrogen-bond network observed in crystal structures has been proposed to deprotonate the C5 atom of DHO. The active site base (Ser175 in the E. coli enzyme) hydrogen bonds to a crystallographic water molecule that sits on a phenylalanine (Phe115 in the E. coli enzyme) and hydrogen-bonds to a threonine (Thr178 in the E. coli enzyme) – residues that are conserved in Class 2 enzymes. The importance of these residues in the oxidation of DHO was investigated using site-directed mutagenesis. Mutating Ser175 to alanine had severe effects on the rate of flavin reduction, slowing it by more than three orders of magnitude. Changing the size and/or hydrophobicity of the residues of the hydrogen-bonding network, Thr178 and Phe115, slowed flavin reduction as much as two orders of magnitude, indicating that the active site base and the hydrogen-bond network work together for efficient deprotonation of DHO.
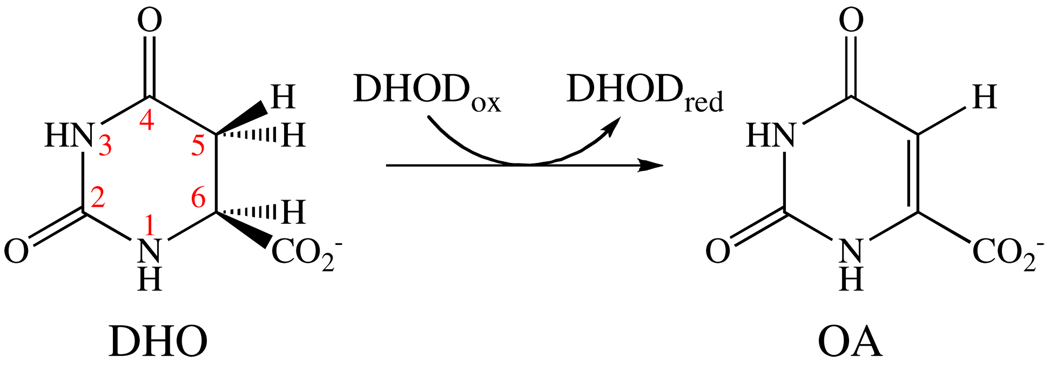
Dihydroorotate dehydrogenases (DHODs)1 catalyze the fourth step in the de novo synthesis of pyrimidines. DHODs are flavin-containing enzymes that convert dihydroorotate (DHO) to orotate (OA) – the only redox step in pyrimidine synthesis (Scheme 1). DHODs have been categorized into two broad classes based on sequence (1). Class 2 DHODs are membrane-bound monomers that are oxidized by ubiquinone (2). Class 1 DHODs are cytosolic proteins that have been further divided into two classes. Class 1A DHODs are homodimers that use fumarate as the physiological oxidizing substrate (3). Class 1B DHODs are α2β2 heterotetramers. One subunit resembles the Class 1A monomer and a second subunit contains an iron-sulfur cluster and FAD, allowing the Class 1B DHODs to be oxidized by NAD (4). Class 2 DHODs are found in most eukaryotes and Gram-negative bacteria, while Class 1 enzymes are found mostly in Gram-positive bacteria and in a few microbial eukaryotes.
Scheme 1.
All DHODs catalyze the same reductive half-reaction, the oxidation of DHO with the concomitant reduction of the enzyme-bound flavin, while the oxidative half-reactions for each class are different. Structures of Class 2 DHODs have shown that the enzymes contain two separate substrate-binding sites (5–10). The pyrimidine-binding site is found on the si face of the flavin and is very similar in all DHODs. The quinone-binding site is thought to be in a tunnel-like pocket (formed by an N-terminal domain found only in Class 2 DHODs) that leads to the 7,8-dimethyl edge of FMN.
Oxidation of DHO breaks two carbon-hydrogen bonds. An active site base (serine in Class 2 enzymes or cysteine in Class 1 enzymes) deprotonates C5 of DHO and a hydride is transferred from C6 of DHO to N5 of the isoalloxazine ring of the flavin. The reductive half-reaction of the Class 2 DHOD from Escherichia coli has been studied in great detail in anaerobic stopped-flow experiments. The rate constant for reduction increased with pH until it plateaued above a pKa of ~9.5 (11). Structures show that a serine is positioned to deprotonate DHO (7–9). However, there are no obvious structural features that would lower the pKa so dramatically (a change by four pH units or more) from that of an unactivated serine. Deuterium isotope effects showed that DHO oxidation is stepwise in Class 2 DHODs (12). In addition, using DHO deuterated at the C5 position (the site of deprotonation), the kinetic isotope effect was lost at a pH value above the pKa (12), leading to the proposal that the observed pKa in Class 2 DHODs is actually a kinetic pKa. Thus at high enough pH values, the rate constant for DHO deprotonation becomes so much larger than that of hydride transfer that it is not even partially rate-determining in the overall observed rate constant for reduction.
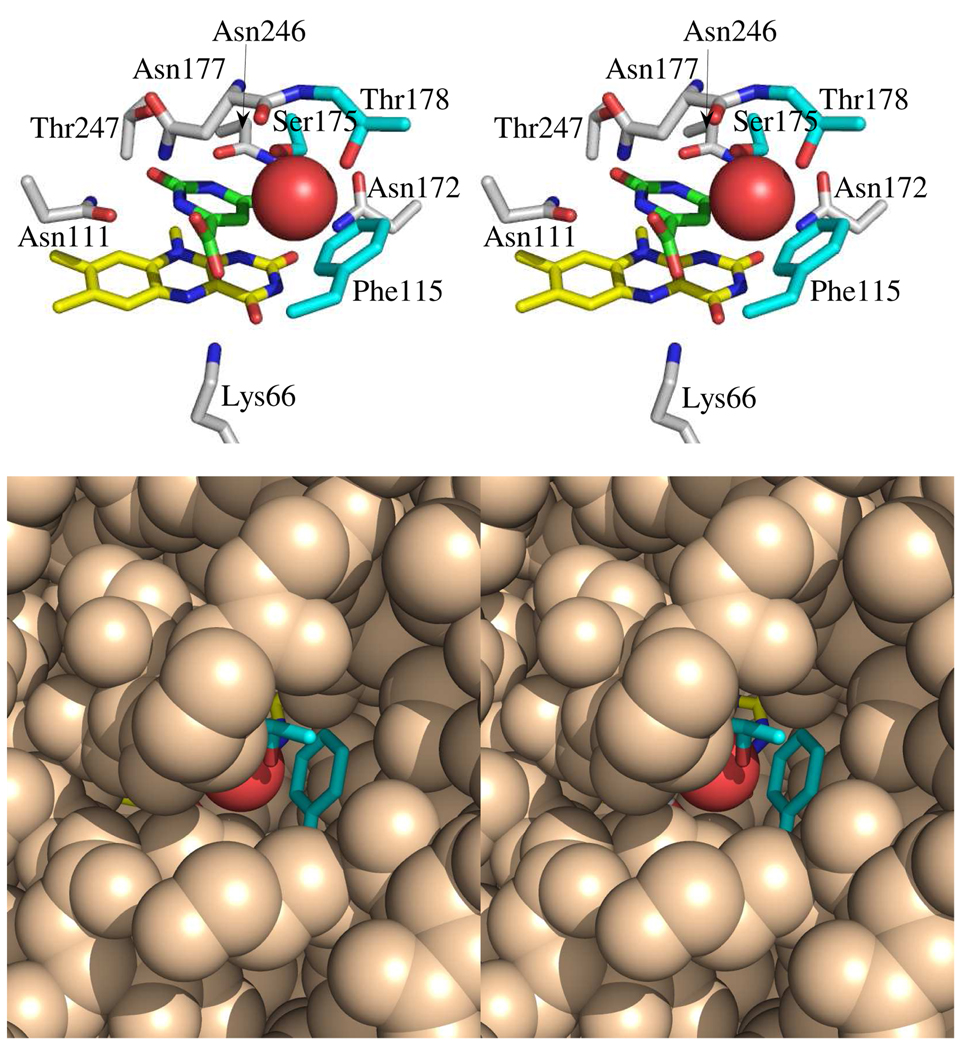
Crystal structures show that the active site base is part of a hydrogen-bond network with both water molecules and other residues (Figure 1). The active site base (Ser175 in the E. coli enzyme) hydrogen-bonds to a crystallographic water that sits on a phenylalanine (Phe115 in the E. coli enzyme) and hydrogen-bonds to a threonine (Thr178 in the E. coli enzyme) – residues that are strictly conserved in Class 2 DHODs. This hydrogen-bond network connects the active site base to bulk solvent through a small tunnel. This network has been proposed to shuttle protons from the active site to bulk solvent and could have a role in allowing the serine to act as a base (13).
Figure 1.
Stereo view of the hydrogen-bond network to the pyrimidine-binding site of Class 2 DHOD from E. coli. The upper panel shows the active site base (Ser175), connected to the bulk solvent via a hydrogen-bonding network. A crystallographic water (red ball) sits on Phe115 and hydrogen-bonds to Thr178, residues that are conserved in Class 2 DHODs. In addition, the pyrimidine-binding site includes several highly conserved residues that hydrogen-bond with the pyrimidine (OA shown in green). The lower panel highlights the small tunnel containing the hydrogen-bond network. The viewpoint is from the right side of the upper panel. Thr 178 and Phe 115 are shown as sticks, the crystallographic water is a red sphere, and the rest of the protein is rendered as space-filling. Coordinates taken from pdb file 1f76.
To investigate the role of this hydrogen-bond network in DHO oxidation, site-directed mutants of the strictly conserved residues Ser175, Thr178, and Phe115 were created and the pH dependence of their reductive half-reactions were determined. Blocking the tunnel and/or making the tunnel more hydrophobic impairs flavin reduction and supports the proposed role of this hydrogen-bonding network in flavin reduction.
Experimental Procedures
Site-Directed Mutagenesis
Site-directed mutants were made from the previously created pAG-1 expression vector (14) using the Stratagene QuikChange II XL mutagenesis kit. Insertion of the correct mutations was checked by sequencing the entire pyrD gene.
Overexpression and Purification
All mutant enzymes were overexpressed from the pAG-1 plasmid in SØ6645 E. coli cells (14). The enzymes were purified according to the published procedure (14). Purified enzyme was diluted to 50% (v/v) with glycerol and stored at −80 °C. Before use, enzymes were exchanged into the appropriate buffer using Econo-Pac 10DG disposable desalting columns (Bio-Rad).
Instrumentation
Absorbance spectra were obtained using a Shimadzu UV-2501PC scanning spectrophotometer. Stopped-flow experiments were performed at 4 °C using a Hi-Tech Scientific KinetAsyst SF-61 DX2 stopped-flow spectrophotometer.
Preparation of Anaerobic Solutions
Enzyme solutions for rapid reaction studies were made anaerobic in glass tonometers by repeated cycles of evacuation and equilibration over an atmosphere of purified argon as previously described (15). Substrate solutions were made anaerobic within syringes by bubbling with purified argon before they were loaded onto the stopped-flow instrument. Slow reactions were performed in anaerobic cuvettes (16) and monitored in a standard scanning spectrophotometer. These reaction mixtures were also made anaerobic by repeated evacuation and equilibration with purified argon.
Reduction Potentials
Reduction potentials were determined by the xanthine/xanthine oxidase method of Massey (17). Experiments were performed in anaerobic cuvettes (16) and monitored in a standard scanning spectrophotometer at 25 °C, pH 7.0. Phenosafranin (Em = −252 mV) was used as the indicator dye.
OA Binding to Oxidized Mutants
The dissociation constant of OA was determined in aerobic titrations in a standard scanning spectrophotometer. The enzyme equilibrated in 0.1 M Tris-HCl, pH 8.5 at 25 °C was titrated with OA in the same buffer. The differences in flavin absorbance caused by binding were plotted against OA concentration, and the data were fit to Equation 1, where E0 is the total enzyme concentration and L0 is the total added ligand concentration, in Kaleidagraph (Synergy, Inc.) to determine the Kd .
| (Eq. 1) |
pH Dependence of the Reduction of Mutant DHODs
The reductive half-reactions of the Thr178 and Phe115 single- and double-mutant enzymes were studied in anaerobic stopped-flow experiments at 4 °C. In most cases, the enzyme was equilibrated in 0.1 M buffer (pH 6 – 7.5, potassium phosphate; pH 7.5 – 9, Tris-HCl; pH 9 – 9.5, CHES; pH 10 – 11.5, CAPS) and mixed with varying concentrations of DHO in the same buffer. For the Phe115Leu and the Phe115Leu/Thr178Val mutant enzymes, double-mixing pH-jump experiments were conducted at pH values higher than 10.5 due to enzyme instability. In these cases, the enzyme, equilibrated in 5 mM potassium phosphate, pH 7, was mixed with 0.2 M buffer (pH 10.5–11.5, CAPS) and allowed to age for 2 s. Then the enzyme was mixed with varying concentrations of DHO in 0.1 M buffer (pH 10.5–11.5, CAPS). In all cases, reaction traces were collected at 475 nm and 550 nm and were fit to sums of exponentials in Program A (Rong Chang, Chung-Jin Chiu, Joel Dinverno and David P. Ballou, University of Michigan). The reduction rate constant (kred) at each pH value was determined from the limiting value of the observed rate constant at saturating DHO concentration. This was obtained by fitting kobs vs. DHO concentration to a hyperbola in Kaleidagraph (Synergy, Inc.). For the Phe115Leu mutant enzyme at pH 8.5, the reaction traces could not easily be fit to sums of exponentials and were therefore analyzed by global fitting in Berkeley Madonna. Reaction traces at each concentration were averaged, and the average reaction traces for all concentrations were simultaneously fit to the mechanism in Scheme 2 (the scheme that describes the reductive half-reaction of wild-type E. coli DHOD). The rate constants used for DHO binding to the oxidized and reduced enzyme were held constant during the fit to the values that describe the wild-type reaction. Both these steps are very fast and are not observed in our kinetic data. The initial estimates of the rate constants for flavin reduction and product dissociation were 2 s−1. The model used for fitting is available in Supporting Information.
Scheme 2.
The pH dependence of flavin reduction was fit to a model in which only the deprotonated form of the enzyme reacts. This is described by Equation 2, where kred,limiting (the limiting reduction rate constant at high pH) is the rate constant of the deprotonated form of the enzyme.
| (Eq. 2) |
Reduction of the flavin in the Ser175Ala mutant DHOD was very slow at 4 °C; therefore, it was studied at 25 °C. The same buffers described above were used to investigate the pH dependence of flavin reduction in this enzyme. Below pH 9, flavin reduction was slow enough to be monitored using a standard scanning VIS/UV spectrophotometer. Enzyme equilibrated in the buffer of interest was mixed with either 1 or 2 mM DHO (concentrations after mixing) in an anaerobic cuvette and spectra were taken at intervals until flavin reduction was complete. Reactions traces at 475 nm were extracted and fit to a single exponential. The observed rate constant at each DHO concentration was the same, indicating saturation. Since a saturating DHO concentration was used in each experiment, the kobs obtained from fitting the exponential traces is equivalent to kred. Above pH 9, the reductive half-reaction was investigated in anaerobic stopped-flow experiments. Anaerobic enzyme was mixed with varying concentrations of anaerobic DHO. Reaction traces were collected at 475 nm and fit to a single exponential. The reduction rate constant (kred) was determined from the limiting value of the observed rate constant at saturating DHO concentration obtained by fitting kobs vs. DHO concentration to a hyperbola in Kaleidagraph (Synergy, Inc.).
Solvent Isotope Effect
The solvent isotope effect on the reductive half-reaction of the wild-type enzyme was determined in anaerobic stopped-flow experiments at 4 °C using the methods described above for the pH-dependence of the reductive half-reaction. Enzyme was equilibrated in 0.1 M potassium phosphate with either H2O or D2O as the solvent using a desalting column pre-equilibrated in that buffer. The pH of the buffer in H2O was 7.7. For buffer in heavy-water, potassium phosphate in H2O was dried in vacuo, dissolved in D2O, dried again, and redissolved in D2O, thus maintaining the ratio of monobasic and dibasic phosphate present in the H2O-buffer.
Results
Reduction Potentials
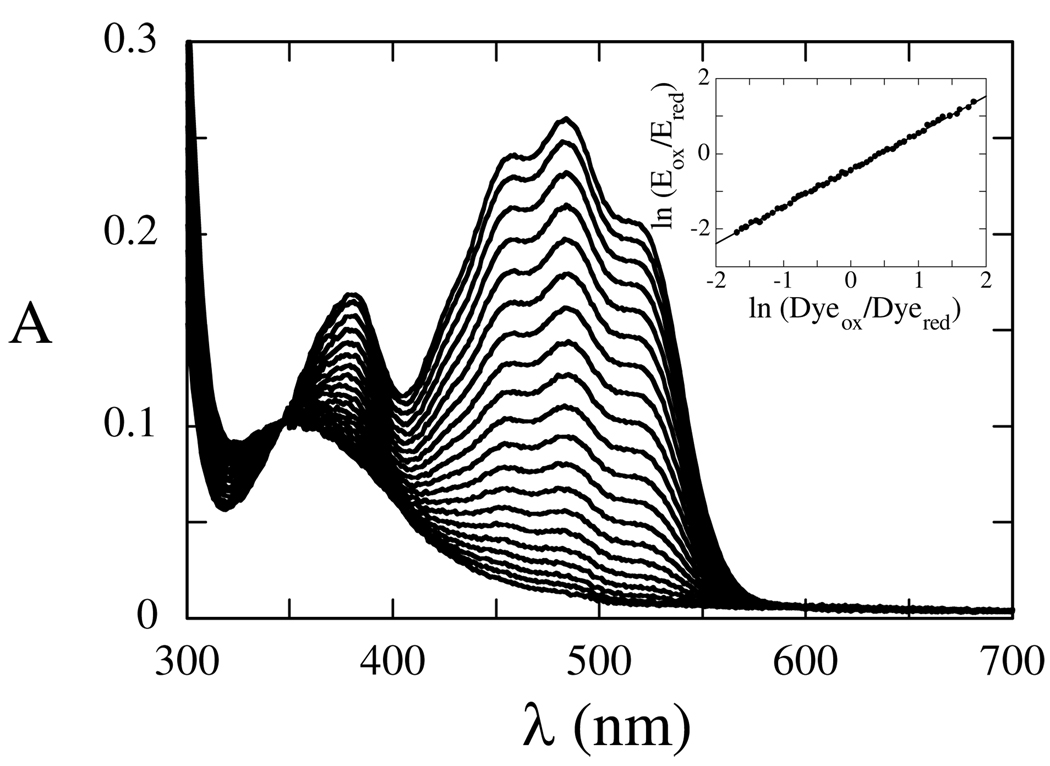
The reduction potential of the enzyme-bound flavin in the mutant enzymes was determined by the method of Massey (17) using phenosafranin as the indictor dye (Table 1; Figure 2). The potential of the wild-type enzyme was recently reported to be −229 mV (18). The only mutation to not affect the reduction potential was Phe115Ala. All other mutations lowered the reduction potential. The biggest effects were seen in the Ser175Ala, Thr178Ala, and Thr278Val mutant enzymes. These enzymes had reduction potentials near −270 mV, ~40 mV lower than wild-type. Curiously, during the reduction of the Phe115Leu/Thr178Val double mutant, a small amount of neutral semiquinone was produced. Nonetheless, the Nernst plot was linear and a two-electron potential for the enzyme could be determined.
Table 1.
Reduction Potentials of Mutant DHODs
| Enzyme | Reduction Potentiala |
|---|---|
| Wild-Typeb | −229 mV |
| Ser175Ala | −267 mV |
| Thr178Ser | −249 mV |
| Thr178Ala | −269 mV |
| Thr178Val | −264 mV |
| Phe115Ala | −229 mV |
| Phe115Leu | −245 mV |
| Phe115Trp | −258 mV |
| Phe115Leu/Thr178Val | −239 mV |
Reduction potentials determined by the xanthine/xanthine method have a precision of ± 5 mV.
Data taken from (18).
Figure 2.
Determination of the Reduction Potential of Phe115Leu Mutant DHOD. Phenosafranin was used as an indicator dye to determine the reduction potential. The inset shows the Nernst plot for determining the potential.
OA Binding
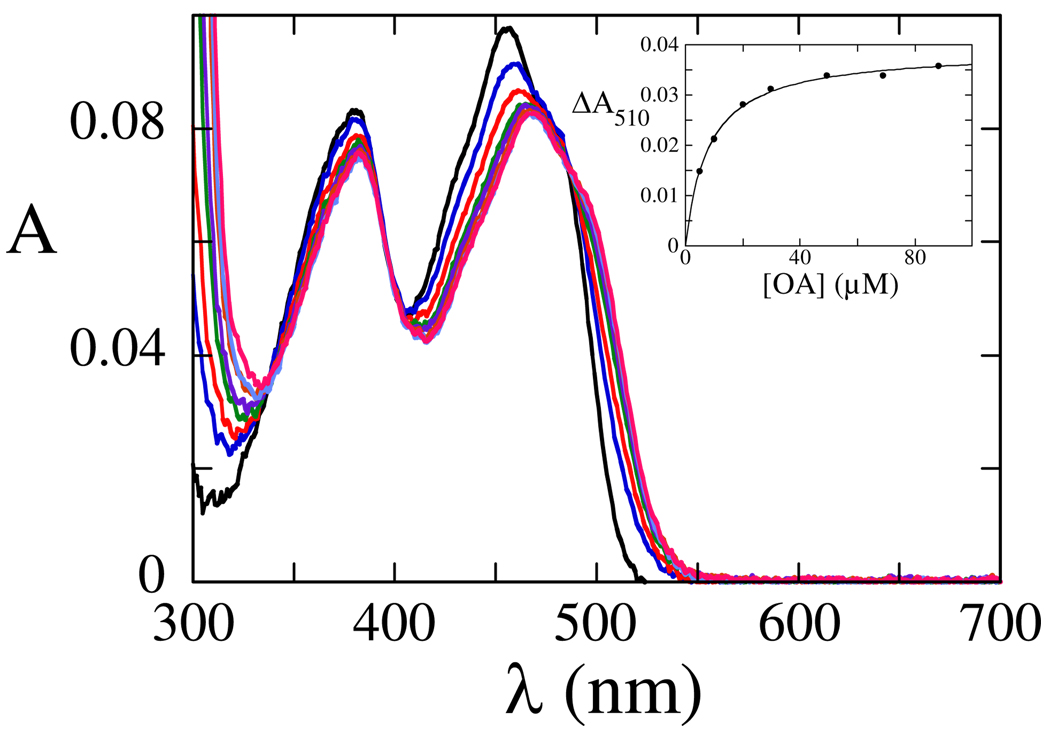
Oxidized DHOD from E. coli has a maximum visible absorbance peak at 456 nm. The UV/Vis absorbance spectra of all oxidized mutant enzymes were essentially identical to that of wild-type. Ligand binding often causes spectral perturbation in flavoenzymes. OA binding to oxidized DHODs causes a large red-shift in the flavin absorbance (14, 18–21). In the Class 2 enzyme from E. coli, this shift is from 456 nm to 475 nm (14). By tracking this spectral change, the dissociation constant for OA could be determined in aerobic titrations at pH 8.5, 25 °C (Figure 3). Similar spectral shifts were seen in all mutant enzymes, and only minor effects on Kd were observed (Table 2).
Figure 3.
OA Binding Titration, pH 8.5, 25 °C. The Phe115Ala mutant DHOD was titrated aerobically with OA. Upon OA binding, the maximum flavin peak shifts to the red. The inset shows the maximum change in absorbance due to OA binding as a function of OA concentration. Fitting to Equation 1 gives the Kd value for OA, 3.8 ± 0.5 µM.
Table 2.
Binding of OA to Oxidized Mutant DHODs, pH 8.5, 25 °C
| Enzyme | Kd (µM) |
|---|---|
| Wild-Typea | 3.4 ± 0.8 |
| Ser175Ala | 9.9 ± 0.9 |
| Thr178Ser | 1.1 ± 0.4 |
| Thr178Ala | 6.1 ± 0.8 |
| Thr178Val | 0.56 ± 0.04 |
| Phe115Ala | 3.8 ± 0.5 |
| Phe115Leu | 3.7 ± 0.3 |
| Phe115Trp | 8.1 ± 0.4 |
| Phe115Leu/Thr178Val | 4.6 ± 0.3 |
Data taken from (18).
pH Dependence of Flavin Reduction
The reductive half-reaction of the Class 2 DHOD from E. coli has been studied in great detail in anaerobic stopped-flow experiments (11, 12). To probe the role of conserved residues in a hydrogen-bonding network connecting the active site base to bulk solvent, site-directed mutagenesis was used. Thr178, which hydrogen-bonds to a crystallographic water in this network (Figure 1), was replaced by serine, alanine, and valine (the residue found in Class 1A DHODs, which do not contain this network). The water sits on Phe115, which was replaced by alanine, leucine (the residue found in Class 1A DHODs), and tryptophan. The reductive half-reaction of each of these mutant enzymes was studied in anaerobic stopped-flow experiments. In addition, the Phe115Leu/Thr178Val double-mutant enzyme was also studied. Data from all mutant enzymes fit the same scheme proposed for the wild-type enzyme (11; Scheme 2). While the reductive half-reaction of the wild-type enzyme has been shown to be reversible, the equilibrium lies far towards reduced enzyme and the rate constant for the reverse reaction (the reduction of OA to DHO) is so small compared to the rate constant for DHO oxidation that it is essentially zero (11). The same is true for the mutant enzymes studied here.
The spectral changes observed during the reductive half-reactions of the mutant enzymes were identical to those observed in wild-type (11, 12). In most cases, DHO binding was very rapid and occurred in the dead-time of the stopped-flow instrument. The Phe115Leu/Thr178Val double-mutant enzyme displayed a very small first phase (over within the first 5 ms) that might be due to substrate binding. DHO binding is accompanied by a large shift in the flavin absorbance peak, from 456 nm to 475 nm. This spectral shift resembles the shift observed upon OA binding. The first phase observed in the double-mutant consisted of a small increase at 510 nm (the wavelength at which the largest change is observed in the flavin spectrum upon OA binding), a small decrease at 450 nm, and a lag at 475 nm – all consistent with a spectral shift from 456 nm to 475 nm due to substrate binding. However, these spectral changes were very small and difficult to fit. Reliable rate constants for this phase could not be obtained.
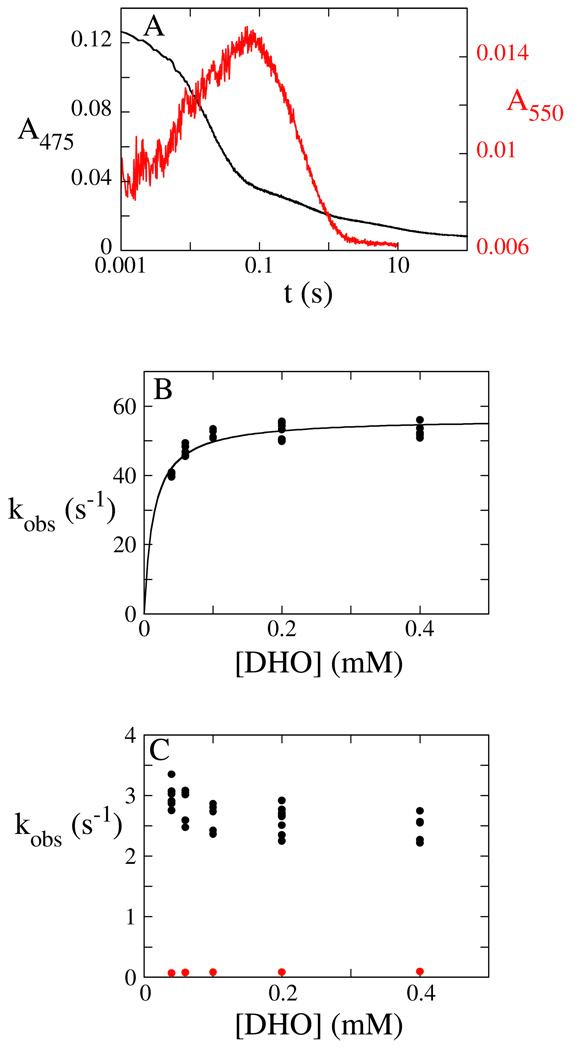
In most DHODs – wild-type (11, 12) and most mutant (22) Class 2 enzymes as well as wild-type Class 1A enzymes (23) – the first observable phase in the reductive half-reaction is the chemical step, the reduction of the enzyme-bound flavin since substrate binding occurs in the dead-time of the stopped-flow instrument. The same is true for all the mutants studied here except for the Phe115Lue/Thr178Val double mutant enzyme. The rate constant for flavin reduction is pH-dependent in DHODs (11, 12, 23). When the rate constant for flavin reduction is higher than that for product dissociation, the concentration of the reduced enzyme•OA complex that accumulates is large enough to be seen spectroscopically. When this occurs, flavin reduction, seen as a large decrease in absorbance at 475 nm, is accompanied by a concomitant increase in absorbance at 550 nm (Figure 4A). The 550 nm absorbance is due to a charge-transfer interaction between the electron-rich reduced flavin and the electron-deficient OA. The following phase is caused by product dissociation and is accompanied by a decrease in absorbance at both 475 nm and 550 nm (Figure 4A). When flavin reduction is slower than product release, the reduced enzyme•OA complex does not accumulate and only flavin reduction is observed spectroscopically.
Figure 4.
Reductive Half-Reaction of the Phe115Leu Mutant DHOD at pH 10. (A) Enzyme (~9.5 µM after mixing) was mixed with DHO (400 µM after mixing) in an anaerobic stopped-flow experiment at 4 °C. The dead-time of the stopped-flow instrument was 1 ms. At 475 nm (black), the reaction occurs in three phases. The first (large) phase represents the chemical step. The second phase represents product release. At 550 nm (red), flavin reduction is seen as an increase in absorbance and product dissociation is seen as a decrease in absorbance. Reaction traces are shown on a log scale. (B) The observed rate constant of the first phase (flavin reduction) saturates with increasing DHO concentration, giving a reduction rate constant (kred) of 56.5 ± 0.9 s−1 and an estimate of the Kd,DHO of 14 ± 2 µM. (C) The observed rate constant of the second phase (black), OA release, decreases with increasing DHO concentration, giving a limiting value of 2.5 s−1. The observed rate constant of the final phase (red) is ~0.08 s−1 and is independent of DHO concentration.
In all the mutant enzymes studied, a small final well-resolved phase representing less than 10% of the total absorbance change was observed at 475 nm (Figure 4A). This phase was also observed in wild-type (11). It is unclear what this phase represents. It has been suggested that this phase could be due to the reduction of a small amount of contaminating free flavin (11) or slow reduction of damaged enzyme (18). The difference between the absorbance spectrum at the start of this slow phase and after its completion for the Phe115Leu/Thr178Val double-mutant enzyme indicated that the reaction was the reduction of red-shifted enzyme, suggesting that for this enzyme, the phase was due to damaged enzyme.
The reaction traces obtained at 475 nm and 550 nm were fit to sums of exponentials. The observed rate constant of the phase representing flavin reduction saturated with increasing DHO concentrations. The reduction rate constant (kred) – the rate constant at infinite DHO concentration – was determined by fitting the observed rate constant versus DHO concentration plot to a hyperbola (Figure 4B). The half-saturating value gives the apparent Kd of DHO. The observed rate constant of the product release phase decreased with increasing DHO concentration (Figure 4C) as seen in wild-type (11). This concentration dependence indicates a unimolecular step (product release) followed by a bimolecular step (free reduced enzyme binding the unreacted DHO to form a reduced enzyme•DHO dead-end complex). The observed rate constant of the final phase was independent of DHO concentration and at least an order of magnitude smaller than the rate constants of the other phases (Figure 4C).
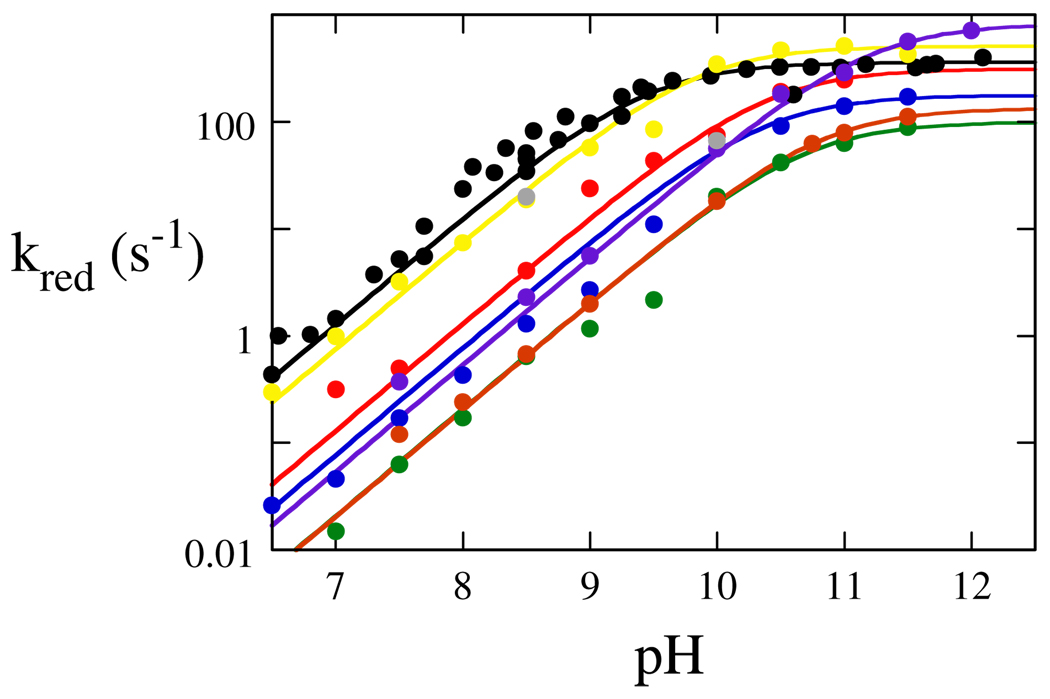
As mentioned earlier, the rate constant for flavin reduction increases with pH. The Class 2 DHOD from E. coli exhibits a pKa of ~9.5 (11). The pH dependence of the reduction rate constant was determined for the mutant enzymes2 (Figure 5). In most cases, the reduction rate constant increased until reaching a break point on a log-plot, indicating a pKa. In some cases, flavin reduction was very fast at high pH, making it difficult to obtain accurate rate constants. In addition, the Phe115Leu mutant enzyme was unstable at high pH. Even during pH-jump experiments, a small percentage of the enzyme was denatured before reduction, further complicating the determination of accurate rate constants. Therefore, the values listed in Table 3 are the best estimates for kred,limiting (the limiting rate constant for flavin reduction at high pH).
Figure 5.
pH Dependence of Reduction Rate Constants. Wild-type, black; Thr178Ser, yellow; Thr178Ala, blue; Thr178Val, green; Phe115Ala, red; Phe115Leu, purple; Phe115Trp, grey; Phe115Leu/Thr178Val, orange. The limiting reduction rate constants and observed pKa values can be found in Table 3.
Table 3.
pH Dependence on Flavin Reduction
| Enzyme | lim kred (s−1) | pKa |
|---|---|---|
| Wild-Typea | 360 ± 20 | 9.5 ± 0.1 |
| Thr178Ser | ~500 | ~9.8 |
| Thr178Ala | 180 ± 10 | 10.4 ± 0.1 |
| Thr178Val | 100 ± 4 | 10.7 ± 0.1 |
| Phe115Ala | 315 ± 20 | 10.4 ± 0.1 |
| Phe115Leu | ~800 | ~11.2 |
| Phe115Leu/Thr178Val | 135 ± 2 | 10.8 ± 0.1 |
Data taken from (11).
The most conservative mutation studied (Thr178Ser) resulted in a pH dependence nearly identical to that of wild-type. The limiting reduction rate constant was ~500 s−1 (~1.4-fold faster than wild-type). The observed pKa was shifted by ~0.3 pH units to ~9.8 (Table 3). Larger effects were observed when Thr178 was mutated to alanine and valine. The limiting reduction rate constants were ~2-fold lower than that of the wild-type enzyme. In addition, the observed pKa values were shifted ~1 pH unit to 10.4 (Thr178Ala) and 10.7 (Thr178Val). The Phe115Ala mutant enzyme had a limiting rate constant near that of wild-type. However, the observed pKa was shifted to ~10.4. The largest change in the pKa was observed in the Phe115Leu mutant enzyme. The limiting rate constant of this mutant is estimated to be ~800 s−1 (~2-fold faster than wild-type). The observed pKa is shifted nearly two pH units to ~11.2. Interestingly, when both Phe115 and Thr178 were mutated, the mutant enzyme behaved like the Thr178Val single-mutant. The Phe115Leu/Thr178Val mutant had a limiting reduction rate constant of 135 s−1 and a pKa of ~10.8.
The apparent Kd of DHO is also pH-dependent in the wild-type (11) and the mutant enzymes studied here. In wild-type enzyme, the Kd is low (~20 µM) until the pH is increased above ~10, whereupon the Kd increases, giving a pKa of ~10.3 (11). Almost all the mutant enzymes studied behaved similarly, with tight binding observed up to a pH of ~10 (Supporting Information). However, the Phe115Ala and the Phe115Trp mutant enzymes were quite different. The Kd of DHO for the Phe115Ala mutant enzyme, even at low pH, was in the range of hundreds of micromolar and was independent of pH. The Phe115Trp mutant enzyme was only studied at pH 8.5 and 10.0, but the apparent Kd was near 1 mM at both pH values – nearly 2 orders of magnitude above wild-type.
When enough reduced enzyme•OA complex accumulates during the reaction to be seen spectroscopically, the rate constant of product release can be determined. In the wild-type enzyme, between pH 6 – 12, the average rate constant for product release is ~0.35 s−1 (11, 12). The same was observed in all the Thr178 mutant enzymes. In all instances where the rate constant for product release could be obtained, it ranged from ~0.2 – 0.6 s−1, independent of pH. The Phe115 mutant enzymes behaved very differently. In the Phe115Ala mutant DHOD, product release was observed above pH 9. The rate constant (~8 s−1) was independent of pH, but was an order of magnitude larger than that of wild-type. In the Phe115Trp mutant enzyme, the rate constant of product release was also much faster (~3.5 s−1) than wild-type at pH 10.5. The rate constants for product dissociation for the Phe115Leu single-mutant and the Phe115Leu/Thr178Val double-mutant enzymes were pH-dependent. For the single-mutant, at lower pH (8 – 9.5), the rate constant was ~1 s−1. However, as the pH increased, the rate constant decreased. At pH 12, the rate constant was only ~0.2 s−1, near the values routinely obtained with the wild-type enzyme. The same general trend was observed for the double-mutant. The rate constant was ~5 – 6 s−1 at lower pH (9.5–10) and decreased as pH increased to a value of ~0.4 s−1 at pH 11.5.
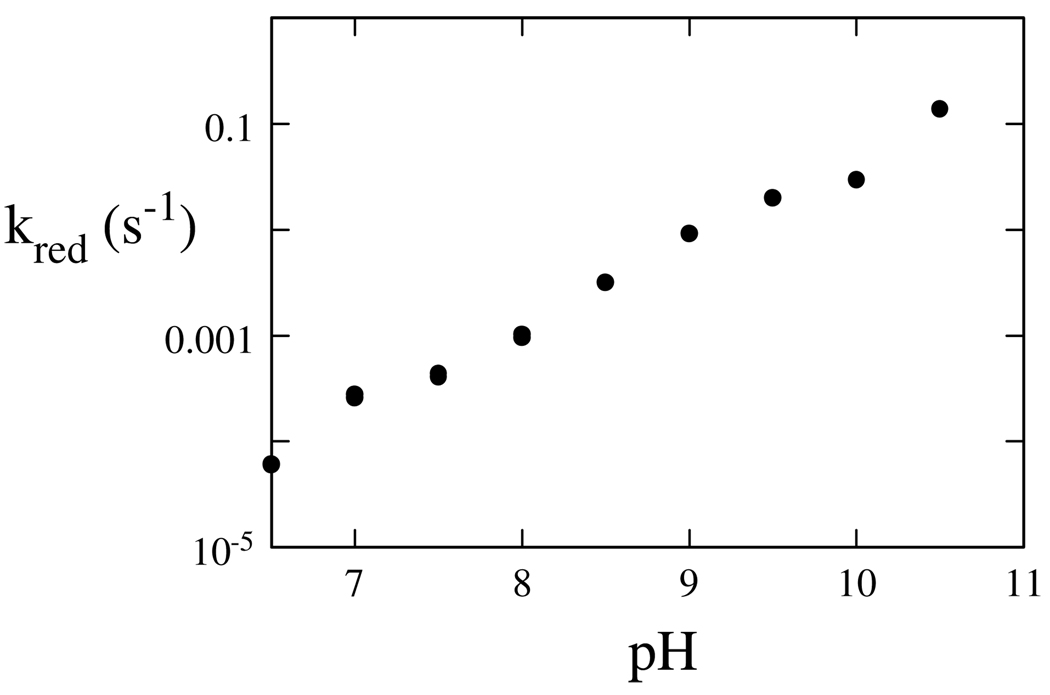
The pH dependence of the reductive half-reaction was also studied for the Ser175Ala mutant enzyme, whose active site base has been removed. For this enzyme, flavin reduction was extremely slow at 4 °C and was therefore studied at 25 °C. At all pH values, a single reaction phase, representing flavin reduction, was observed. The reduction rate constant increased with increasing pH, showing no observable pKa (Figure 6).
Figure 6.
pH Dependence of Flavin Reduction in the Ser175Ala Mutant DHOD. The pH dependence was determined at 25 °C because the reaction was extremely slow at 4 °C. The reduction rate constant increases linearly on the log plot verses pH, with no indication of a pKa.
Solvent Isotope Effects
The solvent isotope effect on the rate constant for flavin reduction of the wild-type enzyme was determined at pH 7.7, 4 °C, in anaerobic stopped-flow experiments. The limiting rate constant for flavin reduction obtained in H2O was 18.5 ± 0.2 s−1, consistent with the value previously reported (11). When D2O was used as the solvent for buffer with an identical ratio of conjugate acid and conjugate base, a rate constant for flavin reduction of 20.2 ± 0.4 s−1 was obtained. Therefore, a slightly inverse solvent isotope effect, 0.92 ± 0.03, was obtained. The minor deviation from unity indicates that exchangeable protons are not in flight during flavin reduction.
Discussion
DHODs catalyze the oxidation of DHO to OA using an active site base and a flavin prosthetic group. To oxidize DHO to OA, C5 must be deprotonated. Crystal structures of Class 2 DHODs show that a strictly conserved serine residue is properly positioned to act as an active site base (7–9). The pyrimidine-binding site of Class 2 DHODs is not exposed to solvent; therefore, the proton abstracted from C5 cannot go directly to the solvent. Instead, a hydrogen-bonding network connects the active site base to bulk solvent. In crystal structures, the active site base hydrogen-bonds to a crystallographic water molecule that sits on a phenylalanine and hydrogen-bonds to a threonine – strictly conserved residues in Class 2 enzymes (5–10). Molecular dynamics studies have shown that a water molecule occupies the tunnel almost all of the time (13). Simulations were used to look for possible hydrogen-bond networks; the same network observed in crystal structures was also found in the simulations (13). This pathway seems the most reasonable for getting a proton to bulk solvent. The proton would be passed from C5 of DHO to the active site base (Ser175 in E. coli DHOD), to the water molecule in the tunnel to a conserved threonine (Thr178 in E. coli DHOD) and finally to bulk solvent (Figure 1). In contrast, the active sites of Class 1 enzymes are much more exposed to solvent (19, 24–27), negating the need for a hydrogen-bonding network. Site-directed mutilation was used to probe the role of the conserved proton-relay network in the E. coli Class 2 DHOD.
The mutations apparently had little effect on the pyrimidine-binding site and the flavin environment. The absorbance spectra of the oxidized enzymes were nearly identical to that of wild-type, with a maximum flavin peak at 456 nm. In addition, circular dichroism spectra of the flavin chromophore of oxidized and reduced mutant enzymes (Supporting Information) were roughly similar to those of the wild-type enzyme, indicating that the mutations caused only minor changes at most to the flavin environment. All the mutant enzymes exhibited the usual spectral shift in the flavin absorbance upon OA binding, indicating the pyrimidine-binding site is relatively unperturbed. The mutations also had little effect on the Kd of OA (Table 2), presumably because they are far away from the binding site (9).
However, the reduction potentials of most of the mutants were lower than that of wild-type (Table 1). Reduction potentials report on the differential affinities of the apoenzyme for oxidized and reduced flavin. A decrease in potential could be caused by a tightening of the binding of oxidized FMN to the apoprotein, a weakening of the binding of reduced FMN, or perhaps a bit of each. The largest difference in reduction potentials between mutant and wild-type enzymes was 40 mV (Thr178Ala and Ser175Ala) or 1.8 kcal mol−1, about the strength of a typical hydrogen-bond. It is unclear why this occurs; the residues replaced are far away from the flavin itself (9). Although decisive information is absent, it seems unlikely that these mutations – which disrupt hydrogen-bonds in the protein – would strengthen the binding of oxidized flavin. Therefore we tentatively favor the idea that the mutations have weakened the binding of reduced FMN.
Changes to the reductive half-reaction in the mutant enzymes were quantitative rather than qualitative. In all mutant enzymes, the reduction rate constant was pH-dependent, as it is in wild-type (11). In all mutant enzymes except Ser175Ala (where the active site base was removed), the reduction rate constant increased with increasing pH until a plateau was reached, indicating a pKa. In wild-type, the pKa is ~9.5 (11). However, no structural features exist that could lower the pKa of the active site serine (7–9). In fact, empirical calculations of the perturbation of the pKa by the protein predict a slight increase in the pKa of the base due to the protein environment, rather than a decrease (12). Kinetic isotope effect studies have shown that DHO oxidation in the E. coli DHOD is stepwise (12). The isotope effect contributed by deprotonating C5 disappears at a pH value above the pKa (12), indicating that the observed pKa is a kinetic rather than thermodynamic pKa, caused by the rate of deprotonation becoming so high that it is no longer partially rate-determining.
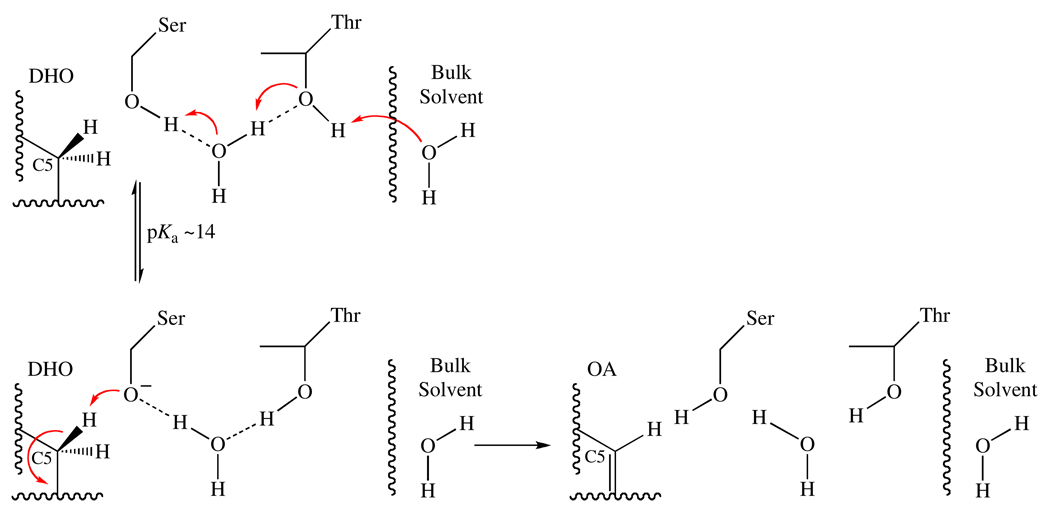
The pH-dependencies of each mutant and the wild-type enzyme fit well to a model in which only the deprotonated enzyme•DHO complex reacts. We have previously proposed that the reactive form of the enzyme is the small fraction of Ser175 in the alkoxide form (12). The data from the current study indicate that the proton-relay network is required to rapidly generate the small amount of alkoxide that is present near neutral pH (Figure 7). In this way, the network decouples proton transfer to solvent from the deprotonation of DHO. This model explains the kinetic pKa on the reduction rate constant. It also explains the lack of a solvent isotope effect on the reaction of the wild-type enzyme; the transfer of the exchangeable protons of the network (each with a fractionation factor expected to be ~1) are not part of the transition state of DHO deprotonation/oxidation. Instead, the exchangeable protons are proposed to move prior to the redox chemistry.
Figure 7.
Proposed Proton Relay in Class 2 DHODs. A small amount of the alkoxide form of Ser175 (the active site base: pKa ≥ 14 (12)) is generated by the proton relay network. The alkoxide form then deprotonates DHO in the redox reaction.
When residues in the proton-relay network were mutated, significant shifts were observed in the pKa values (Table 3). The pKa values observed in these enzymes are kinetic rather than thermodynamic. Above the pKa, the rate constant for deprotonating C5 of DHO has become too fast to be partially-rate determining. Residues were changed to increase or decrease the size of the tunnel and change the hydrophobicity of the tunnel. The higher kinetic pKa values observed in the mutant enzymes imply that deprotonation of the active site base has become less efficient since higher pH values are required to make deprotonation too fast to be partially rate-determining. When either Thr178 or Phe115 were mutated to alanine, the kinetic pKa was nearly one pH unit higher than in wild-type. These mutations would increase the size of the tunnel, giving water more room to move, and thus make the hydrogen-bonding network less ordered. Decreasing the size of the tunnel and increasing the hydrophobicity had even greater effects. In the Thr178Val mutant enzyme, the pKa shifted to ~10.7. Valine is isosteric with threonine, but more hydrophobic. Valine would block the tunnel and its side-chain would presumably need to move to accommodate water and allow proton transfer. An even larger effect is observed in the Phe115Leu mutant enzyme, in which the pKa is shifted to ~11.2. Replacing phenylalanine (an aromatic side-chain) with leucine (an aliphatic side-chain) will increase the hydrophobicity of the local environment markedly. As a model, it is worth noting that the solubility of water in benzene is ~20 mM, while the solubility of water in hexane is ~10-fold lower (28). These data suggest that the mutation makes this area less hospitable for water. Interestingly, in the Phe115Leu/Thr178Val double-mutant enzyme, the values of pKa and kred,limiting were nearly identical to the Thr178Val single-mutant, indicating that mutation of Thr178 is dominant and the residues are not synergistic. Mutation of Phe115 has no effect in the absence of Thr178. This suggests that in the absence of its threonine hydrogen-bonding partner, the water of the proton relay network becomes disordered regardless of the hydrophobicity of its cavity.
Hydrogen-bonding pathways are very important for catalysis in many enzymes. Simulations have shown that the rate of proton transfer through hydrophobic channels can be increased by ~20-fold just by constraining water molecules to a single-file chain (29). Alcohol dehydrogenase contains a proton-relay network responsible for deprotonating water or an alcohol ligated to the catalytic zinc. In this instance, the base, a histidine located at the surface of the enzyme, is connected to the active site zinc ligand via a hydrogen-bond network. When the histidine is replaced with glutamine, the pKa controlling alcohol oxidation is shifted ~3 pH units higher than that in wild-type (30). Proton-relay networks are also known to play a major role in catalysis by cytochromes P450 (31, 32). The important hydrogen-bonding networks contain both water molecules and protein residues. In wild-type crystal structures, well-ordered water molecules can be observed in the hydrogen-bonding networks. This is also seen in Class 2 DHODs. However, in structures of mutant cytochromes P450 in which the hydrogen-bonding networks are perturbed, the water molecules are either not visible or have decreased occupancies, indicating that protein mutations can affect the number and timely availability of water molecules important for catalysis (32, 33).
As mentioned earlier, DHO oxidation by Class 2 DHODs is stepwise and the observed pKa is actually a kinetic pKa (12). Above the pKa, deprotonation is too fast to be partially rate-determining. Thus, the rate constants obtained above the kinetic pKa represent the rate constant of hydride transfer from C6 of DHO to the flavin and should not be sensitive to an intact proton-transfer network. Mutating Phe115 had little effect on kred,limiting (Table 3); above the observed pKa, the rate constant was very high. However, mutation of the Thr178 to either alanine or valine reduced the rate constant observed above the pKa by 2 – 3-fold compared to the wild-type enzyme. This indicates that removing the –OH group from position 178 affects the rate constant of hydride transfer to FMN as well as disordering the hydrogen-bond network. Thr178 is next to Asn177. Asn177, a strictly conserved residue that hydrogen bonds to the carboxylate of DHO, is thought to be responsible in part for orienting DHO for catalysis (18). It is possible that disordering the hydrogen-bond network also partially disorders Asn177, thereby reducing the rate constant of hydride transfer due to improper positioning of DHO.
The pH dependence of flavin reduction was also studied for the Ser175Ala mutant enzyme to investigate the function of the active site base. In this enzyme, reduction was extremely slow and thus was studied at 25 °C to speed the reaction. The reduction rate constant was pH-dependent – as in all other mutants – but there was no observable pKa up to pH 10.5 (Figure 6). The active site base mutant of the Class 1A DHOD from L. lactis (Cys130Ala) has been previously studied at 25 °C (23), allowing the direct comparison with the data presented here. The reduction rate constant of the Ser175Ala mutant enzyme was at least an order of magnitude faster than that of the Cys130Ala mutant enzyme at all pH values investigated. In both these enzymes, a water molecule occupying the cavity opened by mutation likely acts as the base. The Class 2 enzyme is better able to catalyze the reaction without its active site base than the Class 1A enzyme is. This is probably due to the presence of the proton-relay network in Class 2 enzymes, which would be properly positioned to shuttle a proton from the active site, even if it is from a disordered water molecule acting as base.
The reductive half-reaction of DHODs demands a route to remove a proton. Class 1A enzymes, which have much more solvent-exposed active sites, presumably do this by direct reaction with solvent. However, a hydrogen-bonding network is needed to accomplish this in Class 2 DHODs. In these enzymes, the active site serine alone is not sufficient. The entire ordered proton-relay network is needed for the most effective deprotonation of DHO.
Supplementary Material
Footnotes
This work was supported by NIH Grant GM61087 to BAP. RLF was supported by NIGMS training grant GM07767 and University of Michigan Rackham Graduate School Predoctoral Fellowship.
Abbreviations
DHOD, dihydroorotate dehydrogenase
DHO, dihydroorotate
OA, orotate
kred, reduction rate constant
The Phe155Trp mutant enzyme was only studied at two pH values and therefore a pKa value was not obtained.
SUPPORTING INFORMATION AVAILABLE
Flavin CD spectra of oxidized and reduced wild-type and mutant enzymes, pH dependence of apparent Kd,DHO, and the Berkley Madonna global fitting simulation for the reductive half-reaction of the Phe115Leu mutant enzyme at pH 8.5. This material is available free of charge via the Internet at http://pubs.acs.org.
References
- 1.Björnberg O, Rowland P, Larsen S, Jensen KF. Active site of dihydroorotate dehydrogenase A from Lactococcus lactis investigated by chemical modification and mutagenesis. Biochemistry. 1997;36:16197–16205. doi: 10.1021/bi971628y. [DOI] [PubMed] [Google Scholar]
- 2.Jones ME. Pyrimidine nucleotide biosynthesis in animals: genes, enzymes, and regulation of UMP biosynthesis. Annu. Rev. Biochem. 1980;49:253–279. doi: 10.1146/annurev.bi.49.070180.001345. [DOI] [PubMed] [Google Scholar]
- 3.Nagy M, Lacroute F, Thomas D. Divergent evolution of pyrimidine biosynthesis between anaerobic and aerobic yeasts. Proc. Natl. Acad. Sci. U. S. A. 1992;89:8966–8970. doi: 10.1073/pnas.89.19.8966. [DOI] [PMC free article] [PubMed] [Google Scholar]
- 4.Nielsen FS, Andersen PS, Jensen KF. The B form of dihydroorotate dehydrogenase from Lactococcus lactis consists of two different subunits, encoded by the pyrDb and pyrK genes, and contains FMN, FAD, and [FeS] redox centers. J. Biol. Chem. 1996;271:29359–29365. doi: 10.1074/jbc.271.46.29359. [DOI] [PubMed] [Google Scholar]
- 5.Baumgartner R, Walloschek M, Kralik M, Gotschlich A, Tasler S, Mies J, Leban J. Dual binding mode of a novel series of DHODH inhibitors. J. Med. Chem. 2006;49:1239–1247. doi: 10.1021/jm0506975. [DOI] [PubMed] [Google Scholar]
- 6.Hansen M, Le Nours J, Johansson E, Antal T, Ullrich A, Loffler M, Larsen S. Inhibitor binding in a class 2 dihydroorotate dehydrogenase causes variations in the membrane-associated N-terminal domain. Protein Sci. 2004;13:1031–1042. doi: 10.1110/ps.03533004. [DOI] [PMC free article] [PubMed] [Google Scholar]
- 7.Hurt DE, Widom J, Clardy J. Structure of Plasmodium falciparum dihydroorotate dehydrogenase with a bound inhibitor. Acta Crystallogr. D Biol. Crystallogr. 2006;62:312–323. doi: 10.1107/S0907444905042642. [DOI] [PubMed] [Google Scholar]
- 8.Liu S, Neidhardt EA, Grossman TH, Ocain T, Clardy J. Structures of human dihydroorotate dehydrogenase in complex with antiproliferative agents. Structure. 2000;8:25–33. doi: 10.1016/s0969-2126(00)00077-0. [DOI] [PubMed] [Google Scholar]
- 9.Nørager S, Jensen KF, Björnberg O, Larsen S. E. coli dihydroorotate dehydrogenase reveals structural and functional distinctions between different classes of dihydroorotate dehydrogenases. Structure. 2002;10:1211–1223. doi: 10.1016/s0969-2126(02)00831-6. [DOI] [PubMed] [Google Scholar]
- 10.Walse B, Dufe VT, Svensson B, Fritzson I, Dahlberg L, Khairoullina A, Wellmar U, Al-Karadaghi S. The structures of human dihydroorotate dehydrogenase with and without inhibitor reveal conformational flexibility in the inhibitor and substrate binding sites. Biochemistry. 2008;47:8929–8936. doi: 10.1021/bi8003318. [DOI] [PubMed] [Google Scholar]
- 11.Palfey BA, Björnberg O, Jensen KF. Insight into the chemistry of flavin reduction and oxidation in Escherichia coli dihydroorotate dehydrogenase obtained by rapid reaction studies. Biochemistry. 2001;40:4381–4390. doi: 10.1021/bi0025666. [DOI] [PubMed] [Google Scholar]
- 12.Fagan RL, Nelson MN, Pagano PM, Palfey BA. Mechanism of flavin reduction in class 2 dihydroorotate dehydrogenases. Biochemistry. 2006;45:14926–14932. doi: 10.1021/bi060919g. [DOI] [PubMed] [Google Scholar]
- 13.Small YA, Guallar V, Soudackov AV, Hammes-Schiffer S. Hydrogen bonding pathways in human dihydroorotate dehydrogenase. J. Phys. Chem. B. 2006;110:19704–19710. doi: 10.1021/jp065034t. [DOI] [PubMed] [Google Scholar]
- 14.Björnberg O, Gruner AC, Roepstorff P, Jensen KF. The activity of Escherichia coli dihydroorotate dehydrogenase is dependent on a conserved loop identified by sequence homology, mutagenesis, and limited proteolysis. Biochemistry. 1999;38:2899–2908. doi: 10.1021/bi982352c. [DOI] [PubMed] [Google Scholar]
- 15.Palfey BA. Time Resolved Spectral Analysis. In: Johnson KA, editor. Kinetic Analysis of Macromolecules. New York: Oxford Unversity Press; 2003. pp. 203–227. [Google Scholar]
- 16.Williams CH, Jr, Arscott LD, Matthews RG, Thorpe C, Wilkinson KD. Methodology employed for anaerobic spectrophotometric titrations and for computer-assisted data analysis. Methods Enzymol. 1979;62:185–198. doi: 10.1016/0076-6879(79)62217-6. [DOI] [PubMed] [Google Scholar]
- 17.Massey V. A simple method for the determination of redox potentials. In: Curti B, Ronchi S, Zanetti G, editors. Flavins and Flavoproteins. Berlin, Germany: Walter de Gruyter; 1990. pp. 59–66. [Google Scholar]
- 18.Marcinkeviciene J, Jiang W, Locke G, Kopcho LM, Rogers MJ, Copeland RA. A second dihydroorotate dehydrogenase (Type A) of the human pathogen Enterococcus faecalis: expression, purification, and steady-state kinetic mechanism. Arch. Biochem. Biophys. 2000;377:178–186. doi: 10.1006/abbi.2000.1769. [DOI] [PubMed] [Google Scholar]
- 19.Nørager S, Arent S, Björnberg O, Ottosen M, Lo Leggio L, Jensen KF, Larsen S. Lactococcus lactis dihydroorotate dehydrogenase A mutants reveal important facets of the enzymatic function. J. Biol. Chem. 2003;278:28812–28822. doi: 10.1074/jbc.M303767200. [DOI] [PubMed] [Google Scholar]
- 20.Wolfe AE, Thymark M, Gattis SG, Fagan RL, Hu YC, Johansson E, Arent S, Larsen S, Palfey BA. Interaction of benzoate pyrimidine analogues with class 1A dihydroorotate dehydrogenase from Lactococcus lactis. Biochemistry. 2007;46:5741–5753. doi: 10.1021/bi7001554. [DOI] [PubMed] [Google Scholar]
- 21.Zameitat E, Pierik AJ, Zocher K, Loffler M. Dihydroorotate dehydrogenase from Saccharomyces cerevisiae: spectroscopic investigations with the recombinant enzyme throw light on catalytic properties and metabolism of fumarate analogues. FEMS Yeast Res. 2007;7:897–904. doi: 10.1111/j.1567-1364.2007.00275.x. [DOI] [PubMed] [Google Scholar]
- 22.Fagan RL, Palfey BA. Roles in Binding and Chemistry for Conserved Active Site Residues in the Class 2 Dihydroorotate Dehydrogenase from Escherichia coli. Biochemistry. 2009 doi: 10.1021/bi900370s. In Press. [DOI] [PMC free article] [PubMed] [Google Scholar]
- 23.Fagan RL, Jensen KF, Björnberg O, Palfey BA. Mechanism of flavin reduction in the class 1A dihydroorotate dehydrogenase from Lactococcus lactis. Biochemistry. 2007;46:4028–4036. doi: 10.1021/bi602460n. [DOI] [PubMed] [Google Scholar]
- 24.Arakaki TL, Buckner FS, Gillespie JR, Malmquist NA, Phillips MA, Kalyuzhniy O, Luft JR, Detitta GT, Verlinde CL, Van Voorhis WC, Hol WG, Merritt EA. Characterization of Trypanosoma brucei dihydroorotate dehydrogenase as a possible drug target; structural, kinetic and RNAi studies. Mol. Microbiol. 2008;68:37–50. doi: 10.1111/j.1365-2958.2008.06131.x. [DOI] [PMC free article] [PubMed] [Google Scholar]
- 25.Inaoka DK, Sakamoto K, Shimizu H, Shiba T, Kurisu G, Nara T, Aoki T, Kita K, Harada S. Structures of Trypanosoma cruzi dihydroorotate dehydrogenase complexed with substrates and products: atomic resolution insights into mechanisms of dihydroorotate oxidation and fumarate reduction. Biochemistry. 2008;47:10881–10891. doi: 10.1021/bi800413r. [DOI] [PubMed] [Google Scholar]
- 26.Rowland P, Björnberg O, Nielsen FS, Jensen KF, Larsen S. The crystal structure of Lactococcus lactis dihydroorotate dehydrogenase A complexed with the enzyme reaction product throws light on its enzymatic function. Protein Sci. 1998;7:1269–1279. doi: 10.1002/pro.5560070601. [DOI] [PMC free article] [PubMed] [Google Scholar]
- 27.Rowland P, Nørager S, Jensen KF, Larsen S. Structure of dihydroorotate dehydrogenase B: electron transfer between two flavin groups bridged by an iron-sulphur cluster. Structure. 2000;8:1227–1238. doi: 10.1016/s0969-2126(00)00530-x. [DOI] [PubMed] [Google Scholar]
- 28.Wolfenden R, Radzicka A. On the probability of finding a water molecule in a nonpolar cavity. Science. 1994;265:936–937. doi: 10.1126/science.8052849. [DOI] [PubMed] [Google Scholar]
- 29.Voth GA. Computer simulation of proton solvation and transport in aqueous and biomolecular systems. Acc. Chem. Res. 2006;39:143–150. doi: 10.1021/ar0402098. [DOI] [PubMed] [Google Scholar]
- 30.LeBrun LA, Park DH, Ramaswamy S, Plapp BV. Participation of histidine-51 in catalysis by horse liver alcohol dehydrogenase. Biochemistry. 2004;43:3014–3026. doi: 10.1021/bi036103m. [DOI] [PubMed] [Google Scholar]
- 31.Schlichting I, Berendzen J, Chu K, Stock AM, Maves SA, Benson DE, Sweet RM, Ringe D, Petsko GA, Sligar SG. The catalytic pathway of cytochrome P450cam at atomic resolution. Science. 2000;287:1615–1622. doi: 10.1126/science.287.5458.1615. [DOI] [PubMed] [Google Scholar]
- 32.Vidakovic M, Sligar SG, Li H, Poulos TL. Understanding the role of the essential Asp251 in cytochrome P450cam using site-directed mutagenesis, crystallography, and kinetic solvent isotope effect. Biochemistry. 1998;37:9211–9219. doi: 10.1021/bi980189f. [DOI] [PubMed] [Google Scholar]
- 33.Makris TM, von Koenig K, Schlichting I, Sligar SG. Alteration of P450 distal pocket solvent leads to impaired proton delivery and changes in heme geometry. Biochemistry. 2007;46:14129–14140. doi: 10.1021/bi7013695. [DOI] [PubMed] [Google Scholar]
Associated Data
This section collects any data citations, data availability statements, or supplementary materials included in this article.


