

Abstract
Purpose
To investigate the association of white matter signal hyperintensities (WMSHs) with changes in hydrogen-1 metabolites.
Materials and Methods
T2-weighted magnetic resonance (MR) imaging and H-1 MR spectroscopic imaging were performed in 21 elderly control subjects without or with minimal WMSHs, eight elderly subjects with substantial WMSHs, 11 probable Alzheimer disease patients with WMSHs, and eight ischemic vascular dementia (IVD) patients with WMSHs. N-acetylaspartate (NAA), choline-containing metabolites (Cho), and creatine-containing metabolites (Cr) were analyzed.
Results
Differences in regional metabolite levels were found within the supraventricular brain of elderly control subjects. In Alzheimer disease patients, extensive WMSHs showed a lower percentage of NAA and a higher percentage of Cho compared with contralateral normal-appearing white matter (NAWM); in IVD patients, extensive and large WMSHs were associated with a higher percentage of Cho and a lower percentage of Cr compared with contralateral NAWM.
Conclusion
Regional metabolite variation and the presence of WMSHs are important covariants that must be accounted for in analysis of MR spectroscopic data.
Index terms: Brain, atrophy, 10.83; Brain, diseases, 10.781; Brain, ischemia, 10.781; Brain, MR, 10.12145; Brain, white matter, 10.12145; Dementia, 10.781, 10.83
Magnetic resonance (MR) imaging of unselected patients over the age of 60 years shows regions of white matter with high signal intensity (ie, white matter signal hyperintensities [WMSHs]) in the periventricular areas and deep white matter of 25%–50% of patients (1–6). Computed tomography shows similar lesions as areas of low attenuation, termed leukoaraiosis (7–10). Because these WMSHs are found in the end and border zones of arterial perfusion, it has been suggested that they reflect an underlying ischemic process (11,12). WMSHs commonly occur in apparently healthy, cognitively unimpaired elderly control subjects (13). However, the findings that WMSHs are more prevalent in patients with cerebral vascular disease or ischemic vascular dementia (IVD) (14,15) and Alzheimer disease (16–18) and depression (19–21) suggest that these lesions may represent a pathologic process (11,12) and may be an important covariant in neurologic imaging studies of dementia.
Previously, this laboratory used MR spectroscopy together with MR imaging to investigate metabolic changes in the brain associated with WMSHs. By using a “single volume” phosphorus-31 MR spectroscopy technique, Sappey-Marinier et al (22) found the ratio of adenosine triphosphate (ATP) to inorganic phosphate to be 26% lower and the ATP concentration to be 21% lower in white matter regions with extensive WMSHs compared with regions with no or minimal WMSHs. These results were consistent with the view that WMSHs indicate an ischemic process affecting cellular energy metabolism. In a subsequent study with a single-volume hydrogen-1 MR spectroscopy technique, Sappey-Marinier et al found that WMSHs exhibit increased signal from choline-containing metabolites (Cho) (23). No increase in lactate was detected, and there was no evidence of substantial loss of the neuronal marker N-acetylaspartate (NAA). However, a limitation of these two previous studies was the use of the single-volume MR spectroscopy technique to investigate a process that has a patchy distribution throughout white matter regions. MR spectroscopic imaging (MRSI) uses phase encoding for detection of metabolites from multiple regions over a wide field of view during a single set of measurements (24–26). Constans et al (27) used H-1 and P-31 MRSI to investigate changes in H-1 and phosphorus metabolites in WMSHs and normal-appearing white matter (NAWM) of cognitively normal elderly subjects. These measurements demonstrated a statistically significant higher percentage of Cho in WMSHs, accompanied by a nonsignificant trend toward lower NAA levels. No statistically significant changes were detected for P-31 metabolites. The apparent discrepancies between our two P-31 MR studies of WMSHs (22,27) were discussed in reference 27.
The present study is a direct continuation of previous work performed in this laboratory. The overall goal of this work was to determine the metabolite changes associated with WMSHs, and the changes associated with different diseases. The specific aim of the present study was to determine the H-1 metabolite changes in WMSHs of patients with various types of senile dementia. Because previous studies have suggested that there are regional changes in these metabolites in normal brain (28,29), measurements were made of the regional distribution of H-1 metabolites in brains of cognitively normal elderly subjects without WMSHs. These measurements were then used to control for the regional differences in the locations of WMSHs in brains of patients.
Materials and Methods
Subjects
All subjects gave informed consent (approved by the Committee on Human Research at the University of California, San Francisco) before the study. Thirty subjects from an elderly control population recruited from the community were screened by means of clinical examination and self-report and excluded if they had any evidence of cerebrovascular occlusive disease or neurologic, psychiatric, cognitive, respiratory, and alcohol or substance abuse disorders (one subject was excluded). Subjects with hypertension (four in the WMSH group), transient ischemic attack (one in the WMSH group), or diabetes (one in the WMSH group) were not excluded. Twenty-three subjects with dementia were referred by the Alzheimer Center of the University of California, San Francisco. Diagnosis was based on criteria from the National Institute of Neurologic and Communicative Diseases and Stroke–Alzheimer's Disease and Related Disorders Association. IVD criteria (described by Chui et al [30]) required impairments in at least two different areas of mental functioning and lacunar infarcts outside the cerebellum. The diagnoses and findings were as follows: 11 subjects with probable Alzheimer disease and WMSHs at MR imaging, two with possible Alzheimer disease, eight with IVD and WMSHs at MR imaging, and two with mixed IVD and Alzheimer disease. All subjects received a neuropsychologic work-up, including the Mini Mental State Examination (MMSE) (31), the Neurobehavioral Cognitive Status Examination (NCSE) (32), and the Blessed test (32,33).
On the basis of the determination of WMSHs at MR imaging (grading scale in next section), the subjects were classified into five MR imaging/MRSI study groups:
The control group consisted of 21 elderly subjects without dementia (12 men, nine women), without WMSHs (eight with grade 0 or 1) or with minimal WMSHs (13 with grade 2). The mean age of this group was 68.0 years ± 6.2. Eight of these subjects had been included in a previous study (27).
The WMSH group consisted of eight subjects without dementia (four men, four women) with grade 3 or 4 WMSHs at MR imaging. The mean age of this group was 72.4 years ± 7.9. Six of these subjects had been included in a previous study (27).
The ADG3 group consisted of five probable Alzheimer disease patients (two men, three women) with grade 3 WMSHs. The mean age of this group was 72.8 years ± 8.7.
The ADG2 group consisted of six probable Alzheimer disease patients (two men, four women) with grade 2 WMSHs. The mean age of this group was 75.3 years ± 4.6. Two possible Alzheimer disease patients were not included in the MRSI data analysis.
The IVD group consisted of eight patients (three men, five women) with grade 3 or 4 WMSHs. The mean age of this group was 73.1 years ± 9.2. The two subjects with mixed vascular dementia and probable Alzheimer disease were not included in the MRSI data analysis.
The mean age of the control group was 4 years less than that of any of the dementia groups. Statistical analysis of subjects pooled from all disease groups and controls showed no significant effects of age on any of the variables.
MR Data Acquisition
MR Imaging
All MR experiments were performed with a Gyroscan MR imaging/MR spectroscopy 2.0-T system (Philips Medical Systems, Shelton, Conn) operating at 85.95 MHz for H-1. The same Philips H-1 head coil was used for both MR imaging and H-1 MRSI, which made it unnecessary to reposition the patient between the MR imaging and MRSI parts of the study.
Standard MR imaging of the brain included sagittal T1-weighted spin-echo imaging (repetition time [msec]/echo time [msec] = 450/30, section thickness = 7 mm, and intersection gap = 3.5 mm) and axial T2-weighted double-spin-echo imaging (3,000/30, 80, section thickness = 5.1 mm, and intersection gap = 0.5 mm). The axial imaging plane was approximately 10° beyond the orbitomeatal plane toward coronal orientation to maximize B0 homogeneity of the volume studied with H-1 MRSI. MR images were interpreted by a neuroradiologist (D.N.) blinded to each subject's diagnosis, who graded both ventricular and sulcal atrophy (absent = 0, mild or suspicious = 1, moderate or definite = 2, and marked = 3) and the extent of WMSHs (4) (no WMSHs = grade 0, WMSHs limited to the tips of the frontal horns of the lateral ventricles = grade 1, small WMSHs in the subependymal or subcortical region = grade 2, extensive subependymal and discrete separate WMSHs = grade 3, and large and coalescing foci = grade 4). This scale is not continuous in that there is a great difference between grades 2 and 3. Subjects with just a few punctate WMSHs in the white matter, with maximum diameters of a few millimeters, were classified as having grade 2 WMSHs.
H-1 MRSI
The volume of interest (VOI) for H-1 MRSI was selected from the axial images and corroborated on the sagittal image. A 17-mm-thick axial MRSI section, corresponding spatially to a stack of three contiguous oblique MR imaging sections (total thickness = 3 × 5.6 mm = 16.8 mm) was selected. A rectangular VOI within the brain was selected to exclude acquisition of lipid signal from the scalp and subcutaneous fat. The anteroposterior and left-right dimensions of the VOI were adjusted for every subject according to brain size and were generally about 110 mm in the anteroposterior direction and 90 mm in the left-right direction (see superimposed blue rectangle within the brain on Figs 1 and 2). In all groups the VOI was centered at the level of the centrum semiovale, except in the WMSH group, in which the VOI was centered on the largest WMSHs, which were most frequently located just below the centrum semiovale.
Figure 1.

Proton-density summed MR image (3,000/30) and H-1 MR spectra from a representative control subject. The summed MR image covers approximately the same section thickness (16.8 mm) as the MRSI section (17 mm) from which the spectra were obtained. The red square identifies the field of view used for H-1 MRSI, while the blue rectangle corresponds to the PRESS VOI selected for MR spectroscopy. The squares and numbers superimposed on the MR image identify the size and position of individual H-1 MRSI voxels from which spectra (also numbered) were obtained. The six spectra from these regions were analyzed for the determination of regional metabolite distributions in elderly control subjects.
Figure 2.
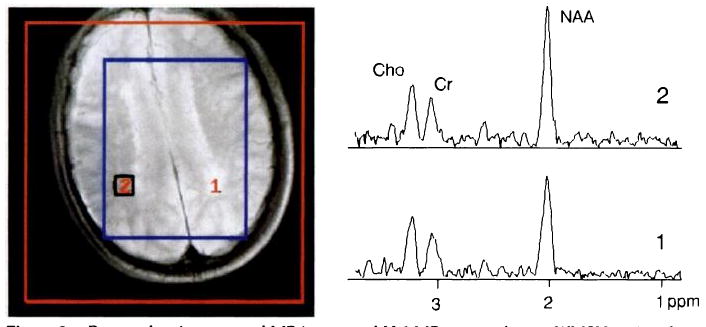
Proton-density summed MR image and H-1 MR spectra from a WMSH region (bottom spectrum) and from a contralateral NAWM region (top spectrum) in a subject without dementia but with extensive WMSHs. Keys are as in Figure 1. The bottom spectrum reveals lower signal intensity from N-acetyl-containing metabolites (primarily NAA) relative to both Cho and Cr than the top spectrum. The group means for both of these ratios, however, were not significantly different from those of the control subjects.
The magnet was first shimmed on the H-1 water signal of the entire head to a line width of about 15 Hz (0.17 parts per million [ppm] at 85.95 MHz) and then on the localized VOI to approximately 6 Hz (0.07 ppm). For H-1 MRSI (2,000/272), a two-dimensional version of an MRSI sequence with point-resolved spatially localized spectroscopy (PRESS) VOI preselection within the head was used (34) to exclude acquisition of lipid signal from the scalp and subcutaneous tissue. Before data acquisition, gradients were tuned and water suppression was optimized as described previously (34). Phase-encoding gradients with 16 increments in each direction were applied over a field of view of typically 180 × 180 mm, encompassing the entire head (see superimposed red square on Figs 1 and 2). This resulted in a nominal in-plane resolution of 11 mm and a nominal MRSI voxel size of approximately 2.2 mL. Four signals were averaged per phase-encoding step, so that the total acquisition time for one data set was 34 minutes. The entire MR imaging and MRSI examination took 90–110 minutes.
MR Data Analysis
Data processing
MR imaging and MRSI data were transferred to a MicroVAX workstation (Digital Equipment, Maynard, Mass) for further analysis with home-written spectroscopic image and display software (35). The H-1 MRSI data set was interpolated to 32 points in both spatial dimensions. Mild Gaussian smoothing was used in the spatial domain, which decreased the nominal in-plane resolution of a voxel to approximately 13 mm, and an exponential line broadening of 1 Hz was used in the time domain. After multidimensional Fourier transformation, the H-1 metabolite images were automatically spatially co-registered with the corresponding three summed oblique T2-weighted MR imaging sections, and spectra were displayed and analyzed in magnitude mode.
Voxel selection
For spatial selection of the H-1 MRSI voxels to be analyzed, the summed MR image obtained from the three T2-weighted MR imaging sections corresponding to the MRSI section was used exclusively. The effective voxel size (after zero-filling of missing k-space points and after Gaussian smoothing) was approximately 3 mL. Voxels were selected by a neuroradiologist (J.M.C.) and verified by another neuroradiologist (D.N.) for data analysis.
To determine if there were regional differences in metabolites in brains of elderly control subjects with no or minimal WMSHs, we extracted and analyzed spectra obtained from one voxel each in the left and right hemispheres in anterior, middle, and posterior regions of the VOI. Since no left-right differences were detected, these values were averaged, yielding a mean value for the anterior, middle, and posterior parts of the MRSI section.
For the patients with WMSHs (grade 3 or 4), MRSI voxels were selected to include as much of a WMSH as possible. The largest lesions were most frequently in the posterior (parietal) region of the centrum semiovale (immediately above the corpus callosum), in the periventricular region for the WMSH group, in the anterior region for IVD patients, and in the middle region for the probable Alzheimer disease subjects. MRSI voxels from the WMSHs of the subjects without dementia were filled completely with abnormal-appearing white matter, voxels from WMSHs of the IVD group had a filling factor of approximately 80%, whereas voxels from the ADG2 and ADG3 groups were filled to approximately 30% and 60%, respectively, with abnormal-appearing white matter. We also selected MRSI voxels contralateral to the WMSH in a location of NAWM that was exactly opposite to the WMSH or as close as possible to an exactly opposite position in the other brain hemisphere.
Spectral analysis
For further analysis, the extracted spectra were transferred to a Sun 3/60 workstation (Sun Microsystems, Mountain View, Calif) equipped with NMR1 software. They were then fitted by an operator blinded to the origin of the spectra and the severity of the disease. After manual setting of the baseline midway through the noise, three Gaussian peaks were fitted to the three major resonances in the spectra (Cho, creatine-containing metabolites [Cr], and NAA). Convergence was usually achieved after less than 15 iterations. Individual signal integrals were used to calculate metabolite signal ratios and metabolite percentages (metabolite percentage [%metabolite] is defined as the signal intensity integral of a metabolite divided by the sum of all metabolite signal intensity integrals).
Statistical Analysis
Mean values and standard errors of six metabolite measures (%NAA, %Cho, %Cr, NAA/Cho, NAA/Cr, and Cho/Cr) were computed in each disease group for six brain subregions (anterior, middle, and posterior in the left and right hemispheres). Also, the following statistical analyses were performed.
Effects of hemisphere, region, sex, age, and WMSH grade
To determine whether there were systematic differences in metabolite concentrations in the control group between hemispheres (left and right), between regions (anterior, middle, and posterior), or by sex, age, or WMSH grade, repeated-measures multivariate analysis of variance (ANOVA) was applied by using BMDP Program 4V (BMDP, Los Angeles, Calif). The dependent variables were the six metabolite measures (%NAA, NAA/Cho, NAA/Cr, %Cho, %Cr, Cho/Cr); side, region, and sex were grouping variables, and WMSH grade and age were covariants.
Effects of WMSHs
To determine whether in any of the disease groups there was a significant decrease in %NAA, NAA/Cho, NAA/Cr, and %Cr and a significant increase in %Cho and Cho/Cr on the WMSH side compared with the contralateral NAWM side, nonparametric paired Wilcoxon tests were applied with the SPLUS statistical system (Statistical Sciences, Seattle, Wash).
Group effects
To determine whether metabolite levels on the WMSH side or the contralateral side in any of the disease groups were substantially different from those in the control group (we hypothesized that %NAA, NAA/Cho, NAA/Cr, and %Cr would be smaller and %Cho and Cho/Cr larger on both the WMSH and NAWM sides than in control subjects), repeated-measures ANOVA with missing data was applied for each disease group, with BMDP Program 5V. Because BMDP Program 5V does not perform multivariate ANOVA, a separate repeated-measures ANOVA was done with each of the six metabolite measures as the dependent variable and disease status (normal or abnormal) and brain regions as the independent variables (thus, this analysis adjusts for regional differences). Missing-data methods (36) were used to adjust for the presence of more spectra for the control subjects than for the disease groups. For the control subjects, anterior, middle, and posterior spectra on both the left and right side were available, while for the patients, only a spectrum from the largest WMSH and a spectrum from the homologous location in the contralateral NAWM were present.
A χ2 test with Yates correction was used to compare the MR imaging grades for ventricular dilatation and sulcal widening between groups.
Standard correlations and linear regression were performed to study the relationship between metabolic values (%Cho, %NAA, and NAA/Cho), morphologic grades (ventricular dilatation, sulcal widening, and WMSH grades), and neuropsychologic tests (MMSE and NCSE scores).
All values are expressed as mean plus or minus one standard error, and P < .05 was considered statistically significant.
Results
MR Imaging and Neuropsychologic Data
The results of the MR imaging and neuropsychologic tests are listed in Table 1. The mean WMSH grade for the control group was 1.4 ± 0.2. The mean grade for subjects without dementia but with WMSHs was 3.4 ± 0.2. Subjects in the two Alzheimer disease groups had grades of 2 and 3. The IVD group had a mean grade of 3.5 ± 0.2.
Table 1. Description of Subjects: MR imaging Grades and Neuropsychologic Test Scores.
| MR Imaging Grade | Neuropsychologic Scores | ||||
|---|---|---|---|---|---|
| Group | WMSH | VD | SW | MMSE | Blessed |
| Control (n = 21) | 1.4 ± 0.2 | 0.2 ± 0.1 | 0.6 ± 0.2 | 29.4 ± 0.2 | 32.3 ± 0.2 |
| WMSH (n = 8) | 3.4 ± 0.2 | 1.4 ± 0.5 | 1.1 ± 0.4 | 28.5 ± 0.4 | 25.5 ± 0.9 |
| ADG2 (n = 6) | 2.0 ± 0.0 | 0.3 ± 0.3 | 0.3 ± 0.2 | 18.0 ± 2.3 | 16.7 ± 2.0 |
| ADG3 (n = 5) | 3.0 ± 0.0 | 1.4 ± 0.6 | 1.4 ± 0.6 | 12.6 ± 2.3 | 13.5 ± 1.3 |
| IVD (n = 8) | 3.5 ± 0.2 | 1.0 ± 0.3 | 1.0 ± 0.3 | 18.0 ± 2.4 | 16.4 ± 2.7 |
Note.—Values are mean ± standard error of the mean. IVD = patients with ischemic vascular dementia grades 3 and 4 with WMSHs on MR images, SW = sulcal widening, VD = ventricular dilatation, WMSH = Patients without dementia with grades 3 and 4 WMSHs on MR images.
Subjects with WMSHs but without dementia had considerable ventricular dilatation (grade = 1.4 ± 0.5). The ADG2 group had minimal ventricular dilatation (grade = 0.3 ± 0.3), while the ADG3 group showed marked ventricular dilatation (grade = 1.4 ± 0.6). The ventricular dilatation grade in the Alzheimer disease group (ADG2 and ADG3 subjects together) correlated significantly with the WMSH grade (r = .5, P = .05). The IVD group also showed ventricular dilatation (grade = 1.0 ± 0.3). In most groups, the sulcal widening grade was similar to the corresponding ventricular dilatation grade.
The neuropsychologic data show that subjects without dementia but with WMSHs had lower Blessed scores than control subjects without WMSHs. The ADG2 group had markedly diminished MMSE and Blessed scores, and these scores were even lower in the ADG3 group. Scores for the IVD group were similar to those of the ADG2 patients.
Figure 1 shows an MR image and single-voxel H-1 MRSI spectra obtained from different brain regions of an elderly control subject. Figure 2 shows an MR image and H-1 MRSI spectra from a subject without dementia but with extensive WMSHs. The single-voxel spectra displayed were from regions of WMSH and NAWM.
Regional Metabolite Changes in Brains of Elderly Control Subjects
H-1 metabolite percentage and ratio data obtained from anterior, middle, and posterior brain regions of 21 elderly control subjects with grades 0–2 WMSHs are listed in Table 2. Percentage NAA in the anterior region (55% ± 1) was significantly less (P < .01) than in the middle region (58% ± 1). In contrast, %Cho was significantly greater (P < .001) in the anterior region (29% ± 1) than in the middle (25% ± 1) or posterior (24% ± 1) regions. Percentage Cr was higher in the posterior region (19% ± 0) than in the anterior region (P < .01). NAA/Cho was lower in the anterior (1.93 ± 0.09) than in the middle (2.41 ± 0.10) and posterior (2.38 ± 0.08) regions (P < .001). NAA/Cr was lower in the posterior region (2.96 ± 0.07) than in the anterior (3.39 ± 0.12) and middle (3.56 ± 0.14) regions (P < .01). Cho/Cr was highest in the anterior region (1.82 ± 0.09) and lowest in the posterior region (1.27 ± 0.05) (P < .001). These results demonstrate that there were statistically significant regional differences in these metabolites in the control subjects. For this reason, the analysis of changes in regions presented below used repeated-measures ANOVA to adjust for regional differences in brain metabolites.
Table 2. H-1 Metabolite Percentages and Ratios from Spectra of Anterior, Middle, and Posterior Regions in 21 Control Brains in Elderly Patients with Grade 0, 1, or 2 WMSHs.
| Region | Total H-1 Signal (Arbitrary Units) | %NAA | %Cho | %Cr | NAA/Cho | NAA/Cr | Cho/Cr |
|---|---|---|---|---|---|---|---|
| Anterior | 0.50 ± 0.04 | 55 ± 1* | 29 ± 1† | 16 ± 1* | 1.93 ± 0.09† | 3.39 ± 0.12‡ | 1.82 ± 0.09† |
| Middle | 0.53 ± 0.05 | 58 ± 1 | 25 ± 1§ | 17 ± 1 | 2.41 ± 0.10§ | 3.56 ± 0.14 | 1.51 ± 0.06* |
| Posterior | 0.48 ± 0.04 | 57 ± 1 | 24 ± 1 | 19 ± 1‖ | 2.38 ± 0.08 | 2.96 ± 0.07‖ | 1.27 ± 0.05# |
Note.—Values are mean ± standard error of the mean.
P < .01 between anterior and middle by repeated-measures multivariate ANOVA.
P < .001 between anterior and posterior by repeated-measures multivariate ANOVA.
P < .01 between anterior and posterior by repeated-measures multivariate ANOVA.
P < .001 between anterior and middle by repeated-measures multivariate ANOVA.
P < .05 between middle and posterior by repeated-measures multivariate ANOVA.
P <,01 between middle and posterior by repeated-measures multivariate ANOVA.
H-1 Metabolites in WMSH and Contralateral NAWM Regions for Different Disease Groups
Percentage metabolite and metabolite ratio data for WMSH and contralateral NAWM regions for the different patient groups are listed in Table 3. For subjects without dementia but with WMSHs, there were no statistically significant differences between the WMSH and NAWM regions. Similarly, for the ADG2 patients, there were no significant differences between WMSH and NAWM regions. In contrast, ADG3 patients showed statistically significant changes in WMSH regions compared with NAWM regions: %NAA was lower (54% ± 2 vs 58% ± 2) (P < .05), %Cho was higher (27% ± 1 vs 23% ± 2) (P < .05), NAA/Cho was lower (2.03 ± 0.16 vs 2.64 ± 0.26) (P < .05), and Cho/Cr was higher (1.47 ± 0.10 vs 1.24 ± 0.13) (P < .05).
Table 3. H-1 Metabolite Percentages and Ratios from Spectra of WMSH and Contralateral NAWM Regions in Different Diseases with WMSHs.
| % NAA | % Cho | % Cr | NAA/Cho | NAA/Cr | Cho/Cr | |||||||
|---|---|---|---|---|---|---|---|---|---|---|---|---|
| Group | WMSH | NAWM | WMSH | NAWM | WMSH | NAWM | WMSH | NAWM | WMSH | NAWM | WMSH | NAWM |
| WMSH | 54 ± 1 | 55 ± 1 | 28 ± 1 | 27 ± 1 | 18 ± 1 | 18 ± 1 | 1.97 ± 0.10 | 2.06 + 0.14 | 3.12 ± 0.25 | 3.09 ± 0.11 | 1.62 ± 0.14 | 1.56 ± 0.14 |
| ADG2 | 51 ± 4* | 57 ± 3 | 32 ± 5† | 25 ± 2 | 17 ± 2 | 18 ± 1 | 1.86 ± 0.32 | 2.43 ± 0.28 | 3.25 ± 0.32 | 3.27 ± 0.44 | 2.32 ± 0.68 | 1.36 ±0.09 |
| ADG3 | 54 ± 2‡ | 58 ± 2 | 27 ±1‡ | 23 ± 2† | 19 ± 1† | 19 ± 1 | 2.03 ± 0.15‡ | 2.64 ± 0.26 | 2.92 ± 0.15 | 3.16 ± 0.27 | 1.47 ± 0.10*‡ | 1.24 ± 0.13 |
| IVD | 51 ± 2† | 53 ± 1 | 31 ± 2†‡ | 27 ± 1 | 17 ± 1*‡ | 20 ±1 | 1.75 ± 0.20 | 2.00 ± 0.07 | 3.09 ± 0.25* | 2.66 ± 0.11 | 1.90 ± 0.20†§ | 1.34 ± 0.06 |
Note.—Values are mean ± standard error of the mean; statistical significances were adjusted far regional difference as stated in Materials and Methods. IVD = Patients with ischemic vascular dementia with grades 3 and 4 WMSHs on MR images, WMSH = patients without dementia with grades 3 and 4 WMSHs on MR images.
P < .01 between disease and elderly control groups (regional mean values in Table 2) (repeated-measures ANOVA adjusted for missing data).
P < .05 between disease and elderly control groups (regional mean values in Table 2) (repeated-measures ANOVA adjusted for missing data).
P < .05 between WMSH and NAWM regions (paired Wilcoxon test).
P < .01 between WMSH and NAWM regions (paired Wilcoxon test).
Patients with IVD also had statistically significant changes in WMSH regions compared with NAWM regions: %Cho was higher (31% ±2 vs 27% ± 1) (P < .05), %Cr was lower (17% ± 1 vs 20% ± 1) (P < .05), and Cho/Cr was higher (1.9 ± 0.2 vs 1.34 ± 0.06) (P < .01). No statistically significant ratio differences between WMSH and contralateral NAWM regions were seen in the WMSH and ADG2 patients. No lactate was detected in any of the spectra from WMSH or NAWM regions.
Comparisons of H-1 Metabolites in WMSH and NAWM Regions between Disease and Control Groups
Tables 2 and 3 also show the statistical significance of comparisons between WMSH and NAWM regions in disease groups and similar regions in control subjects without dementia. Statistical testing was performed with repeated-measures ANOVA (with disease status and region as the independent variables) adjusted for missing data as described in Materials and Methods. When the WMSHs in subjects with disease were compared with similar regions in control subjects, significant differences were observed in the following groups: In the ADG2 group, WMSHs showed a significant reduction in %NAA (P < .01) and a significant increase in %Cho (P < .05); in the ADG3 group, WMSHs showed a significant increase in %Cr (P < .05) and a decrease in Cho/Cr (P < .01). The WMSHs in the IVD group showed significant reductions in %NAA (P < .01) and NAA/Cr (P < .01), a significant increase in %Cho (P < .05), a significant increase of Cho/Cr (P < .05), and a significant change in %Cr (P < .01) compared with the control subjects. In NAWM regions of the ADG3 group, %Cho was significantly decreased relative to the control subjects (P < .05).
Discussion
The major findings in these experiments were the following: (a) statistically significant differences in regional metabolite levels in elderly control subjects, (b) significant differences in H-1 metabolite levels in WMSH regions relative to contralateral NAWM regions in the ADG3 and IVD groups, (c) no significant changes in metabolite levels in the large and extensive WMSHs of control subjects without dementia relative to their contralateral NAWM regions, and (d) significant differences in metabolite levels between the disease and control groups.
The results in Table 2 demonstrate that the distribution of metabolites is different in different brain regions of elderly control subjects with grades 0–2 WMSHs. NAA and Cr signal intensity was greater in the posterior region of the brain, while Cho signal intensity was greater in the anterior region. These changes could not be due to B1 field inhomogeneities of the radio-frequency coil, because any coil inhomogeneity would affect metabolite resonances in a given voxel equally and thus could not explain the observed regional differences in metabolite ratios in the control subjects. Also, these differences in ratios cannot be due to partial-volume effects of cerebrospinal fluid and tissue, because these effects would change all metabolite values in the same proportion. Previously, this laboratory (28) and other investigators (29) have shown similarly different metabolite distributions throughout the brain. These results emphasize that regional effects must be accounted for in any comparison of brain metabolites between a disease population and control subjects. Therefore, to account for regional differences in this analysis, a repeated-measures ANOVA with missing data was applied to each patient group.
The second major finding of this study was that in the ADG3 and IVD groups, WMSHs were associated with statistically significant changes in metabolite levels relative to the contralateral NAWM region. In both groups, %Cho and Cho/Cr were higher in WMSHs than in the contralateral NAWM region. Also, in the ADG3 group, %NAA and NAA/Cho were lower in the WMSHs than in the contralateral NAWM region. Findings in ADG2 patients showed a similar trend, which was not significant. Since NAA is considered to be a neuronal marker (37–40), a reduced NAA level is consistent with the view that WMSHs in Alzheimer disease are associated with decreased neuronal and/or axonal density. Presumably, an increased %Cho in WMSHs reflects changes in membrane lipids (41). The importance of this finding is that WMSHs must be considered in the analysis of data obtained from brains of elderly subjects with dementia or other diseases. For example, if it is found that in Alzheimer disease patient metabolite levels are significantly different than in control subjects, it may be that the Alzheimer disease brains have more severe WMSHs, which correlate with the metabolite changes. The WMSHs in Alzheimer disease may (or may not) be due to pathologic processes that are independent of the Alzheimer disease process. Therefore, it is necessary to control for WMSHs to determine with certainty whether Alzheimer disease or other disease processes are responsible for causing metabolic changes.
Table 3 shows that there were no statistically significant metabolite differences between the WMSHs and the contralateral NAWM side in the group without dementia. These results confirm our previous findings obtained in a smaller cohort of subjects (27). However, the present data fail to confirm our previous finding of a statistically significant higher %Cho in WMSHs of the WMSH group and control subjects (27). The trends for reduced %NAA and NAA/Cho in the WMSHs of the WMSH group compared to NAWMs in control subjects support our earlier findings (27). A study of a larger number of elderly subjects without dementia but with WMSHs may establish statistical significance for these trends, because the magnitude of the changes is small.
No statistically significant changes between WMSH and NAWM regions in the ADG2 group were found. However, Table 3 suggests a statistical trend toward %NAA reduction and %Cho increase in the WMSHs of the ADG2 group. Therefore, statistically significant changes in the ADG3 group represent a pattern similar to that of the ADG2 group and to that of elderly subjects without dementia but with WMSHs.
The factors responsible for changes in metabolite levels in brain regions associated with WMSHs are uncertain. The most likely possibility is that WMSHs represent pathologic changes produced by ischemia and/or infarction (3,11,12,42–47). Neuron loss, which has been reported in these regions (3,11,12,42–47), is likely responsible for diminished NAA levels. Changes in cell composition (eg, gliosis) or in cell metabolism may be responsible for changes in other metabolites. There are many reports of increased lactate in human brain regions associated with stroke (34,48–50), and there was a recent report of increased lactate in five of 13 patients with WMSHs (see below) (47). In contrast, in two previous reports from this laboratory (23,27) and in the present study, lactate was not observed; this suggests that ongoing ischemia is not occurring in WMSHs. A second explanation for the metabolic changes in WMSHs is that WMSHs do not represent a specific pathologic process; rather, it is possible that WMSHs in patients with Alzheimer disease (16–18) are secondary to the underlying pathologic process, while the WMSHs in IVD (14,15) are secondary to ischemia and/or infarction. For example, lesions associated with multiple sclerosis (which differ pathologically from WMSHs in elderly brain) are also associated with diminished NAA levels and increased Cho levels (51,52). Therefore, the metabolic changes detected with H-1 MRSI are not highly specific and do not necessarily identify specific disease processes.
Recently, Oppenheimer et al (47) reported an H-1 MR spectroscopy study of asymptomatic WMSHs. That study differed from the present work because none of the patients had dementia and four patients had experienced a previous stroke. Furthermore, that study used the single-volume PRESS method (47) to obtain spectra from the WMSHs. The results showed reduced NAA levels in the WMSHs relative to normal control brains, similar to the results in the present study. In contrast to the present study and to previous work from this laboratory (23,27), Oppenheimer et al (47) found increased lactate in WMSHs of five of the 13 patients. This difference may be due to inclusion of patients with clinically significant carotid artery disease (47).
In addition to the partial-volume problems discussed above, there are several limitations to the present study. First, metabolite levels are reported as relative, not absolute, values. Molar quantitation of H-1 MRSI data has been described, but its application to clinical studies has been limited (48,49). It is therefore possible that WMSHs are associated with a global decrease in metabolite concentrations. Second, the H-1 MRSI technique that was used measured metabolite levels only in a single section, limiting the study of WMSHs to the region of the centrum semiovale. Recently, multisection echo-planar MRSI that increases the brain volume under observation and reduces data acquisition times was reported (53). In the future, such multisection techniques should be useful for evaluating most of the brain in a single experiment. A third limitation is that in these studies, an echo time of 272 msec was used. Other investigators have reported initial results with H-1 MRSI techniques at echo times as short as 20 msec (54). Shorter echo times provide higher signal-to-noise ratios and allow detection of metabolites other than NAA, Cho, and Cr (55).
Notwithstanding these limitations, the results show that in Alzheimer disease patients with grade 3 WMSHs and in IVD patients with grade 3 and 4 WMSHs, the WMSHs are associated with statistically significant H-1 metabolite changes. Therefore, the results establish that the presence of WMSHs is an important covariant that must be accounted for in the analysis of MR spectroscopy data obtained from elderly subjects.
Abbreviations
- ANOVA
analysis of variance
- Cho
choline-containing metabolites
- Cr
creatine-containing metabolites
- IVD
ischemic vascular dementia
- MMSE
Mini Mental State Examination
- MRSI
magnetic resonance spectroscopic imaging
- NAA
N-acetylaspartate
- NAWM
normal-appearing white matter
- PRESS
point-resolved spatially localized spectroscopy
- VOI
volume of interest
- WMSH
white matter signal hyperintensity
Footnotes
Magnetic Resonance Spectroscopy Unit (114M) (J.M.C., D.J.M., M.W.W.) and Psychiatry Service (G.F., S.M.), Department of Veterans Affairs Medical Center, 4150 Clement St, San Francisco, CA 94121; and the Departments of Radiology (J.M.C., D.J.M., J.G., M.W.W., D.N.), Medicine (M.W.W.), and Psychiatry (G.F., S.M., M.W.W.), University of California, San Francisco, Calif. Supported by the French Radiologic Society and the French Ligue contre le Cancer, G.F. supported by the National Institute of Mental Health grant MHAZ 5 401 MH45680 and the DVA Medical Research Service, M.W.W. supported by National Institute of Aging grant R01AG10897 and the DVA Medical Research Service, and S.M. supported by a DVA Fellowship in Biological Psychiatry
References
- 1.Bowen BC, Barker WW, Loewenstein DA, Sheldon J, Duara R. MR signal abnormalities in memory disorder and dementia. AJNR. 1990;11:283–290. [PMC free article] [PubMed] [Google Scholar]
- 2.Bradley WG, Waluch V, Brant-Zawadski M, Tadley RA, Wycoff RR. Patchy, periventricular white matter lesions in the elderly: a common observation during NMR imaging. Noninvasive Med Imaging. 1984;1:35–41. [Google Scholar]
- 3.Braffman B, Zimmerman R, Trojanowski J, Gonatas N, Hickey W, Schlaepfer W. Brain MR: pathologic correlation with gross and histopathology. II. Hyperintense white-matter foci in the elderly. AJR. 1988;151:559–566. doi: 10.2214/ajr.151.3.559. [DOI] [PubMed] [Google Scholar]
- 4.Brant-Zawadski M, Fein G, Van Dyke C, Kierman R, Davenport L, de Groot J. Magnetic resonance imaging of the aging brain: patchy white matter lesions in dementia. AJNR. 1985;6:675–682. [PMC free article] [PubMed] [Google Scholar]
- 5.Drayer BP. Imaging of the aging brain. I. Normal findings. Radiology. 1988;166:785–796. doi: 10.1148/radiology.166.3.3277247. [DOI] [PubMed] [Google Scholar]
- 6.Wahlund LO, Andersson-Lundman G, Julin P, Nordstrom M, Viitanen M, Saaf J. Quantitative estimation of brain white matter abnormalities in elderly subjects using magnetic resonance imaging. Magn Reson Imaging. 1992;10:859–865. doi: 10.1016/0730-725x(92)90439-7. [DOI] [PubMed] [Google Scholar]
- 7.Kobari M, Meyer JS, Ichijo M. Leuko-araiosis, cerebral atrophy, and cerebral perfusion in normal aging. Arch Neurol. 1990;47:161–165. doi: 10.1001/archneur.1990.00530020061017. [DOI] [PubMed] [Google Scholar]
- 8.Kobari M, Meyer JS, Ichijo M, Oravez WT. Leukoaraiosis: correlation of MR and CT findings with blood flow, atrophy, and cognition. AJNR. 1990;11:273–281. [PMC free article] [PubMed] [Google Scholar]
- 9.Fein G, Van Dyke C, Davenport L, et al. Preservation of normal cognitive functioning in elderly subjects with extensive white-matter lesions of long duration. Arch Gen Psychiatry. 1990;47:220–223. doi: 10.1001/archpsyc.1990.01810150020004. [DOI] [PubMed] [Google Scholar]
- 10.Steingart A, Hachinski VC, Lau C, et al. Cognitive and neurologic findings in subjects with diffuse white matter lucencies on computed tomography scan (leuko-araiosis) Arch Neurol. 1987;44:32–35. doi: 10.1001/archneur.1987.00520130024012. [DOI] [PubMed] [Google Scholar]
- 11.Brun A, Englund E. A white matter disorder in dementia of the Alzheimer type: a pathoanatomical study. Ann Neurol. 1986;19:253–262. doi: 10.1002/ana.410190306. [DOI] [PubMed] [Google Scholar]
- 12.Englund E, Brun A, Persson B. Correlations between histopathologic white matter changes and proton MR relaxation times in dementia. Alzheimer Dis Associated Disord. 1987;1:156–170. doi: 10.1097/00002093-198701030-00008. [DOI] [PubMed] [Google Scholar]
- 13.Hershey LA, Modic MT, Greenough PG, Jaffe DF. Magnetic resonance imaging in vascular dementia. Neurology. 1987;37:29–36. doi: 10.1212/wnl.37.1.29. [DOI] [PubMed] [Google Scholar]
- 14.Schmidt R, Fazekas F, Kleinert G, et al. Magnetic resonance imaging signal hyperintensities in the deep and subcortical white matter: a comparative study between stroke patients and normal volunteers. Arch Neurol. 1992;49:825–827. doi: 10.1001/archneur.1992.00530320049011. [DOI] [PubMed] [Google Scholar]
- 15.Naritomi H. Significance of periventricular hyperintensity on magnetic resonance images in stroke patients. Rinsho Shinkeigaku-Clin Neurol. 1990;30:1345–1347. Japanese. [PubMed] [Google Scholar]
- 16.Blennow K, Wallin A, Uhlemann C, Gottfries CG. White-matter lesions on CT in Alzheimer patients: relation to clinical symptomatology and vascular factors. Acta Neurol Scand. 1991;83:187–193. doi: 10.1111/j.1600-0404.1991.tb04675.x. [DOI] [PubMed] [Google Scholar]
- 17.Fazekas F, Alavi A, Chawluk JB, et al. Comparison of CT, MR, and PET in Alzheimer's dementia and normal aging. J Nucl Med. 1989;30:1607–1615. [PubMed] [Google Scholar]
- 18.De Carli C, Kaye JA, Horwitz B, Rapoport SI. Critical analysis of the use of computer assisted transverse axial tomography to study human brain in aging and dementia of the Alzheimer type. Neurology. 1990;40:872–883. doi: 10.1212/wnl.40.6.872. [DOI] [PubMed] [Google Scholar]
- 19.Deicken RF, Reus VI, Manfredi L, Wolkowitz OM. MRI deep white matter hyperintensity in a psychiatric population. Biol Psychiatry. 1991;29:918–922. doi: 10.1016/0006-3223(91)90058-t. [DOI] [PubMed] [Google Scholar]
- 20.Rabins PV, Pearlson GD, Aylward E, Kumar AJ, Dowell K. Cortical magnetic resonance imaging changes in elderly inpatients with major depression. Am J Psychiatry. 1991;148:617–620. doi: 10.1176/ajp.148.5.617. [DOI] [PubMed] [Google Scholar]
- 21.Figiel GS, Krishnan KR, Doraiswamy PM, Rao VP, Nemeroff CB, Boyko OB. Subcortical hyperintensities on brain magnetic resonance imaging: a comparison between late age onset and early onset elderly depressed subjects. Neurobiol Aging. 1991;12:245–247. doi: 10.1016/0197-4580(91)90104-r. [DOI] [PubMed] [Google Scholar]
- 22.Sappey-Marinier D, Deicken RF, Fein G, et al. Alterations in brain phosphorus metabolite concentrations associated with areas of high signal intensity in white matter at MR imaging. Radiology. 1992;183:247–256. doi: 10.1148/radiology.183.1.1549681. [DOI] [PubMed] [Google Scholar]
- 23.Sappey-Marinier D, Calabrese G, Hetherington HP, et al. Proton magnetic resonance spectroscopy of human brain: applications to normal white matter, chronic infarction, and MR imaging white matter signal hyperintensities. Magn Reson Med. 1992;26:313–327. doi: 10.1002/mrm.1910260211. [DOI] [PubMed] [Google Scholar]
- 24.Maudsley AA, Hilal SK, Perman WH, Simon HE. Spatially resolved high resolution spectroscopy by “four dimensional” NMR. J Magn Reson. 1983;51:147–152. [Google Scholar]
- 25.Brown TR, Kincaid BM, Ugurbil K. NMR chemical shift imaging in three dimensions. Proc Natl Acad Sci U S A. 1982;79:3523–3526. doi: 10.1073/pnas.79.11.3523. [DOI] [PMC free article] [PubMed] [Google Scholar]
- 26.Duijn JH, Matson GB, Maudsley AA, Weiner MW. 3D phase encoding 1H spectroscopic imaging of human brain. Magn Reson Imaging. 1992;10:315–319. doi: 10.1016/0730-725x(92)90490-q. [DOI] [PubMed] [Google Scholar]
- 27.Constans JM, Meyerhoff DJ, Norman D, Fein F, Weiner MW. 1H and 31P magnetic resonance spectroscopic imaging of white matter signal hyperintensities in elderly subjects. Neuroradiology. 1995 doi: 10.1007/BF00593373. in press. [DOI] [PubMed] [Google Scholar]
- 28.Meyerhoff DJ, Weiner MW. Proceedings of the Society of Magnetic Resonance 1994. Berkeley, Calif: Society of Magnetic Resonance; 1994. Metabolite variations and age effects in the normal human brain studied by 1H MRSI (abstr) p. 598. [Google Scholar]
- 29.Armstrong MR, Campbell G, Alger JR, Stone LA, Moonen C, Frank JA. Proceedings of the Society of Magnetic Resonance in Medicine 1993. Berkeley, Calif: Society of Magnetic Resonance in Medicine; 1993. Metabolite variations in the normal brain as studied by magnetic resonance spectroscopy: analysis of variance (abstr) p. 1533. [Google Scholar]
- 30.Chui HC, Victoroff JI, Margolin D, Jagust W, Shankle R, Katzman R. Criteria for the diagnosis of ischemic vascular dementia proposed by the State of California Alzheimer's Disease Diagnostic and Treatment Centers. Neurology. 1992;42:473–80. doi: 10.1212/wnl.42.3.473. [DOI] [PubMed] [Google Scholar]
- 31.Folstein MF, Folstein SE, McHugh PR. Mini-Mental State. J Psychiatr Res. 1975;12:189–198. doi: 10.1016/0022-3956(75)90026-6. [DOI] [PubMed] [Google Scholar]
- 32.The Neurobehavioral Cognitive Status Examination (NCSE) Fairfax, Calif: The Northern California Neurobehavioral Group; 1983. [Google Scholar]
- 33.Kiernan RJ, Mueller J, Langston JW, Van Dyke C. The Neurobehavorial Cognitive Status Examination: a brief but differential approach to cognitive assessment. Ann Intern Med. 1987;107:481–488. doi: 10.7326/0003-4819-107-4-481. [DOI] [PubMed] [Google Scholar]
- 34.Duijn JH, Matson GB, Maudsley AA, Hugg JW, Weiner MW. Human brain infarction: proton MR spectroscopy. Radiology. 1992;183:711–718. doi: 10.1148/radiology.183.3.1584925. [DOI] [PubMed] [Google Scholar]
- 35.Maudsley AA, Lin E, Weiner MW. Spectroscopic imaging display and analysis. Magn Reson Imaging. 1991;10:471–485. doi: 10.1016/0730-725x(92)90520-a. [DOI] [PubMed] [Google Scholar]
- 36.Little RJA, Rubin DB. Statistical analysis with missing data. New York, NY: Wiley; 1987. [Google Scholar]
- 37.Nadler JV, Cooper JR. N-acetyl-L-aspartic acid content of human neutral tumours and bovine peripheral nervous tissues. J Neurochem. 1971;19:313–319. doi: 10.1111/j.1471-4159.1972.tb01341.x. [DOI] [PubMed] [Google Scholar]
- 38.Urenjak J, Williams SR, Gadian DG, Noble M. Specific expression of N-acetylaspartate in neurons, oligodendrocyte-type-2 astrocyte progenitors, and immature oligodendrocytes in-vitro. J Neurochem. 1992;59:55–61. doi: 10.1111/j.1471-4159.1992.tb08875.x. [DOI] [PubMed] [Google Scholar]
- 39.Birken L, Oldendorf WH. N-acetyl-L-aspartatic acid: a literature review of a compound prominent in 1H-NMR spectroscopic studies of the brain. Neurosci Behav Rev. 1989;13:23–31. doi: 10.1016/s0149-7634(89)80048-x. [DOI] [PubMed] [Google Scholar]
- 40.Tallan HH. Studies on the distribution of N-acetyl-L-aspartic acid in brain. J Biol Chem. 1957;224:41–45. [PubMed] [Google Scholar]
- 41.Miller BL. A review of chemical issues in 1H NMR spectroscopy: N-acetyl-L-aspartate, creatine and choline. NMR Biomed. 1991;4:47–52. doi: 10.1002/nbm.1940040203. [DOI] [PubMed] [Google Scholar]
- 42.Grafton ST, Sumi SM, Stimac GK, Alvord EC, Jr, Shaw CM, Nochlin D. Comparison of postmortem magnetic resonance imaging and neuropathologic findings in the cerebral white matter. Arch Neurol. 1991;48:293–298. doi: 10.1001/archneur.1991.00530150061019. [DOI] [PubMed] [Google Scholar]
- 43.Janota I, Mirsen TR, Hachinski VC, Lee DH, Merskey H. Neuropathologic correlates of leuko-araiosis. Arch Neurol. 1989;46:1124–1128. doi: 10.1001/archneur.1989.00520460118023. Erratum. [DOI] [PubMed] [Google Scholar]; Arch Neurol. 1990;47:281. [Google Scholar]
- 44.Marshall VG, Bradley WG, Marshall CE, Bhoopat T, Rhodes R. Deep white matter infarction: correlation of MR imaging and histopathologic findings. Radiology. 1988;167:517–522. doi: 10.1148/radiology.167.2.3357964. [DOI] [PubMed] [Google Scholar]
- 45.Munoz DG, Hastak SM, Harper B, Lee D, Hachinski VC. Pathologic correlates of increased signals of the centrum ovale on magnetic resonance imaging. Arch Neurol. 1993;50:492–497. doi: 10.1001/archneur.1993.00540050044013. [DOI] [PubMed] [Google Scholar]
- 46.Fazekas F, Kleinert R, Offenbacher H, et al. Pathologic correlates of incidental MRI white matter signal hyperintensities. Neurology. 1993;43:1683–1689. doi: 10.1212/wnl.43.9.1683. [DOI] [PubMed] [Google Scholar]
- 47.Oppenheimer SM, Bryan NR, Conturo TE, Soher BJ, Preziosi TJ, Barker PB. Proton magnetic resonance spectroscopy and gadolinium-DTPA perfusion imaging in asymptomatic MRI white matter lesions. Magn Reson Med. 1995;33:61–68. doi: 10.1002/mrm.1910330109. [DOI] [PubMed] [Google Scholar]
- 48.Berkelbach van der Sprenkel JW, Luyten PR, van Rijen PC, Tulleken CAF, den Hollander JA. Cerebral lactate detected by regional proton magnetic resonance spectrosopy in a patient with cerebral infarction. Stroke. 1988;19:1556–1560. doi: 10.1161/01.str.19.12.1556. [DOI] [PubMed] [Google Scholar]
- 49.Hugg JW, Duijn JH, Matson GB, et al. Elevated lactate and alkalosis in chronic human brain infarction observed by 1H and 31P MR spectroscopic imaging. J Cereb Blood Flow Metab. 1992;12:734–744. doi: 10.1038/jcbfm.1992.104. [DOI] [PubMed] [Google Scholar]
- 50.Petroff OAC, Graham GD, Blamire AM, et al. Spectroscopic imaging of stroke in humans: histopathology correlates of spectral changes. Neurology. 1992;42:1349–1354. doi: 10.1212/wnl.42.7.1349. [DOI] [PubMed] [Google Scholar]
- 51.Arnold DL, Matthews PM, Francis SG, O'Connor J, Antel JP. Proton magnetic resonance spectroscopic imaging for metabolic characterization of demyelinating plaques. Ann Neurol. 1992;31:235–241. doi: 10.1002/ana.410310302. [DOI] [PubMed] [Google Scholar]
- 52.Husted CA, Goodin DS, Hugg JW, et al. Biochemical changes in multiple sclerosis lesions and in normal-appearing white matter detected by in vivo 31P and 1H spectroscopic imaging. Ann Neurol. 1994;36:157–165. doi: 10.1002/ana.410360207. [DOI] [PubMed] [Google Scholar]
- 53.Duyn JH, Gillen J, Sobering G, Van Zijl PCM, Moonen CTW. Multisection proton MR spectroscopic imaging of human brain. Radiology. 1993;188:277–282. doi: 10.1148/radiology.188.1.8511313. [DOI] [PubMed] [Google Scholar]
- 54.Posse S, Tedeschi G, Risinger R, Ogg R, LeBihan D. Proceedings of the Society Magnetic Resonance 1994. Berkeley, Calif: Society of Magnetic Resonance; 1994. High speed 2D and 3D 1H spectroscopic imaging in human brain by echo-planar spatial-spectral encoding (abstr) p. 174. [Google Scholar]
- 55.Posse S, Schuknecht B, Smith ME, van Zijl PCM, Herschkowitz N, Moonen CTW. Short TE proton MR spectroscopic imaging. J Comput Assist Tomogr. 1993;17:1–14. doi: 10.1097/00004728-199301000-00001. [DOI] [PubMed] [Google Scholar]
- 56.Miller BL, Moats RA, Shonk T, Ernst T, Woolley S, Ross BD. Alzheimer disease: depiction of increased cerebral myo-inositol with proton MR spectroscopy. Radiology. 1993;187:433–437. doi: 10.1148/radiology.187.2.8475286. [DOI] [PubMed] [Google Scholar]