Abstract
We have undertaken time-resolved Förster resonance energy transfer (FRET) and molecular dynamics simulations to analyze conformations and conformational heterogeneity of an analog of leucine enkephalin in solution and in the presence of SDS micelles. Enkephalins are opioid pentapeptides that interact with opioid receptors in the central nervous system. We used time-correlated single-photon counting to detect energy transfer between the N-terminal tyrosine and a tryptophan residue substituted for phenylalanine at the 4 position. FRET from Tyr to Trp was measured over a temperature range from 5°C to 55°C in aqueous solution. By taking into account Tyr rotamer interconversion rates measured previously, we determined average distances between Tyr and Trp for the two populated rotameric conformations of Tyr. Molecular dynamics simulations (100 ns) support this analysis and indicate extensive conformational heterogeneity. The simulations also predict that the FRET orientational factor is correlated with the Tyr-Trp separation. Failure to account for the correlation between orientation and distance results in errors that appear to be largely offset in YGGWL by a weighting bias inherent in the R−6 dependence of the energy-transfer rate. The Tyr lifetimes decrease upon titration of the peptides with SDS, indicating formation of compact conformations of the peptide in the micelle environment. This result is consistent with the conjecture that the lipid environment may induce formation of bioactive conformations of the peptide.
Keywords: energy transfer, fluorescence, opioid peptides, rotamers, time-resolved fluorescence
Introduction
The enkephalins are opioid pentapeptides that activate opioid receptors in the mammalian pain response pathway. Since the enkephalins were identified in 1975,1 researchers have investigated the conformations of these peptides and the basis for their receptor selectivity.2-4 NMR measurements,5 infrared spectroscopy,6 Raman spectroscopy,7 and molecular dynamics (MD) simulations8-12 indicate that enkephalins lack a well-defined secondary structure in aqueous solution. However, these studies may not accurately represent the actual physiological environment of the peptide interacting with an opioid receptor, and the membrane environment may induce bioactive peptide structures.13 In hydrophobic or membrane environments enkephalins appear to adopt more compact and structured configurations due to interaction with the lipid bilayer.5,6,14-19 The average distance between the pharmacore groups (Tyr and Phe) may correlate with selectivity toward different opioid receptors.20 Computational studies of enkephalin structure support this hypothesis.12 The δ-opioid receptor may be sensitive to a wide range of conformations with aromatic separations of 5 to 15 Å.12,20 Leucine enkephalin (YGGFL), which demonstrates δ-receptor activity, appears to form structures with a wide range of aromatic sidechain separations.12
Given the structural heterogeneity in enkephalins and the importance of the spatial separation between aromatic groups, fluorescence studies should provide an excellent tool for the analysis of enkephalin structure. A previous FRET study of the Trp-4 analog of Met-enkephalin and Leu-enkephalin indicated an average distance between Tyr-1 and Trp-4 of 9.3 Å.21,22 However, multiple conformational states cannot be distinguished by steady-state FRET measurements. Time-resolved fluorescence can resolve conformations in solution by Förster resonance energy transfer (FRET) because the presence of conformational states with a distribution of FRET rates should result in a multiple fluorescence decay components.
In this work we demonstrate the utility of time-resolved fluorescence for detecting and characterizing heterogeneous structure in a Leu-enkephalin analog. We use a peptide (YGGWL) in which Trp has been substituted for Phe at the fourth position of YGGFL. This peptide has been shown to have opioid activity similar to that of YGGFL.22 Molecular dynamics (MD) simulations were carried out to relate the observed FRET efficiencies to conformations of YGGWL, including rotameric conformations of the N-terminal Tyr residue.
We reported previously that the Tyr fluorescence decay of YGGFL is comprised of three distinct exponential components, which can be related to the rotameric conformations of Tyr about the Cα-Cβ bond: trans (t), gauche− (g−), and gauche+ (g+).23 In the present case, the fluorescence decay of Tyr depended not only on the rotameric state of Tyr, but also on conformational states of the peptide that affect either the Tyr-to-Trp distance or the relative orientations of Tyr and Trp. The Tyr fluorescence decay distribution for YGGWL was heterogeneous with FRET rates that correspond to at least two peptide conformations. The Tyr-to-Trp distances did not change significantly with temperature in aqueous solution, suggesting that no significant conformational changes occur over this temperature regime. MD simulations showed multiple FRET states but also suggested a correlation between Tyr-to-Trp distance and the FRET orientational factor. It was more difficult to determine the Tyr-to-Trp distance in YGGWL in the presence of SDS micelles due to the complexity of the rotamer interchange problem and the lack of information about the effect of SDS on tyrosyl photophysics. Nevertheless, the formation of a compact state in the membrane environment was demonstrated by a significant increase in the amplitude of a highly quenched Tyr fluorescence lifetime.
Materials and Methods
YGGFL and SDS (SigmaUltra) were obtained from Sigma (St. Louis, MO). Buffers were of the highest grade available. YGGWL was synthesized by the Biochemical Research Service Lab at the University of Kansas. The purity of the peptides was assessed by mass spectrometry. The sample was dissolved in phosphate buffer at pH 7.
Steady-state fluorescence spectra were obtained on a PTI Quantamaster fluorimeter (Lawrenceville, NJ). Time-resolved fluorescence measurements were performed with time-correlated single-photon counting instrumentation described previously.24 Intensity decays were collected at the magic-angle polarization to eliminate orientational contributions. The excitation wavelength for all samples was 280 nm and the emission wavelength was centered at either 295 nm or 305 nm with an emission monochromator bandpass of 10 nm.
Fluorescence decays were fit to a distribution of fluorescence lifetimes by maximum-entropy (ME) analysis25,26 with the program mem3 (a kind gift from Prof. N. Periasamy). This method fits the data to a distribution of fixed, logarithmically-spaced lifetimes by optimizing the amplitude surface for the distribution. The ME algorithm discriminates against sharp modulation of the amplitudes as a function of lifetime. Hence, the method identifies a minimum number of decay components without a priori assumptions about what that number should be.26 However, we have found that ME analysis tends to overestimate the amplitude of short lifetime components relative to longer lifetime components. This is troublesome for the comparison of lifetime distributions quenched by FRET to those of the unquenched donor fluorophore. Therefore, fluorescence decays were also analyzed by non-linear least squares fitting to multiple exponentials. The time constants from the nonlinear least-squares analysis were compared with the ME distributions to ensure that the peaks of the ME lifetime distributions were accurately approximated by the nonlinear least-squares analysis.
Molecular dynamics (MD) simulations were performed with CHARMM27 version 22 with all-atom parameters and topology, including the CMAP correction for backbone torsions. The YGGWL peptide was generated in an extended conformation and solvated in a truncated cubic water cell creating a system with 1633 TIP3P water molecules and 4980 atoms altogether. The solvent cell was a bcc cell (truncated cube or truncated octahedron) based on cutting the corners of a cube with side 47 Å. After equilibration the cell size was ca. 46 Å. Thus, the distances between the cell faces in the x,y,z directions were 46 Å, and the distances between faces perpendicular to cube diagonals were 40 Å. In the fully extended conformation, the maximum dimension of the peptide was about 18 Å, so the distance between the peptide and the sides of the cell was at least 11 A in all directions. In the simulations we used the standard force-field charges of the residues, which reflect the ground electronic state. Our modeling of the FRET experiments is thus based on the assumption that electronic excitation of the sidechains will have a negligible influence on the peptide conformational distributions.
We generated several 100-ns MD trajectories of YGGWL with both cutoff and Ewald treatments of electrostatics and with different solvent cell sizes. All these trajectories gave similar results relating to the conformational distributions of the peptide. In the analysis of simulation results we have selected a single trajectory (with cutoff electrostatics and cell size defined above) for simplicity. After 100-ps equilibration with fixed peptide and 100-ps equilibration of the whole system, a 100-ns trajectory was generated at a constant temperature of 300 K and constant pressure of 1 atm. The simulations employed SHAKE constraints on bonds involving hydrogen atoms, a 2-fs time step, and standard 12-Å cutoffs for the non-bonded interactions with van der Waals terms smoothed through a switching function and electrostatic terms truncated through a shift function. Generation of the 100-ns trajectory took about six months on a single processor on a Linux workstation.
In trajectory analysis, we calculated the time courses of the distance R between the centers of mass of the Trp and Tyr side chains, the peptide end-to-end distance (i.e. separation between the Tyr and Leu alpha carbons), the backbone and side chain dihedral angles, and the vectors of the transition dipoles of Tyr and the Trp 1La and 1Lb states. This allowed us to study the distributions of various coordinates of interest as well as the conformational dynamics of the peptide. The direction of the Trp La and Lb transition dipoles was based on published results.28 Following these authors, we defined a coordinate system in the indole ring plane: using TRP atom names, the x axis passed through the center of the CH2-CZ3 bond and the CD1 atom, while the y axis was along the CE2-CD2 bond. The La axis formed an angle of −41° with the x axis, while the Lb state formed an angle of 54° with x. In the trajectory analysis we calculated the instantaneous axis directions based on atomic coordinates. For Tyr we used the short in-plane axis as the transition dipole axis,29 defined based on centers of the CD1-CE1 and CD2-CE2 bonds obtained from the trajectory.
Simulated fluorescence decays were generated from the MD simulation as follows. Starting from each step of the MD simulation, the probability of emission of a fluorescence photon and the probability of energy transfer were tested for each subsequent step in the simulation by comparison with a randomly selected number until the result was de-excitation of Tyr either by fluorescence emission, nonradiative decay, or energy transfer. The probability of fluorescence emission within a time step is related to the fluorescence radiative decay rate kr by
| (1) |
where tstep is the length of a simulation time step. The radiative rate kr for tyrosine is 0.022 ns−1 24 and was assumed to be the same for each of the rotameric states of Tyr in the peptide. In addition to the radiative rate, each rotamer has distinct nonradiative rates corresponding to unique quenching pathways. The observed fluorescence decay rate is the sum of these rates and the radiative rate:
| (2) |
The probability of non-radiative decay for each rotamer was calculated in the same manner as in eq 1 except with the rate knr. The nonradiative rates for each rotamer consisted of two contributions: the intrinsic nonradiative decay for each rotamer and the FRET rate. The intrinsic nonradiative decay rate for each rotamer was taken from the YGGFL fluorescence decay rates in the absence of rotamer interchange calculated in a previous paper.23 The rate of energy transfer is given by30
| (3) |
where R is the Trp-to-Tyr distance, J is the overlap integral between the fluorescence spectrum of the donor and the absorption spectrum of the acceptor, n is the refractive index (1.33 for water), and the value of the orientational factor κ2 is given by30
| (4) |
where θT is the angle between the donor emission transition dipole and the acceptor absorption dipole, θD is the angle between the donor emission dipole and the line connecting the donor and acceptor point dipoles, and θA is the angle between the acceptor absorption dipole and the line connecting the donor and acceptor dipoles. Given that J, n, and kr are the same for both rotamers in this study, the only remaining parameters are κ2 and R.
At each time step in the simulation after a chosen starting point, the probabilities of fluorescence emission, non-radiative decay, and energy transfer were calculated based on the simulated distances, κ2 values, and intrinsic rotamer-specific non-radiative decay rates. These probabilities were compared to a uniform random number between 0 and 1. If the random number was less than the probability, the system was considered to decay according to that pathway. If the pathway was emission, a fluorescence count was recorded with the appropriate delay time from the starting point. Each point in the simulation was used as a starting point at least 100 times to average over the different possible fates of each instantaneous state. Points after 16 ns from the end of the simulation were not used to avoid end effects. In order to account for the effects of convolution with an instrument response function, one of the experimentally recorded instrument response functions was used as an excitation time probability distribution, PE(t). For each photon, a random number was generated according to this distribution and added to the arrival time for the photon. In this way, the photon arrival times were convoluted with the instrument response function. Analysis of this data was performed in the same way as analysis of experimental data.
Theory
The theory of tyrosyl rotamer interchange and its effect on the fluorescence decay of the tyrosyl residue in small peptides has been described in detail by us and others.23,31,32 That work demonstrates definitively that rotamer interchange occurs on the time scale of the fluorescence decay and must be accounted for to accurately describe the photophysics of Tyr in peptides. For the present work, we extend that theory to include resonance energy transfer from Tyr to Trp in the leucine enkephalin point mutant YGGWL. The Tyr fluorescence lifetime was used to determine the FRET rate. In order to calculate the FRET efficiency, it was therefore necessary to know the fluorescence lifetime of the energy donor (Tyr) in the absence of FRET. But the Tyr lifetime depends strongly on the Tyr rotameric configuration.23,31,32 Therefore, it was necessary to take into account the rotameric configuration of Tyr (but not of Trp, because it is the energy acceptor and its lifetime was not measured) to determine the FRET rate. Because only two populations were resolved in the distribution of fluorescence lifetimes, we treated two rotameric states of Tyr (g− and t). The g+ rotamer of Tyr is neglected, but its population appears to be quite small,23 a conclusion supported by the MD simulations.
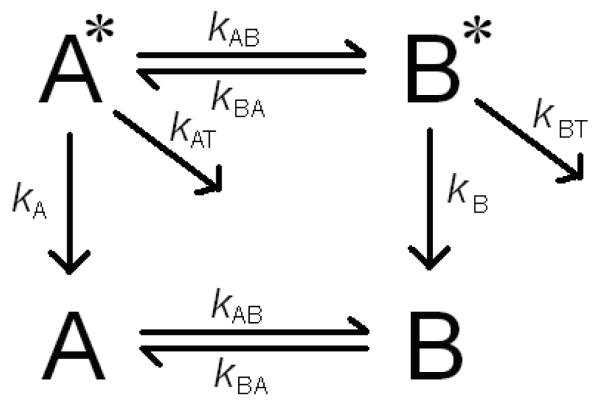
The kinetic model is shown in Figure 1. The rate equations are given by
| (5) |
Here kA and kB are the intrinsic fluorescence decay rates for states A* and B* in the absence of rotamer interchange or FRET, kAB and kBA are the rotamer interchange rates, and kAT and kBT are the energy transfer rates for states A and B. This system of equations has the solution:
| (6) |
where λ and V→ are the eigenvalues and eigenvectors of the matrix in eq 5, and a and b were determined by the relative initial rotamer populations from NMR studies, as described previously.23 The observed fluorescence decay rates, taken either from the peak of the ME distributions or from the discrete fits, were equated with the eigenvalues of the matrix in eq 5, and the fluorescence decay rates and rotamer interchange rates were determined from the fluorescence decays for YGGFL as described by eq 5 in the absence of FRET.23
Figure 1.
Diagram for resonance energy transfer in an interchanging two state system. kAB and kBA are the rotamer interchange rates, kA and kB are the intrinsic fluorescence decay rates of rotamers A and B, and kAT and kBT are the resonance energy transfer rates from rotamers A and B.
Results
Fluorescence measurements
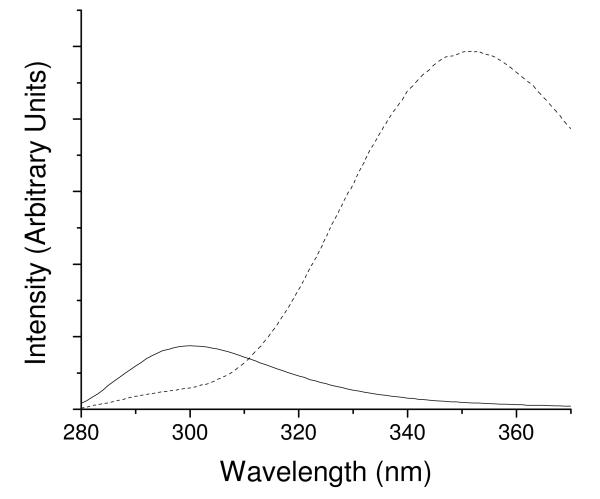
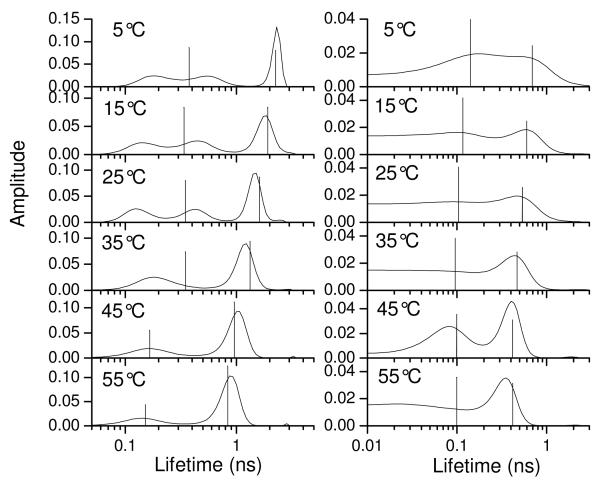
The fluorescence spectra (corrected for concentration differences) for YGGFL and YGGWL excited at 260 nm are compared in Figure 2. Tyrosyl fluorescence was significantly quenched by energy transfer in YGGWL relative to YGGFL. Considering the similarity between these peptides, it is unlikely that this quenching was due to any process other than energy transfer. A comparison of the ME lifetime distributions for YGGFL and YGGWL excited at 280 nm over a temperature range from 5°C to 55°C is shown in Figure 3. For YGGFL (left column) the ME distributions reveal three peaks for temperatures up to 25°C and two peaks for temperatures of 35°C and higher. (The ME distribution for YGGFL at 25 °C was reported previously23 and is reproduced here for comparison.) The widths of the distributions include contributions from noise in the data and therefore are not useful for assessing heterogeneity.26 The presence of three components in YGGFL has been attributed to the existence of three rotameric conformations of the N-terminal tyrosine.23,31-34 The ME distributions are consistent with the use of three exponentials in discrete fits reported previously for YGGFL.35,36 However, the results of discrete fits do not always yield lifetime values consistent with the peaks of the ME distributions determined from the same data set, as noted previously.23
Figure 2.
Fluorescence spectra of YGGFL (solid line) and YGGWL (dashed line) corrected to account for differences in concentration. The tyrosyl fluorescence band at 300 nm is significantly quenched in YGGWL.
Figure 3.
Maximum entropy distributions for the fluorescence decays of tyrosine in YGGFL (left column) and YGGWL (right column) as a function of temperature in aqueous solution excited at 280 nm and collected at 295 nm. The vertical lines are the lifetimes obtained from discrete fits to two exponentials. The height of the line is proportional to the relative amplitude.
The distributions for YGGWL are also shown in Figure 3 (right column). Comparison with the ME distributions for YGGFL reveal two salient differences. First, the distributions are shifted to shorter lifetimes as expected for FRET between Tyr and Trp. Second, the lifetime distributions for YGGWL appear broader than those for YGGFL suggesting the presence of a distribution of Tyr-Trp distances. In order to assess the possibility of a contribution from Trp in the YGGWL fluorescence decays at 303 nm, we also collected Trp emission in YGGWL at 350 nm (data not shown) again exciting at 280 nm. At room temperature this lifetime distribution was broad with a maximum around 2 ns and little amplitude under 0.5 ns. In Figure 3 the lifetime amplitude at 2 ns is small, indicating very little contribution from Trp. Even a small contribution from Trp could affect the goodness of fit, so for some of the nonlinear least squares analyses a long lifetime was added to account for this contribution.
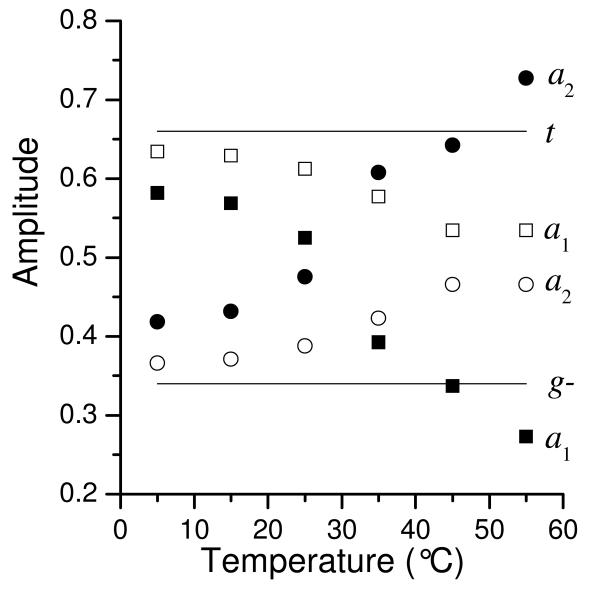
The temperature dependence of the amplitudes of decay components for YGGWL and YGGFL is shown in Figure 4. (The amplitudes for the decay components for the long component in YGGFL were reported previously23 and are shown here for comparison.) The rotamer populations determined by NMR for Met-enkephalin,37 a peptide similar to YGGFL, are shown as well. (Note that these are not the populations reported in the literature, but rather the populations calculated from the coupling constants by the method of Altona et al.38 as described elsewhere.23) The amplitudes for both peptides were close to the NMR populations at low temperatures. As temperature increased, the amplitude of the long lifetime increased at the expense of the short lifetime amplitude. The amplitudes for YGGWL were closer to the NMR populations than the amplitudes for YGGFL were. This is probably the result of the shorter Tyr lifetime relative to the rotamer interchange rate in YGGWL. They also did not show the same degree of change with temperature as the YGGFL amplitudes. For comparison, the rotamer populations from the MD simulation were 45% t, 55% g−.
Figure 4.
Amplitudes for the short lifetimes (squares, a1) and the long lifetimes (circles, a2) of YGGFL (filled symbols) and YGGWL (open symbols). The YGGFL amplitudes were obtained from Gaussian fits to the ME distributions. The YGGWL amplitudes are the result of nonlinear least squares discrete fits. The solid lines are the steady-state populations of the g− state (lower line) and the t state (upper line) from NMR (coupling constants from ref. 37 analyzed as described in ref. 23). The amplitudes for YGGWL should correspond to these populations in the absence of rotamer interconversion.
Analysis of FRET results
In order to estimate FRET rates from the Tyr lifetime data for YGGWL shown in Fig. 3, some simplifying approximations were needed. In principle, the lifetime distributions for YGGWL could include contributions from the distribution of FRET rates, the rotamer interchange rates, and other conformational interchanges that occur on the timescale of the fluorescence lifetime, as well as from noise in the fluorescence data. It was not possible to analyze the distribution of lifetimes quantitatively due to the complex relationship between ME distribution shapes and the lifetimes and noise present in the measurement. Therefore, for this analysis double-exponential fits, shown as vertical lines in Fig. 3, were used to represent the fluorescence decays of YGGWL.
In comparing the fluorescence lifetimes for YGGFL and YGGWL, we note first that the longer lifetime component of YGGWL at each temperature (e.g. ca. 0.5 ns at 25°C) is shorter than the longer lifetime peak but longer than the intermediate lifetime peak in the ME distributions for YGGFL (for temperatures ≤ 25°C) or the shorter lifetime peak (for temperatures > 25°, where only two peaks are resolved for YGGFL). The longer lifetime component for YGGFL (ME peak at 1.05 ns) can be assigned to the g− rotamer and the intermediate lifetime peak to the t rotamer (peak at 0.4 ns).23 The longest lifetime component in YGGWL has a shorter lifetime than the g− component in YGGFL, but longer than the lifetime of the t component in YGGFL. Because energy transfer can only make lifetimes shorter, we can unambiguously associate the longest component in YGGWL with Tyr in the g− rotameric configuration. MD simulations indicated that about 77% of the g− rotamer population belongs to an extended peptide conformation (see below). Thus we expect that the longer lifetime of YGGWL should yield the average FRET rate for the g− rotamer corresponding to this extended conformation. Analysis of the shorter lifetime component in YGGWL is not as clear cut, since it may have contributions from the peptide with Tyr in the t conformation plus from a g− population of Tyr (23 % according to the simulation) associated with the peptide in a more folded conformation. We have no way of separating these contributions to the experimental data. However, given that the longer lifetime decay corresponds to most of the g− population, we conclude that the shorter lifetime peak corresponds predominantly to the t rotamer and will yield an approximate average Tyr-to-Trp FRET rate for the t rotamer.
To determine FRET rates from Tyr fluorescence lifetimes the Tyr fluorescence lifetimes were needed in the absence of FRET, and these depend on rotameric configuration and rotamer interchange rates. We assumed that the intrinsic Tyr fluorescence decay rates, rotamer populations of Tyr, rates of tyrosyl rotamer interchange, and other environmental effects were the same for YGGFL and YGGWL. These assumptions are justified by the similarity between the two peptides with respect to both structure (Trp is a conservative substitution for phenylalanine) and biological activity.22 The rates of tyrosyl rotamer interchange in YGGFL were reported in a previous publication.23 Contributions from other conformational motions were neglected in the analysis. For calculation of Tyr-Trp distances, the orientation factor κ2 was set to the orientationally averaged value of 2/3. This assumption was tested by comparison of the experimental results with distance distributions from MD simulations and is discussed further below.
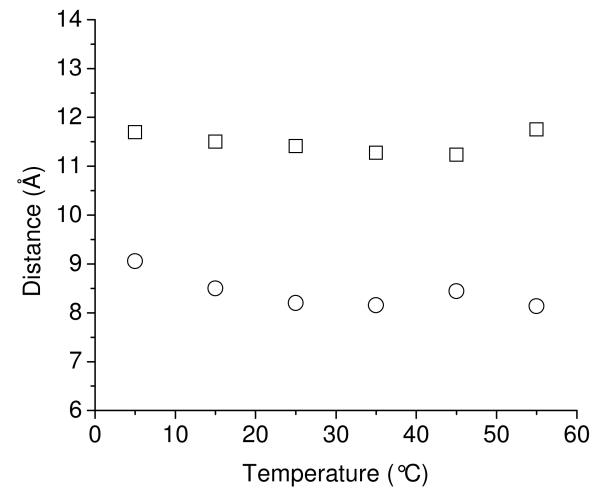
With these assumptions the energy transfer rates for each of the observed states of YGGWL were determined from eq 5, and the average Tyr-to-Trp distance for each rotamer was calculated at each temperature from eq 3. This information is plotted in Figure 5. The average distances calculated in this way for the g− and t rotamers at 25°C were 11.5 Å for g− and 8.8 Å for t. These values are in very good agreement with the average ring–to-ring distances calculated from the MD simulations for the g− and t rotamers of Tyr (see below), suggesting that our approach is valid. The same procedure was followed at other temperatures. Figure 5 shows that the inter-chromophore distance calculated in this way did not change significantly as a function of temperature.
Figure 5.
Tyr-to-Trp distances as a function of temperature for the g− state (squares) and the t state (circles). The distances were calculated from biexponential fits to the Tyr fluorescence decays for YGGWL.
Leu-enkephalin in SDS micelles
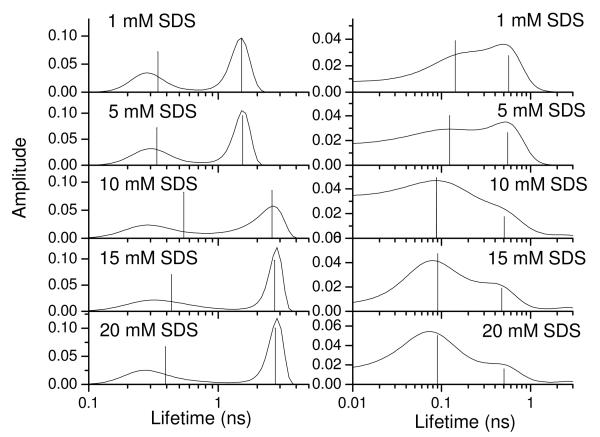
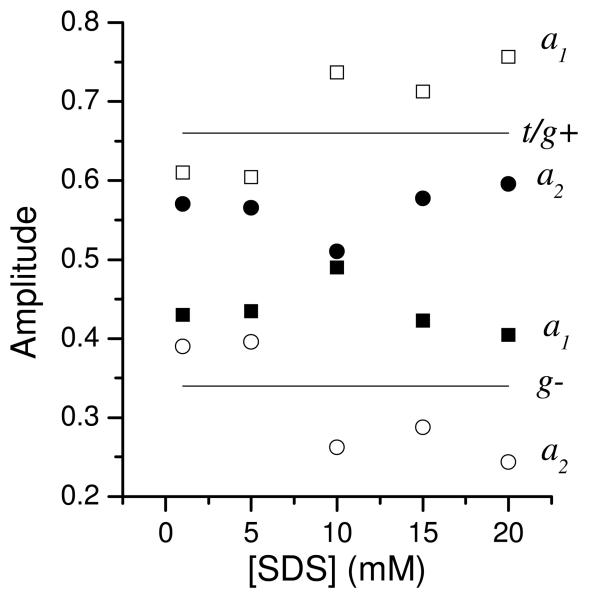
Figure 6 shows the effect of SDS micelles on the ME distributions for YGGFL and YGGWL. For YGGFL (left column) at low SDS concentrations the ME distributions were similar to those observed in the absence of SDS (Figure 3), although only two peaks were resolved. For SDS concentrations between 5 and 10 mM, the average lifetime of YGGFL showed a distinct increase. This encompasses the critical micelle concentration of SDS (8 mM39), suggesting that the tyrosyl chromophore interacts with micelles at SDS concentrations of 10 mM or higher. At 20 mM SDS, no free YGGFL was present in the solution as evidenced by the lack of a lifetime contribution at 1.5 ns (the lifetime in the absence of SDS). For YGGWL (Figure 6, right column), the lifetimes were shorter and the distributions broader than for YGGFL. In addition, the ME distributions displayed an increased amplitude of a short-lifetime component at about 0.1 ns with addition of SDS. The amplitude of this component became significantly larger for SDS concentrations of 15 mM or higher. The fluorescence decays for YGGWL in the presence of SDS were also fit to two-exponential decay functions. Vertical lines in Figure 6 show the results of these fits. Figure 7 plots the corresponding amplitudes of the short and long–lifetime components for both YGGFL and YGGWL in the presence of SDS.
Figure 6.
Maximum-entropy distributions for the fluorescence decays of tyrosine in YGGFL (left) and YGGWL (right) as a function of SDS concentration. The vertical lines are the lifetimes recovered from a discrete fit. The height of the line is proportional to the relative amplitude.
Figure 7.
Amplitudes for the short-lifetime (squares) and long–lifetime (circles) components for the tyrosine fluorescence decay in YGGFL (filled symbols) and YGGWL (open symbols). The YGGFL amplitudes were obtained from Gaussian fits to the ME distributions. The YGGWL amplitudes are the result of nonlinear least squares fits to discrete exponentials. The solid lines are the steady state populations of the g− state (lower line) and the g+ and t states (upper line) in aqueous solution. At 10 mM SDS for YGGFL the amplitudes were not well fit by two Gaussians due to the presence of multiple long lifetime states (one corresponding to the micelle bound state and the other corresponding to the aqueous state).
The increased amplitude of short-lifetime states for YGGWL above the critical micelle concentration indicates the formation of compact conformations of the peptide. However, it was not possible to quantify the FRET rate for the compact state for several reasons. First, the rotamer interconversion rate could not be determined due to the lack of accurate information about the rotamer populations and the lifetime of free Tyr in the micelle environment. Small dipeptides containing Tyr (Tyr-Ala, Tyr-Gly, etc.) do not bind to micelles,40 so it is unlikely that free Tyr binds to micelles and therefore its intrinsic lifetime in the micelle is not known. In addition, as mentioned earlier, NMR coupling constants are dependent on environment, making it difficult to assess the rotamer populations from NMR measurements. Second, the observed short lifetimes could represent combinations of the short-lifetime rotamer population of YGGWL in an extended conformation and the lifetime distribution of either rotamer in a compact conformation. Since these decays were not resolved, it was not possible to determine the interconversion rate.
Molecular Dynamics Simulations
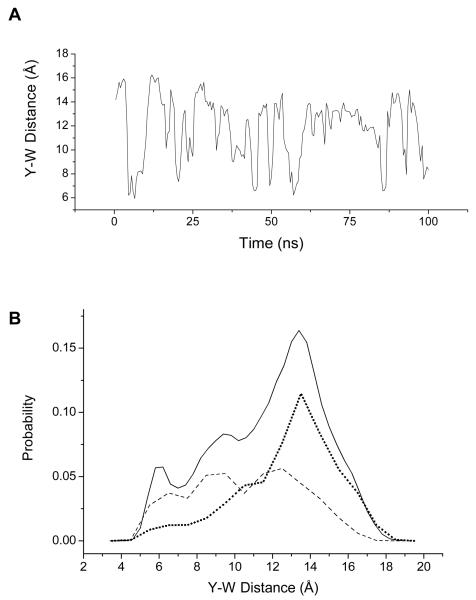
Molecular dynamics simulations were carried out to calculate the distance distributions of YGGWL. Figure 8 shows the trajectory of Tyr-Trp distances and the corresponding probability distribution of Tyr-Trp distances. The distribution shows a broad range of Tyr-Trp distances with peaks at 6.0 Å. 9.5 Å, and 13.4 Å. This distance distribution compares favorably with the distribution of Tyr-Phe distances predicted in a 10-ns MD simulation of YGGFL,12 suggesting that the conformational distributions for YGGWL and YGGFL are similar. It is not clear whether minor differences between the distributions (e.g. a larger predicted population for the shortest distance configuration in YGGFL) are due to intrinsic differences in conformational populations or to differences in the simulation protocols. Another recent simulation of YGGFL, however, predicted a narrower distribution of Tyr-Phe distances with a peak at 9 Å at neutral pH.11 Our simulations predicted a much wider conformational heterogeneity, including broader Tyr-Phe distance distribution than reported in ref 11. Compared to our calculations, the simulations in that work used the GROMOS force field, a different non-bond truncation scheme, a different water model, about 50% fewer waters, and much shorter trajectories of 5-10 ns. We believe that our longer trajectory and increased periodic system size give a realistic model for YGGWL structural fluctuations because of the good agreement with experimental data, as shown below.
Figure 8.
A. Trajectory of Tyr-Trp distances from MD simulation of YGGWL. The distances were averaged over 500 ps. (See text for details of the simulation.) B. Distribution of Tyr-Trp distances from the MD simulation in 500-ps blocked averages. The solid line shows the total distribution (0.2 Å bins). The dashed line is the distance distribution for the t rotamer of Tyr (0.5 Å bins) and the dotted line is the distance distribution for the g− rotamer of Tyr (0.5 Å bins).
The MD simulations were also used to test whether the Tyr-to-Trp distances are correlated with the Tyr rotamer conformation. For each point in the trajectory, the rotamer configuration was classified as t (χ1 ≈ 180°) or g− (χ1 ≈ −60°). (The g+ rotamer was not observed in the simulation, in agreement with previous results for YGGFL.23) The calculated mean distances are shorter for the t rotamer than for the g− rotamer. The mean distances between the centers of mass of the Tyr and Trp sidechains were 12.8 ± 1.0 Å for structures with Tyr in g− conformation and 10.5 ± 0.8 Å for t. These values are close to the experimental distances of 11.8 to 12.9 Å between the Tyr gauche(−) rotamer and Trp and 8.8 to 10.4 Å between the Tyr trans rotamer and Trp (Figure 5) calculated as described above. Figure 8 also shows the Tyr-to-Trp distance distributions obtained in the MD simulation for each rotamer. For the g− rotamer, the Tyr-to-Trp distances were weighted strongly to an extended conformation peaking at 13 Å, with 77% of the structures exhibiting distances above 11 Å. In contrast, the Tyr-to-Trp distances for the t rotamer showed a more evenly distributed spread of distances from compact to extended, with peaks at 6 Å, 9 Å, and 12 Å.
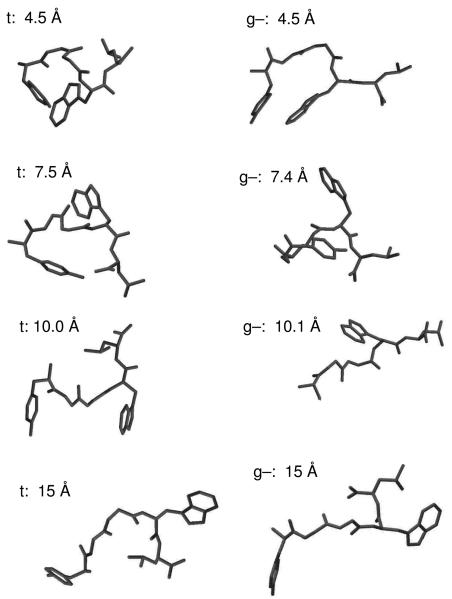
To analyze the conformations sampled in the simulation, we performed hierarchical clustering of 100,000 structures (saved once every ps). In terms of the eight backbone dihedrals, 76 clusters were identified for a 60° radius; the largest cluster had 12,479 members, and there were 51 clusters with more than 500 members. In terms of the six side-chain dihedrals, there were 57 clusters for a 60° radius; the largest cluster had 8,229 members, and 51 clusters had more than 500 members. Thus, the peptide exhibited significant structural heterogeneity. A few sample structures are shown in Figure 9. Among the sampled conformers there were many in which the individual central residues (GGW) occupied extended structures, with lower populations of left-handed and right-handed helices.
Figure 9.
Representative structures of YGGWL from the MD simulation. For each structure the Tyr rotamer configuration (g− or t) and Y-W distance are noted.
The MD simulations revealed transitions between the g− and t rotamers of Tyr on the nanosecond time scale. Based on the Tyr rotamer trajectory, the rotamer transition rates were estimated. A tabulation of lag times in the g− and t rotamers yielded average lag times of 2.1 ± 0.5 ns in the g− rotamer and 1.7 ± 0.5 ns in the t rotamer (where the uncertainties are the standard errors), corresponding to transition rates of 0.5 ns−1 and 0.6 ns−1, respectively. These rates are consistent with but slightly slower than the rotamer interchange rates for Tyr in YGGFL determined from Tyr fluorescence decays: 0.27 to 0.44 ns−1 for g− to t and 0.19 to 0.31 ns−1 for t to g−.23
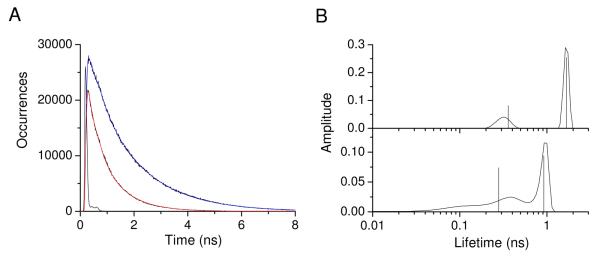
In order to compare the MD simulation with experimental results, fluorescence decay curves with FRET were calculated from the MD simulation as described in Materials and Methods. The simulated fluorescence decays are shown in Figure 10. We analyzed the simulated decays using exponential fits (both with and without convolution of the experimental instrument function) and by ME analysis. Generally, the agreement between exponential fits and ME analysis was good with the exception of the ME analysis for the simulation with FRET. Here the ME analysis yielded three peaks in the lifetime distribution, whereas non-linear least squares yielded two lifetimes of which the longest agrees well with the longest-lifetime component from ME analysis and the shortest lies between the two short-lifetime ME distributions. Otherwise, the fits to convolved and non-convolved simulated decay curves were similar, and we chose to analyze the non-convolved decay curves. By analysis of the simulated decay curves without FRET by the methods used previously for YGGFL,23 we found a g− to t rate constant of 0.31 ns−1 with an equilibrium constant ([t]/[g−]) of 0.86. Direct analysis of the first 84 ns of the trajectory gaves an equilibrium constant of 0.92 and an average g− on time of 1.4 ns corresponding to a g− to t transition rate of 0.7 ns−1. Careful observation of the trajectory showed that many g− to t transitions persisted for less than 3 picoseconds. If these were omitted, the g− on time increased to 3.3 ns corresponding to a transition rate of 0.30 ns−1. Therefore, the decay analysis accurately reported the kinetics of rotamer interchange in the absence of FRET. Experimentally, our previous paper reported an equilibrium constant around 1.4 and a g− to t transition rate of 0.27 to 0.44 ns−1.23 Therefore, the simulated rotamer interchange rates were similar to experiment, but the simulation underestimated the population of the t rotamer. The result was a slower overall fluorescence decay in the simulated fluorescence data.
Figure 10.
Simulated Tyr fluorescence decays from the MD simulation. For each step in the simulation, the probability of fluorescence emission was evaluated based on the Tyr decay rate with FRET (decay with red fit line) or without FRET (decay with blue fit line). See text for further details.
To analyze the simulated lifetimes in the presence of FRET, we fixed the rotamer interchange rate and equilibrium constant to the values determined from the simulation without FRET and followed the same procedure as used for analysis of the experimental data. The resulting distances calculated for the short and long-lifetime states were 9.7 Å and 13.0 Å. Direct analysis of the first 84 ns of the simulation gives an average t distance as 10.6 Å and an average g− distance as 12.8 Å. The similarity of these values suggests that our approach accurately recovers the average distances with the long-lifetime distance being determined more accurately than the short-lifetime distance. The agreement also supports the validity of the analysis of the experimental data, which were analyzed by the same approach.
In comparison, from the experimental data we recovered a short-lifetime distance of 8.8 Å and a long-lifetime distance of 11.5 Å. These distances are both shorter than those from the simulation by a slightly more than 1 Å. Thus, the slower overall simulated fluorescence decay compared to the experimental data could be a result of a longer average Y-W distance in the simulation compared to experiment. Another possibility is an underestimation of κ2 (i.e. an actual κ2 greater than the value of 2/3 used to calculate the experimental distances), which could produce such a result (see eq 3). However, in the simulation the average κ2 is less than 2/3, suggesting instead that 2/3 is an overestimate of κ2. Thus the slower simulated fluorescence decay compared to the experimental fluorescence decay appears to result from two factors: (1) an overestimate in the simulation of the population of the g− rotamer relative to the t rotamer of Tyr, and (2) an overestimate of the average Y-W distance in the simulation. These two effects may be correlated, since the average Y-W distance is greater in the g− rotamer than in the t rotamer.
The FRET orientational factor κ2
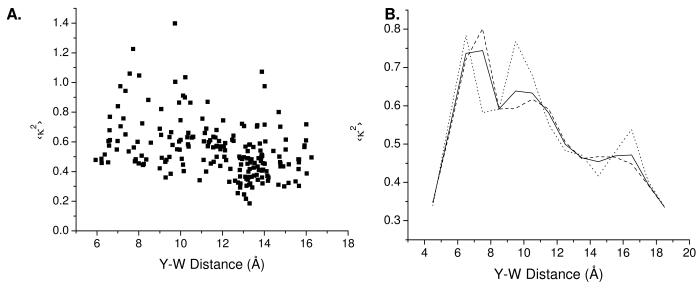
The MD simulations also permitted calculation of the FRET orientational factor κ2. Figure 11 shows plots of κ2 versus distance for energy transfer to either the La or Lb states of Trp. It is clear that a wide range of κ2 values was sampled over the course of the trajectory. The scatter in κ2 values was especially broad around 7 to 10 Å. Although the values of κ2 shown in Figure 11 span a range from 0.2 to 1, the measured FRET rate is a sum over the La and Lb transitions of Trp, given by
| (7) |
where J(La) and J(Lb)) are the FRET overlap integrals for energy transfer to the La or Lb states of Trp, and κ(La)2 and κ(Lb)2 are the corresponding orientational factors. For Tyr to Trp energy transfer, the La state accounts for 74% and the Lb state 26% of the total overlap integral.
Figure 11.
A. Orientational factor 〈κ2〉 as a weighted average over the Trp 1La and 1Lb states and averaged over 500-ps time bins (a typical fluorescence lifetime for Tyr in YGGWL) from the MD simulation versus the Tyr-to-Trp distance averaged over the same time bins. B. Distribution of 〈κ2〉 as a function of Y-W distance for the La and Lb states of Trp and for the weighted average. The solid line shows the total distribution. The dashed line is the distribution for FRET to the Trp 1La state and the dotted line is the distribution for the Trp 1Lb state.
The average κ2 values calculated from the MD simulation were 0.54 for both the t and g− rotamers of Tyr for energy transfer to the Trp La state and 0.57 for t and 0.54 for g− for energy transfer to the Trp Lb state. Averaged over the La and Lb states of Trp, 〈 κ2〉 was 0.55 for t and 0.54 for g−. Thus the average κ2 values were nearly the same for the two rotamers, predicting that the observed FRET distributions reveal actual differences in distance for the two rotamers and not orientational differences.
The MD simulations also allowed us to investigate the question of whether κ2 is correlated with distance, an issue that has been discussed extensively by Krueger and coworkers.41 The average values of κ2 as a function of Tyr-Trp distance R are shown in Figure 11. For energy transfer to both the La and Lb states of Trp the average κ2 at each Tyr-to-Trp separation was weakly correlated with distance. The data for the La and Lb states generally follow the same trend. For distances shorter than 6 Å, κ2 was 0.4 to 0.5. For intermediate distances, close to the first and second peaks in the distance distribution at 6 Å and 9.5 Å, the values were in the 0.6-0.8 range, at or above the rotationally-averaged value of 2/3. For longer distances κ2 tended to exhibit lower values, in the 0.35-0.6 range. A similar behavior is shown by the distribution of the weighted average values of the two Trp transitions. Since the population of peptide conformations with a Tyr-to-Trp distances less than 6 Å was quite small, the overall trend is one of decreasing κ2 with increasing distance.
Given the apparent correlation of κ2 with R, the question arises of the effect on average distances determined by FRET. If a single average κ2 value 〈 κ2〉 is used, the apparent distance calculated from FRET rates is given by
| (8) |
where 〈κ2〉av is the average value of κ2 used in the calculation (e.g. 2/3). We have also assumed that the radiative rate kr was constant over the ensemble. To test the effect of the distribution of distances R and the correlation between κ2 with R, we calculated 〈Rapp〉 from the MD simulation. Toward this end, values of R, κ2, and κ2/R6 were binned in 200 bins of 500 ps each to model averaging over the fluorescence lifetime. In each bin, the Tyr χ1 dihedral angle was assigned either to t or g− based on the majority conformer present. Averages 〈…〉 were computed over the entire trajectory. The resulting averages are tabulated in Table 1.
Table 1.
Averages calculated from MD simulation
First, we note that even if κ2 were constant over the distance distribution (e.g. due to orientational averaging that is rapid on the time scale of the fluorescence lifetime), 〈Rapp〉 would differ from 〈R〉 because the average 〈R−6〉 is more heavily weighted at shorter distances due to the inverse-sixth power dependence. As can be seen from Table 1, the result is deviations of up to 20% relative to 〈R〉. In contrast, 〈Rapp〉 calculated from eq 8 differs from 〈R〉 by 5% or less. This is apparently because the correlation between κ2 and R leads to an energy transfer rate that is lower than it would be if κ2 were constant over the distance distribution. This can be understood based on the distributions of R and κ2 shown in Figures 8 and 11, where it can be seen that κ2 tends to have low values for the major peak in the distance distribution (11 to 15 Å). Thus, the good agreement between Rapp and 〈R〉 in this case appears to result from offsetting errors from two sources: one from the average of 〈R−6〉 and the other from the correlation between κ2 and R. Use of the orientationally averaged value of 〈κ2〉 = 2/3 resulted in nearly the same values for 〈Rapp〉 as obtained with κ2 averaged over the MD simulation because of the 1/6 power dependence of the calculated R on 〈κ2〉.
Discussion
Enkephalins are thought to adopt distinct conformations in binding to a receptor.42,43 Our approach here was to characterize conformations by Tyr-to-Trp FRET in an enkephalin analog, YGGWL, in solution and in SDS micelles. In addition, we used MD simulations to predict distance distributions and to evaluate the effect of orientation (the κ2 factor in eq 3) on the FRET rates.
A complication in the measurement of Tyr fluorescence decays in peptides is the presence of up to three rotameric conformations of Tyr, each with a different intrinsic fluorescence decay rate. Based on previous work,23,31-34 the long lifetime state of YGGWL corresponds to the g− state in which the aromatic ring lies close to the N-terminus. The short-lifetime state is dominated by the t rotamer in which the phenol ring points away from the N-terminus. The proximity of the ring to the carbonyl group in this state allows charge-transfer quenching to occur. The g+ state is also quenched, but it had a much lower population than the other two states and did not appear at all in the MD simulation. The increased fluorescence quenching due to FRET must therefore be evaluated for each rotameric state.
N-terminal Tyr rotamer interchange on the nanosecond time scale further affect the fluorescence decay rates.23 It was therefore necessary to incorporate the rotamer interchanges rates measured for YGGFL23 in order to analyze the fluorescence decays in YGGWL. It is interesting to note that the fluorescence decay amplitudes of YGGWL match more closely to the amplitudes predicted by NMR than do those of YGGFL (see Figure 4). This apparently is a result of the fact that the shorter the fluorescence lifetimes are relative to the rotamer interchange rate, the smaller the effect of rotamer interchange on the fluorescence lifetimes.23 Therefore, the shorter lifetimes of YGGWL are less affected by rotamer interchange than the longer lifetimes of YGGFL.
Based on the rotamer interchange rates determined previously for YGGFL,23 FRET rates and the corresponding Tyr-to-Trp distances (shown in Figure 5) were estimated for the g− and t rotamers of YGGWL. The results reported here show that the average Tyr-to-Trp distance in YGGWL does not change significantly over this temperature range. Previous work in our laboratory showed that internal tyrosyl motions in YGGFL increase in amplitude as a function of temperature.35 Therefore the increasing dynamics of YGGFL at higher temperatures are likely related to a greater rate of conformational interchange rather than access to new regions of the conformational landscape. If new extended conformations existed at higher temperatures, one would expect new decay components with a longer lifetime to appear in the ME distributions. Exploration of a large space of conformational states found in our 300-K MD simulation could explain the lack of temperature dependence of the spectroscopic signals. If the peptide is so flexible that few new structures are sampled at higher temperatures, this would lead to similar FRET signals over a range of temperatures.
Comparison with MD simulations
The estimated Tyr-to-Trp distances agree well with the average distances determined for each Tyr rotamer from MD simulations. This agreement lends support to the analysis method we have used. In addition, it permits comparison to simulations of Leu-enkephalin (YGGFL). In a 10-ns simulation12 with the TIP3P water model, YGGFL sampled a range of Tyr-to-Phe distances from 5 to 15 Å, similar to the Tyr-to-Trp distances obtained in the simulation presented here. The distribution of Tyr-to-Phe distances in the 10-ns simulation formed three well defined populations with ring–to-ring distances of 6 to 8 Å, 9 to 12 Å, and 12 to 15 Å. The similarity to the Tyr-to-Trp distance distribution sampled in our 100-ns simulation suggests that the conformational states of YGGWL are similar to the conformational states of YGGFL. In contrast, an SPC water simulation by Aburi and Smith resulted in an average distance of 9.6 Å between the Tyr and Phe aromatic rings in YGGFL and a distribution sharply peaked around 9 to 10 Å with a shoulder extending to longer distances.11
FRET orientational factor
The MD simulations also provide an opportunity to evaluate common assumptions about the orientational factor κ2. The typical assumption that κ2 takes its orientationally averaged value of 2/3 has been the subject of a great deal of attention.44,45 In as series of papers on the conformations of peptides in solution combining molecular modeling with time-resolved fluorescence measurements, Pispisa and coworkers have reported that that the κ2=2/3 assumption can result in significant error in the calculated distance, indicating that the donor or acceptor fluorophore (or both) do not rotate freely.46,47 For YGGWL, based on the close agreement between the Tyr-Trp distances predicted in the MD simulations and the values calculated from the measured FRET rates, we can conclude that the FRET rates report actual differences in Tyr-Trp distances rather than different orientations of the transition dipoles relative to one another. The use of the orientationally averaged value 2/3 for κ2 does not, in itself, result in a serious error relative to the use of the average κ2 values calculated from the simulations (0.54 – 0.55). However, the apparent correlation between κ2 and R is a more serious issue.
As pointed out by Krueger and co-workers, use of the orientationally averaged value for κ2 implicitly also entails the assumption that orientation and distance are not correlated.41 The plots in Figure 11 show that indeed κ2 and R are weakly correlated. The explanation for this behavior lies most probably in the conformational flexibility of the peptide (see below). In the middle range of distances, which corresponds to the majority of sampled structures, there appear to be no restrictions of Tyr and Trp ring orientations, leading to κ2 close to the orientation-averaged value. In the low range of sampled distances orientations appear to be limited by collisions between the rings, while in the highly populated high range of distances orientations are limited by the requirement that sidechains are directed in opposite directions. In both cases this leads to κ2 values below the 2/3 average.
The FRET rate averaged over a time bin T takes the form (see eq 3):
| (9) |
where T has a length determined by the fluorescence lifetime in experimental measurements or the binning time in simulations (500 ps in this case). The usual assumptions (κ2 uncorrelated with distance and equal to 2/3) then yield an apparent distance given by
| (10) |
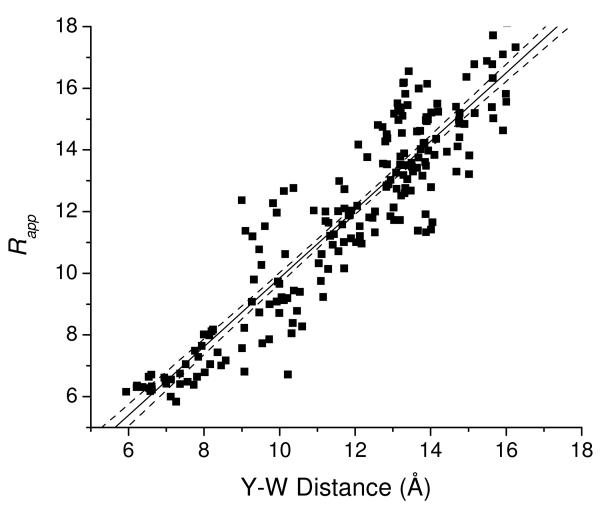
To illustrate the effect of this correlation on the calculated distances, we plotted the distance 〈Rapp〉T computed from the MD simulation (with T=500 ps, a typical fluorescence lifetime for Tyr in YGGFL, see Fig. 3) versus 〈R〉T. The results, shown in Figure 12, indicate a strong correlation between 〈Rapp〉T and 〈R〉T, as expected. Although the deviation between 〈Rapp〉T and 〈R〉T can be quite large over a given time bin, the slope of the fit line is 1.1 with an intercept of −1.4 Å, showing that the average deviation between the approximated and actual distances is small. The deviation from diagonal appears to result from the correlation between κ2 and R shown in Figure 11, where κ2 values are higher than 2/3 at intermediate distances and lower than 2/3 at higher distances. Such deviations would result in a slope > 1 and intercept < 0 Å for the plot of Rapp vs. R, as observed. As described in the Results section, the cumulate effect in the ensemble-averaged distances is quite small, due in part to the compensating effects of 〈R−6〉−1/6 averaging. However, it cannot be expected that errors will cancel in other systems. The results reiterate a caveat41 about the possible effect of κ2 correlation with distance in systems with distributions of distances between fluorophores.
Figure 12.
Tyr-to-Trp distances calculated from the MD simulation with the assumption that 〈κ2〉 = 2/3 (eq 8) versus the actual Tyr-Trp distance in the simulation. Distances were calculated for 500-ps blocks in the simulation. The line shows a linear fit and 90% confidence limits. The linear fit yields a slope of 1.12 ± 0.03 (standard error) and an intercept of −1.4 Å ± 0.4 Å. The slope and intercept differ from 1 and 0 Å, respectively, with high significance (p=0.0004 for the slope and p=0.0007 for the intercept).
Conformations in the presence of SDS Micelles
The conformation of enkephalin is thought to change with the presumed formation of more compact structures in the phospholipid membrane environment as suggested by NMR measurements.5,14-16,18 Therefore it is of interest to observe the changes in the inter-chromophore distance in the presence of SDS micelles. Several studies have shown that YGGFL interacts with the membrane surface.48 The Tyr lifetime in YGGFL increases as the SDS concentration is increased above the critical micelle concentration (Figure 6). Therefore, the changes in the long lifetime of Tyr are very likely due to membrane interaction.
There are two possible sources of the increase in lifetime that should be considered. First, it might be related to a change in the Tyr rotamer interconversion rate. Given the interaction of the tyrosyl ring with the micelle, one might expect the rotamer interconversion rate to decrease. This would result in an increase in the fluorescence lifetimes (especially the long lifetime), as we indeed observed for YGGFL (see Fig. 6). (The relation between fluorescence lifetime and rotamer interconversion rate is discussed in ref. 23.) One would also expect the relative amplitude of the long lifetime to decrease. However, this did not occur, suggesting that the rotamer interchange rate may not be strongly affected by the micellar environment. In fact, the amplitude of the long–lifetime component increased slightly at high SDS concentration (Figure 7, filled circles). This may reflect a change in rotamer populations caused by the membrane environment. However, the coupling constants observed for the tyrosyl side chain are not significantly affected by the membrane environment.49 The relationship between coupling constants and rotamer population is itself environment dependent,38,50 but this environmental dependence is not large, suggesting that the rotamer populations do not change drastically in the membrane environment. Second, the increase in the long lifetime of tyrosine may result from electronic effects. The lifetime of free tyrosine increases from 3.3 ns in aqueous solution to 4.3 ns in 60% methanol (data not shown). Therefore, the lifetime increase of YGGFL in the micelle can probably best be attributed to the change in local polarity and not to a significant change in rotamer interchange rates.
The fluorescence decay of YGGWL revealed much more significant changes in fluorescence amplitudes as a function of SDS concentration than the decay of YGGFL. From Figure 7, it is obvious that the relative amplitude of the short lifetime distribution for YGGWL increased significantly in the presence of micelles. Figure 7 shows these amplitudes relative to the rotamer populations of enkephalin determined by NMR in aqueous solution. The amplitude of the short fluorescence lifetime in the micelle was greater than that predicted by NMR in solution. If, as suggested by NMR measurements,14 the rotamer populations are not changed by interaction with the micelle, and if the rotamer interconversion rate is not changed significantly by the micelle, as the anisotropy and amplitudes for YGGFL suggest, then this result indicates a significant conformational change involving the Tyr-to-Trp distance distribution.
If YGGWL forms a compact state in the presence of micelles, the resulting decay times from the g− rotamer in that state would be difficult to distinguish from the short lifetime associated with the fluorescence decay of the t rotamer of Tyr in an extended conformation. As a result, the combined amplitudes of these two short lifetime states would appear as an increase in the total short-lifetime component in YGGWL. Changes in rotamer populations cannot account for this increase, because a corresponding increase would have been observed for the amplitude of the short lifetime component of YGGFL. Consequently, the lifetime distributions of YGGWL in the presence of SDS micelles demonstrate that the peptide formed a more compact state characterized by a shorter separation distance between Tyr and Trp. In the limit where rotamer interconversion in the micelle is assumed to be much slower than the fluorescence lifetimes and the relative orientations of Tyr and Trp are isotropically averaged (κ2=2/3), it is possible to estimate the inter-chromophore distance of the compact state from the peak of the short lifetime distribution in Figure 6 (0.09 ns). Since this lifetime represents an estimate of the lifetime of the compact state, the average lifetime of YGGFL in 20 mM SDS (1.8 ns) was used as reference for the calculation. Then the short lifetime corresponds to an energy transfer efficiency of 95% and an average distance of 7.9Å, 2.0Å shorter than the average distance in aqueous solution.
Conclusions
We have made use of time-resolved FRET in combination with ME analysis to investigate the Tyr-to-Trp separation in YGGWL. The distances were 11.5 Å and 8.8 Å (at 25°C) for the long lifetime state (assumed with support from MD simulations to consist mainly of Tyr in the g− rotamer) and the short lifetime state (assumed to consist mainly of Tyr in the t rotamer), respectively. These distances were largely independent of temperature, demonstrating that there were likely no large scale conformational changes of YGGWL within the temperature range studied here. The MD simulations predicted average Tyr-Trp distances of 12.8 and 10.5 Å in the g− and t conformers, respectively, in good agreement with the experimentally determined values. Additionally, the calculated Tyr rotamer interconversion rates were in accord with observation and the significant structural heterogeneity found in the trajectory provided an explanation of the lack of temperature dependence of the observed Trp-Tyr distance. This suggests that our MD trajectory provides a realistic representation of the structure and dynamics of YGGWL in solution. Thus, the simulation results could be used to verify our method of extracting distances from the FRET signal and to explore the influence of assuming full orientational averaging in FRET rate calculations. The MD results showed that the orientational factor κ2 exhibits a characteristic variation with distance. The resulting error in this case is small (ca. 5 %) because of the compensating effects of 〈R−6〉 averaging. However, such a fortunate offsetting of errors need not occur in other systems.
Upon addition of SDS micelles, there was a significant increase in the amplitude of the short lifetime component. This amplitude was greater even than the NMR rotamer population predicted in the absence of rotamer interconversion. This cannot be attributed solely to a change in rotamer population because the opposite effect was observed in the amplitudes of the YGGFL lifetimes, which are sensitive to the same rotamer population changes. This shows that a compact conformation was formed with decay rates that were indistinguishable from the short lifetime in the extended state. As a result, quantitative estimates of the populations and inter-ring distances are problematic for YGGWL in SDS micelles. However, the results clearly show that this change in conformation significantly affected the Tyr-to-Trp distance, a parameter thought to be important for receptor recognition.51 Both extended and compact states appear to exist in the SDS micelle environment. Though it was not possible to quantify Tyr-to-Trp distance for the compact state due to the complexity of the tyrosyl fluorescence decay, in the limit that rotamer interconversion is slow relative to the fluorescence lifetimes and the transition dipoles are orientationally averaged relative to one another, the distance was 7.9 Å, significantly lower than the distances measured for aqueous solution.
Acknowledgments
We gratefully thank Prof. N. Periasamy, Tata Institute of Fundamental Research, for sharing his maximum-entropy fitting program mem3. Acknowledgement is made to the Donors of the American Chemical Society Petroleum Research Fund for partial support of this research.. J.R.U. acknowledges support by the Dynamic Aspects of Chemical Biology Training Grant (NIH 5 T23 GM08545).
References
- 1.Hughes J, Smith TW, Kosterlitz HW, Fothergill BA, Morgan BA, Morris HR. Nature. 1975;258:577. doi: 10.1038/258577a0. [DOI] [PubMed] [Google Scholar]
- 2.Schiller PW. Peptides (New York, 1979-1987) 1984;6:219. [Google Scholar]
- 3.Hruby VJ. Life Sci. 1982;31:189. doi: 10.1016/0024-3205(82)90578-1. [DOI] [PubMed] [Google Scholar]
- 4.Malicka J, Czaplewski C, Groth M, Wiczk W, Oldziej S, Lankiewicz L, Ciarkowski J, Liwo A. Curr Top Med Chem. 2004;4:123. doi: 10.2174/1568026043451591. [DOI] [PubMed] [Google Scholar]
- 5.Graham WH, Carter ES, II, Hicks RP. Biopolymers. 1992;32:1755. doi: 10.1002/bip.360321216. [DOI] [PubMed] [Google Scholar]
- 6.Surewicz WK, Mantsch HH. Biochem. Biophys. Res. Commun. 1988;150:245. doi: 10.1016/0006-291x(88)90512-8. [DOI] [PubMed] [Google Scholar]
- 7.Han SL, Stimson ER, Maxfield FR, Scheraga HA. Int J Pept Protein Res. 1980;16:173. [PubMed] [Google Scholar]
- 8.Meirovitch H, Meirovitch E. J. Phys. Chem. 1996;100:5123. [Google Scholar]
- 9.van der Spoel D, Berendsen HJC. Biophys. J. 1997;72:2032. doi: 10.1016/S0006-3495(97)78847-7. [DOI] [PMC free article] [PubMed] [Google Scholar]
- 10.Shen M-Y, Freed KF. Biophys. J. 2002;82:1791. doi: 10.1016/s0006-3495(02)75530-6. [DOI] [PMC free article] [PubMed] [Google Scholar]
- 11.Aburi M, Smith PE. Biopolymers. 2002;64:177. doi: 10.1002/bip.10158. [DOI] [PubMed] [Google Scholar]
- 12.Nielsen BG, Jensen MØ, Bohr HG. Biopolymers. 2003;71:577. doi: 10.1002/bip.10539. [DOI] [PubMed] [Google Scholar]
- 13.Schwyzer R. Biochemistry. 1986;25:6335. doi: 10.1021/bi00368a075. [DOI] [PubMed] [Google Scholar]
- 14.Behnam BA, Deber CM. J. Biol. Chem. 1984;259:14935. [PubMed] [Google Scholar]
- 15.Chatterjee C, Mukhopadhyay C. Biopolymers. 2003;70:512. doi: 10.1002/bip.10509. [DOI] [PubMed] [Google Scholar]
- 16.Marcotte I, Separovic F, Auger M, Gagné SM. Biophys. J. 2004;86:1587. doi: 10.1016/S0006-3495(04)74226-5. [DOI] [PMC free article] [PubMed] [Google Scholar]
- 17.Picone D, D'Ursi A, Motta A, Tancredi T, Temussi PA. Eur. J. Biochem. 1990;192:433. doi: 10.1111/j.1432-1033.1990.tb19245.x. [DOI] [PubMed] [Google Scholar]
- 18.Rudolph-Bohner S, Quarzago D, Czisch M, Ragnarsson U, Moroder L. Biopolymers. 1997;41:591. [Google Scholar]
- 19.Schwyzer R, Moutevelis-Minakakis P, Kimura S, Gremlich HU. J. Pept. Sci. 1997;3:65. doi: 10.1002/(sici)1099-1387(199701)3:1<65::aid-psc90>3.0.co;2-q. [DOI] [PubMed] [Google Scholar]
- 20.Deschamps JR, Anderson-Flippen JL, George C. Biopolymers. 2002;66:287. doi: 10.1002/bip.10308. [DOI] [PubMed] [Google Scholar]
- 21.Schiller PW. Biochem. Biophys. Res. Commun. 1977;79:493. doi: 10.1016/0006-291x(77)90184-x. [DOI] [PubMed] [Google Scholar]
- 22.Schiller PW, Yam CF, Prosmanne J. J. Med. Chem. 1978;21:1110. doi: 10.1021/jm00209a004. [DOI] [PubMed] [Google Scholar]
- 23.Unruh JR, Liyanage MR, Johnson CK. J. Phys. Chem. B. 2007;111:5494. doi: 10.1021/jp0645059. [DOI] [PubMed] [Google Scholar]
- 24.Harms GS, Pauls SW, Hedstrom JF, Johnson CK. Journal of Fluorescence. 1997;7:273. [Google Scholar]
- 25.Livesey AK, Brochon J-C. Biophys. J. 1987;52:693. doi: 10.1016/S0006-3495(87)83264-2. [DOI] [PMC free article] [PubMed] [Google Scholar]
- 26.Swaminathan R, Periasamy N. Proceedings of the Indian Academy of Sciences (Chemical Sciences) 1996;108:39. [Google Scholar]
- 27.Brooks BR, Bruccoleri R, Olafson B, States D, Swaminathan S, Karplus M. J. Comput. Chem. 1983;4:187. [Google Scholar]
- 28.Yamamoto Y, Tanaka J. Bull. Chem. Soc. Jap. 1972;45:1362. [Google Scholar]
- 29.Hooker TM, Schellman JA. Biopolymers. 1970;9:1319. doi: 10.1002/bip.1970.360091104. [DOI] [PubMed] [Google Scholar]
- 30.Förster T. Annalen der Physik. 1948;2:55. [Google Scholar]
- 31.Guzow K, Ganzynkowicz R, Rzeska A, Mrozek J, Szabelski M, Karolczak J, Liwo A, Wiczk W. J. Phys. Chem. B. 2004;108:3879. [Google Scholar]
- 32.Noronha M, Lima JC, Lamosa P, Santos H, Maycock C, Ventura R, Maçanita AL. J. Phys. Chem. A. 2004;108:2155. [Google Scholar]
- 33.Gauduchon P, Wahl P. Biophys. Chem. 1978;8:87. doi: 10.1016/0301-4622(78)85026-1. [DOI] [PubMed] [Google Scholar]
- 34.Ross JBA, Laws WR, Rousslang KW, Wyssbrod HR. Tyrosine Fluorescence and Phosphorescence from Proteins and Polypeptides. In: Lakowicz JR, editor. Topics in Fluorescence Spectroscopy, Volume3: Biochemical Applications. Plenum Press; New York: 1992. p. 1. [Google Scholar]
- 35.Harms GS, Freund WL, Johnson CK. J. Phys. Chem. B. 1998;102:5004. [Google Scholar]
- 36.Lakowicz JR, Gryczynski I, Laczko G, Wiczk W. Biophys. Chem. 1993;47:33. doi: 10.1016/0301-4622(93)80030-m. [DOI] [PubMed] [Google Scholar]
- 37.Kobayashi J, Higashijima T, Nagai U, Miyazawa T. Biochim. Biophys. Acta. 1980;621:190. doi: 10.1016/0005-2795(80)90171-3. [DOI] [PubMed] [Google Scholar]
- 38.Altona C, Francke R, de Haan R, Ippel JH, Daalmans GJ, Westra Hoekzema AJA, van Wijk J. Magn. Reson. Chem. 1994;32:670. [Google Scholar]
- 39.Cabane B, Duplessix RJ. Biochim. Biophys. Acta. 1982;43:1529. [Google Scholar]
- 40.Deaton KR, Feyen EA, Nkulabi HJ, Morris KF. Magn. Reson. Chem. 2001;39:276. [Google Scholar]
- 41.VanBeek DB, Zwier MC, Shorb JM, Krueger BP. Biophys J. 2007;92:4168. doi: 10.1529/biophysj.106.092650. [DOI] [PMC free article] [PubMed] [Google Scholar]
- 42.Lomize AL, Pogozheva ID, Mosberg HI. Biopolymers. 1996;38:221. doi: 10.1002/(SICI)1097-0282(199602)38:2%3C221::AID-BIP8%3E3.0.CO;2-X. [DOI] [PubMed] [Google Scholar]
- 43.Nikiforovich GV, Hruby VJ, Prakash O, Gehrig CA. Biopolymers. 1991;31:941. doi: 10.1002/bip.360310804. [DOI] [PubMed] [Google Scholar]
- 44.Dale RE, Eisinger J, Blumberg WE. Biophys. J. 1979;26:161. doi: 10.1016/S0006-3495(79)85243-1. [DOI] [PMC free article] [PubMed] [Google Scholar]
- 45.van der Meer BW. Rev. Mol. Biotechnol. 2002;82:181. doi: 10.1016/s1389-0352(01)00037-x. [DOI] [PubMed] [Google Scholar]
- 46.Pispisa B, Palleschi A, Mazzuca C, Stella L, Valeri A, Venanzi M, Formaggio F, Toniolo C, Broxterman QB. Journal of Fluorescence. 2002;12:213. doi: 10.1002/bip.10118. [DOI] [PubMed] [Google Scholar]
- 47.Pispisa B, Palleschi A, Stella L, Venanzi M. Trends Photochem. Photobiol. 2001;8:37. [Google Scholar]
- 48.Deber CM, Behnam BA. Proc Natl Acad Sci U S A. 1984;81:61. doi: 10.1073/pnas.81.1.61. [DOI] [PMC free article] [PubMed] [Google Scholar]
- 49.Behnam BA, Deber CM. Binding of Methionine-Enkephalin to Micelles: Effect on Peptide Side Chain Conformation. In: Hruby VJ, Rich D, editors. Peptides: Structure and Function. Pierce Chemical Co.; Rockford, IL: 1983. p. 445. [Google Scholar]
- 50.Kraszni M, Szakács Z, Noszál B. Anal. Bioanal. Chem. 2004;378:1449. doi: 10.1007/s00216-003-2386-z. [DOI] [PubMed] [Google Scholar]
- 51.Deschamps JR, George C, Flippen-Anderson JL. Biopolymers. 1996;40:121. doi: 10.1002/bip.360400102. [DOI] [PubMed] [Google Scholar]


