Abstract
AIMS
To develop a population pharmacokinetic model for penciclovir (famciclovir is a prodrug of penciclovir) in adults and children and suggest an appropriate dose for children. Furthermore, to develop a limited sampling design based on sampling windows for three different paediatric age groups (1–2, 2–5 and 5–12 years) using an adequate number of subjects for future pharmacokinetic studies.
METHODS
Penciclovir plasma data from six different adult and paediatric studies were supplied by Novartis. Population pharmacokinetic modelling was undertaken in NONMEM version VI. Simulations in MATLAB were used to select an oral paediatric dose that gives similar exposure to 500 mg in adults. Optimal sampling times and sampling windows were obtained in MATLAB and simulations in NONMEM were used to select adequate sample sizes for three paediatric age groups.
RESULTS
A two-compartment, first-order absorption model with an absorption lag time, allometric weight models on V1, V2 and Q, and an allometric weight model, age and creatinine clearance as covariates on CL adequately describe the pharmacokinetics of penciclovir in adults and children. Estimated CL (l h−1 70 kg−1) and Vss (l.70 kg−1) were 31.2 and 83.1, respectively. An oral dose of 10 mg kg−1 body weight in children was predicted to give similar exposure as 500 mg in adults. A single sampling windows design (0.25–0.4, 0.5–1, 1.25–1.75, 2.75–3.5 and 7.25–8 h) for five samples per subject and 10 subjects in each of the paediatric age groups is recommended for future studies.
CONCLUSIONS
A population pharmacokinetic model of penciclovir in adults and children has been developed. A prospective study design, including dose adjustment, cohort size and blood sampling design has been recommended.
Keywords: famciclovir, mixed effects modelling, optimal design, paediatric pharmacokinetics, population pharmacokinetics
WHAT IS ALREADY KNOWN ABOUT THIS SUBJECT
Famciclovir is licensed in adults for the treatment of herpes zoster and herpes simplex viral infections.
The pharmacokinetics of famciclovir has been extensively studied in adults, but no population pharmacokinetic model has been published to date.
There is limited information about the pharmacokinetics of famciclovir in children.
WHAT THIS STUDY ADDS
A population pharmacokinetic model of penciclovir (famciclovir is a prodrug of penciclovir) was developed in adults and children.
New paediatric pharmacokinetic studies have been designed using a 10 mg kg−1 dose in children that gives similar exposure to 500 mg in adults.
A sampling windows design for sparse sampling based on an adequate number of subjects in three paediatric age groups has also been developed.
Introduction
It is estimated that >50% of medicines used in children have never been tested for safety and efficacy in the population [1]. Optimal treatment requires a good understanding of a drug's pharmacokinetics and pharmacodynamics in the intended patient population [2]. This puts paediatric patients at risk of both suboptimal treatment and/or serious adverse effects and they are therefore often referred to as ‘therapeutic orphans’[3]. The pharmacokinetics of drugs has been shown to differ widely between adults and children due to differences in physiology, and differences in enzyme maturation and clearance mechanisms [4–6]. Therefore, extrapolation of adult pharmacokinetics to children must be performed carefully. Regulatory authorities such as the Food and Drug Administration and European Medicines Agency have issued guidelines recommending that a drug development programme should include paediatric evaluation especially when the drug is intended to be used in the population [7].
Famciclovir is an orally administered pro-drug of the antiviral agent penciclovir [8]. Famciclovir is licensed in adults for treatment of herpes zoster and herpes simplex infections at therapeutic dose levels between 125 and 750 mg. The pharmacokinetics of famciclovir has been extensively studied in adults, but no population pharmacokinetic model has been published to date [9–13]. After oral administration, famciclovir is rapidly transformed to penciclovir and little or no parent compound is recovered in blood or urine [9]. The absolute bioavailability of penciclovir is between 70 and 75% and time to reach maximum concentration is between 0.5 and 0.75 h post dose [8]. Penciclovir is extensively distributed into body tissues with a volume of distribution >1 l kg−1. It is less than 20% bound to plasma proteins over the therapeutic concentration range [9]. Plasma concentration profiles of penciclovir show a biphasic decline with a terminal half-life of about 2–2.5 h and it is mainly renally eliminated via tubular secretion [14]. In healthy adults, the total plasma clearance of penciclovir is approximately 35 l h−1 and renal clearance of penciclovir following oral administration of famciclovir is approximately 28 l h−1[9, 10, 14]. Penciclovir inhibits the activity of herpes simplex virus types 1 and 2 and varicella zoster virus by interfering with herpes viral DNA synthesis and replication [8].
Despite clinical success with the use of famciclovir in the treatment of viral infections in adults, there are limited information and pharmacokinetic data in children. At the time of this analysis, no prospective study of the pharmacokinetics of famciclovir had been completed in children. Due to ethical and practical constraints of performing such studies in this population, it is essential that the maximum amount of information is extracted from the minimum necessary amount of data. A combination of population pharmacokinetic modelling and application of optimal design theory provides a rational means of designing a study to meet these goals.
Thus the objectives of this analysis were twofold:
Develop a population pharmacokinetic model using the currently available data in adults and children to provide a model-based prediction of the dose–exposure relationship in the paediatric population.
Apply optimal design methodologies to optimize the design of a paediatric study with respect to: dose individualization, number of patients required and the timing of pharmacokinetic samples per patient. For the purpose of this exercise a single-dose study in paediatric patients in three age cohorts (1–2, 2–5 and 5–12 years) was assumed. The aim of the paediatric study is to confirm the dose–exposure relationship predicted from the present analysis.
Methods
Population pharmacokinetic modelling
The plasma pharmacokinetic data from six clinical trials were provided by Novartis AG (Basel, Switzerland). The data included a total of 69 subjects (160 occasions), of whom 23 were children (39 occasions, studies 4 and 5), and included 1676 penciclovir concentrations (322 in children). Oral famciclovir or intravenous infusion of penciclovir was administered in the studies. Details of the studies are given in Table 1 and the details of the dataset covariates (age, weight, sex, serum creatinine and creatinine clearance) are given in Table 2. Individual creatinine clearance was calculated using the Cockcroft and Gault equation [15]. Population parameter values were estimated using a nonlinear mixed effects model in NONMEM [16], both between-subject and residual variability (random effects) and typical parameter values (fixed effects) were related to available covariates. Only models that successfully minimized were considered; however, the covariance step was not required a priori. A drop of 3.84 points in the objective function value (Obj) for each additional parameter was required before the more complex model was considered, unless the more complex model had less bias shown by visual inspection of the diagnostic and individual concentration time plots. One- and two-compartment first-order absorption pharmacokinetic models were fitted to the data using FOCE with INTERACTION option with parameterization in clearances and volumes. The volume of distribution (V), total body clearance (CL) and the absorption constant (ka) were estimated for the one-compartment pharmacokinetic model. The volume of distribution of the central compartment (V1), volume of distribution of the peripheral compartment (V2), total body clearance (CL), intercompartmental clearance (Q) and the absorption rate constant (ka) were estimated for the two-compartment pharmacokinetic model. The between-subject variability terms were estimated assuming a proportional variance model. An absorption lag time (Tlag) was estimated to help describe the absorption process and the relative bioavailability (F) for penciclovir was also calculated. The residual variability was described using a combined additive and proportional error model.
Table 1.
Study summary information
| Study | Description | No. of subjects | No. of occasions | Total no. of samples | Age range (years) |
|---|---|---|---|---|---|
| 1 | Single ascending dose (single oral dose) | 20 | 80 | 811 | 23–59 |
| 2 | Bioavailability (single i.v. infusion followed by single oral dose) | 12 | 24 | 284 | 20–35 |
| 3 | Renal impairment patients (single oral dose) | 11 | 11 | 131 | 25–63 |
| 4 | Immunocompromised patients (single i.v. infusion and 2 subjects were followed with single oral dose after wash-out) | 9 | 11 | 91 | 2–17 |
| 5 | Hepatitis B patients (multiple oral dose) | 14 | 28 | 231 | 6–11 |
| 6 | I.v. infusion multiple dose (multiple i.v. infusion dose) | 3 | 6 | 128 | 25–29 |
Note oral famciclovir and intravenous penciclovir were administered.
Table 2.
Covariate information available in the data (69 subjects)
| Combined | Children | Adults | |||||||
|---|---|---|---|---|---|---|---|---|---|
| Covariate | Mean | SD | Range | Mean | SD | Range | Mean | SD | Range |
| Number of subjects | 69 | – | – | 23 | – | – | 46 | – | – |
| Number of occasions | 160 | – | – | 39 | – | – | 121 | – | – |
| Age (years) | 26.5 | 15.8 | 2–63 | 8.1 | 3.4 | 2–17 | 35.8 | 10.6 | 20–63 |
| Weight (kg) | 59.3 | 23.7 | 13.9–94.6 | 29.5 | 12.2 | 13.9–59.8 | 74.1 | 9.7 | 56.4–94.6 |
| Serum creatinine (mg dl−1) | 0.94 | 0.33 | 0.28–1.94 | 0.60 | 0.13 | 0.28–0.78 | 1.10 | 0.27 | 0.69–1.94 |
| Sex (M/F) | 62/7 | – | – | 17/6 | – | – | 45/1 | – | – |
| Creatinine clearance (ml min−1) | 87.9 | 34.5 | 27.6–175.6 | 58.2 | 19.9 | 27.6–122.5 | 102.8 | 30.4 | 45.5–175.6 |
Potential covariate effects were initially determined by examining plots of the maximum a posteriori parameter estimates vs. each available covariate to see if trends were visible. Secondly, individual deviations from the population mean values (ETA values) were plotted against each available covariate using the best model without covariates also to examine trends. If the plot of ETA values vs. a particular covariate showed a trend, the covariate was then included in the model and the value of the objective function and diagnostic plots, including ETA plots vs. covariates, was used to determine whether the covariate would remain or not. Previous publications have shown the merit of including a model for weight to explain changes in pharmacokinetics [17]. An allometric weight model [18–20] was applied to standardize the pharmacokinetic parameters using a standard weight (WTSTD) of 70 kg. An allometric weight model for clearance parameters is given by  and for volume parameters is given
  where
where  and
and  are the weight functions for clearance parameters and volume of distribution parameters, respectively, and WT is the individual weight value. Several age models were tested to describe the changes in clearance with age; however, an empirical fractional age model was applied to describe the age-related changes in clearance using a standard age (AGESTD) of 40 years. The model is defined by (i) when age is <40 years,
  and (ii) when the age is ≥40 years
  where
where  is the fractional effect of age on clearance, AGE is the individual age value, KAGE<40 and KAGE≥40 are estimated as parameters in the model.
An empirical creatinine clearance power model was used to describe the effect of renal function on clearance using a standard creatinine clearance (CLSRSTD) of 100 ml min−1. The equation for the model is given by  where
where  is the creatinine clearance function for clearance, CLCR is the individual creatinine clearance value and PCLCR is the power parameter that is estimated as a parameter in the model.
The equations for clearance and volume were
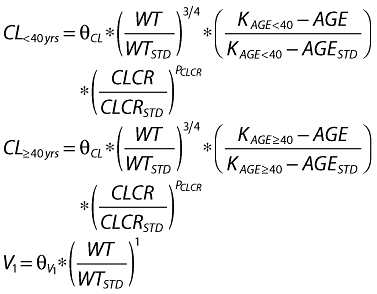 |
where θCL and  are the population estimates for clearance and volume, respectively.
A nonparametric bootstrap analysis of the final model was undertaken using Wings for NONMEM [21, 22]. One thousand bootstrap replicates were sampled from the original data using each individual's datasets as the sampling unit, and the mean and standard deviation of the resulting parameter estimates were calculated.
Paediatric dose adjustment
Paediatric oral single dose (mg per kg weight) that gives similar exposure in terms of AUC and Cmax as 500 mg adult dose was selected by simulation. Using the final pharmacokinetic model and parameter estimates, simulations for dose adjustments were carried out in MATLAB (version 7.5.0 R2007b). Because the original dataset had no children <2 years old, the model was extrapolated for children in the lowest age group (1–2 years) using information about renal maturation (serum creatinine) and size (weight). Reference values for weight and serum creatinine were obtained from the literature for both adults and children [23–25]. The reference serum creatinine (mg dl−1) and weight (kg) used for the three age groups (1–2, 2–5 and 5–12 years) were within the range of 0.40–0.43, 0.43–0.50 and 0.50–0.65 and 9.9–12.38, 12.38–18.37 and 18.37–38.30 kg, respectively. The reference serum creatinine (mg dl−1) and weight (kg) for adults were 0.99 (SD 0.2) and 70 (SD 12). Serum creatinine values were converted to creatinine clearance using the Cockroft and Gault equation [15]. Simulations were carried out for the different paediatric age groups using the following doses: 8, 8.5, 9, 9.5, 10, 10.5, 11, 11.5 and 12 mg kg−1 of body weight. Adult simulations were based on a standard dose of 500 mg. One thousand individuals per age group and dose level were simulated and mean AUC, SD of AUC, mean Cmax, SD of Cmax, AUC ratio (paediatric mean /adult mean) and Cmax ratio were determined.
Sampling times and sampling windows optimization
This section describes optimization of experimental design, i.e. sampling times for parameter estimation in future population pharmacokinetic experiments in three different paediatric age groups: 1–2, 2–5 and 5–12 years. Using the population pharmacokinetic model developed, the parameter estimates and the selected dose, optimal sampling times and sampling windows were determined for the different age groups. Optimal sampling times were determined using the final model and based on the population Fisher information matrix and modified Fedorov exchange algorithm using the D-optimality criterion [26]. The expressions for the population Fisher information matrix were implemented in MATLAB [27, 28]. However, these were modified to account for covariates in the model based on approximations that have been proposed in the literature [29]. The population Fisher information matrix over the continuous distribution of covariates in the model was approximated by a Monte Carlo integration of the population Fisher information matrix over the covariates. In order to reduce the computation time, a Latin hypercube sampling technique [30] was used to sample efficiently from the covariate distributions. The population Fisher information matrix was linked to a modified Fedorov exchange algorithm [31] programmed in MATLAB using a grid size of 0.25 for optimization. The design region was set to between 0 and 8 h, and one elementary design and five sampling times per subject were assumed.
The sampling times were used to determine optimal sampling windows for the different age groups using the population Fisher information matrix and a three-stage approach recently developed [32]. Optimal sampling windows were obtained around the fixed D-optimal time points for each age group in a way that reflects parameter sensitivities. A 95% mean efficiency level and uniform distribution of samples within the windows were assumed. To simplify the sampling windows design so that only one design would be implemented for all age groups, the final sampling windows were formed from the sampling windows design obtained for the three age groups. The efficiency of the final sampling windows design was calculated for the three different age groups.
Sample size calculations
The sample sizes for the different paediatric age groups were determined using NONMEM simulations based on a confidence interval (CI) approach [33]. Simulations were used to determine the power of the final sampling windows design for the different paediatric age groups with different sample sizes to estimate the CI on the mean of a parameter of choice with a specified level of precision. The parameters of choice were clearance and volume of distribution of the central compartment. These parameters were selected because they were expected to be the most important for exposure characteristics. For the different sample sizes in each age group, MATLAB was used to simulate sampling times from the windows, the dose based on the selected dose, serum creatinine and weight from the reference values and the creatinine clearance. These were presented as input files for NONMEM where plasma concentrations were simulated using the final model and parameters were estimated (FOCE with INTERACTION option). The estimated parameters and the standard errors were used to calculate the 95% CIs for clearance (CL) and volume of distribution of the central compartment (V1) for each simulation. The 95% CIs were calculated as θ ± 1.96 SE(θ) where θ and SE(θ) were the parameter estimate and the standard error, respectively. Two hundred successful simulation estimation runs were carried out for each age group and sample size. Because nonmem does not produce the standard error in some cases even with successful convergence, the first 200 simulations that converged successfully with parameter standard errors estimated were taken. Two precision limits (10 and 20%) were used for CL, whereas three different precision limits (30, 40 and 50%) were used for V1. The power of the design for a parameter is the fraction of the simulations (200) that estimated the CI on the parameter within a precision limit.
Results
Population pharmacokinetic modelling
The important steps in the model-building process for the pharmacokinetics of famciclovir/penciclovir in adults and children are presented in Table 3. The best model was a two-compartment first-order absorption model parameterized using ka, CL, V1, V2, Q, Tlag and F. The between-subject variability of the absorption lag time (BSVT-lag) could not be estimated and the between-subject variability of the bioavailability parameter (BSVF) was low in all models and was therefore removed from the final model. Attempts to include a full variance–covariance matrix of ka, CL, V1, V2 and Q in the model resulted in stability issues and therefore the final model only has diagonal elements. Also, attempts to include between-occasion variability on the parameters resulted in high standard errors on the between-occasion variability terms and other parameters and only marginally improved the fitting and it was therefore excluded from the final model.
Table 3.
Important steps in the population pharmacokinetic modelling of adult and paediatric penciclovir data in NONMEM
| Model | Description | Obj | ΔObj | Ntheta |
|---|---|---|---|---|
| 6 | 2 comp; Tlag; weight on V1, V2, CL & Q; age on CL; CLCR on CL | −2229 | −661 | 10 |
| 5 | 2 comp; Tlag; weight on V1, V2, CL & Q; age on CL | −2221 | −653 | 9 |
| 4 | 2 comp; Tlag; weight on V1, V2, CL & Q; CLCR on CL | −2207 | −639 | 8 |
| 3 | 2 comp; Tlag; weight on V1, V2, CL & Q | −2200 | −632 | 7 |
| 2 | 2 comp; Tlag | −1963 | −395 | 7 |
| 1 | 2 comp | −1568 | 0 | 6 |
The individual maximum a posteriori estimates of clearance vs. weight, age and creatinine clearance are plotted in Figure 1. Plots of the observed penciclovir concentration vs. model predicted concentrations before (model 1) and after the addition of covariates (model 6) are shown in Figure 2. Figure 3 shows the plots of the weighted residuals vs. time on the logarithmic scale and the weighted residuals vs. population predicted penciclovir concentrations. Figure 4 shows plots of observed vs. population predicted and observed vs. individual predicted for adults and children. The parameter estimates and their standard errors expressed as percentage coefficient of variation obtained for the final model (model 6) together with the estimates obtained from bootstrap analysis are presented in Table 4. Of the 1000 bootstrap replicates, 923 resulted in successful minimization with a successful covariance step implemented and were used for the analysis. The final model for penciclovir in adults and children obtained from this analysis is given in Table 5. The predictive performance of the final model was assessed using the visual predictive check (VPC) and the results are presented in Figure 5. Median lines, 90% prediction intervals and the data are plotted based on dose-normalized concentration of penciclovir for children and adults using oral and intravenous infusion grouping. Also, the predictive performance of the clearance model was assessed by simulating the 95% prediction interval using the final clearance model and this is plotted with the individual population predicted values from the final model. The results are presented in Figure 6 for children only (0–18 years), plot A and adults and children (0–70 years), plot B.
Figure 1.
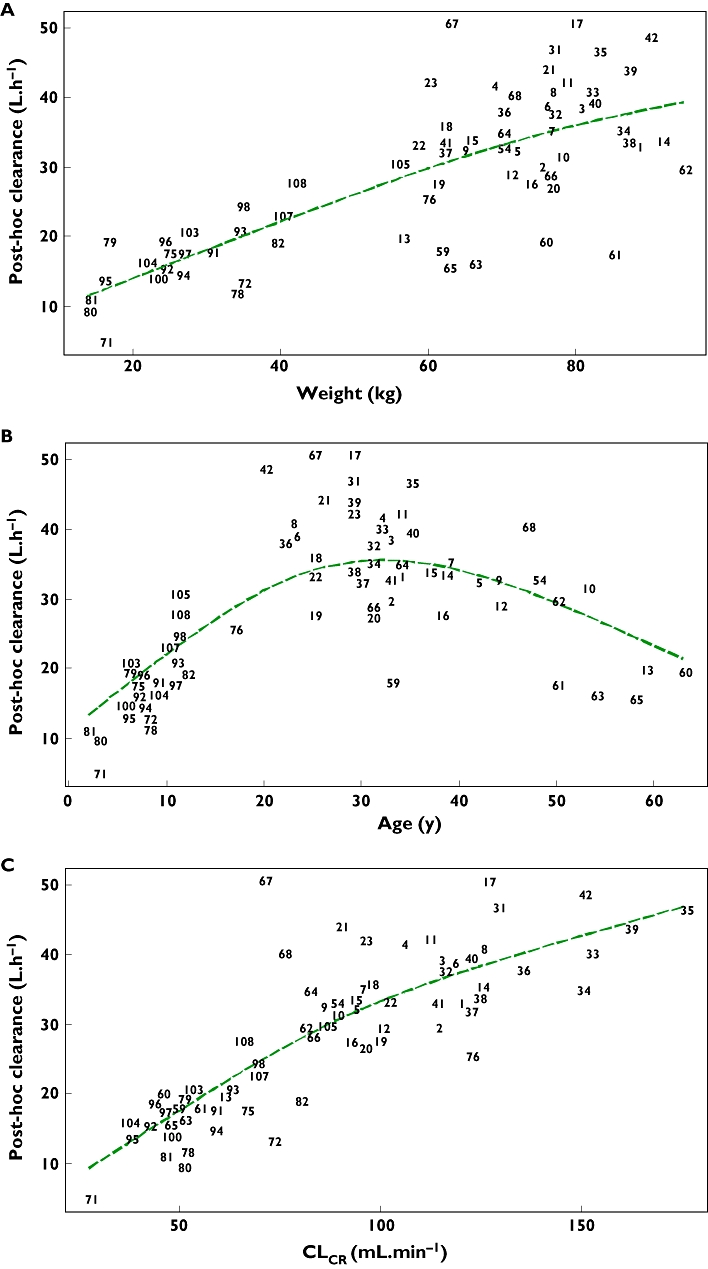
Individual maximum a posteriori estimates of penciclovir clearance vs. weight (a), age (b) and creatinine clearance (c). The dashed line is a smooth line through the data
Figure 2.
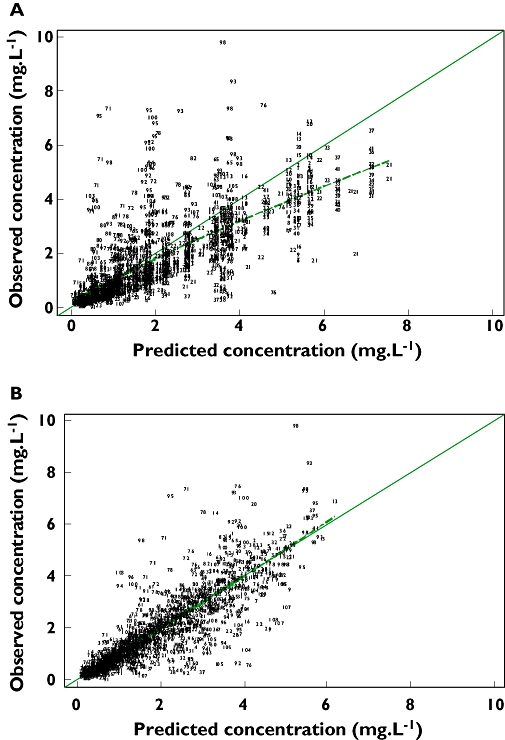
Plots of observed vs. population predicted penciclovir concentrations for the two-compartment first-order absorption model with no covariates (a) and the final model, i.e. with covariates (b). The dashed line is a smooth line through the data
Figure 3.
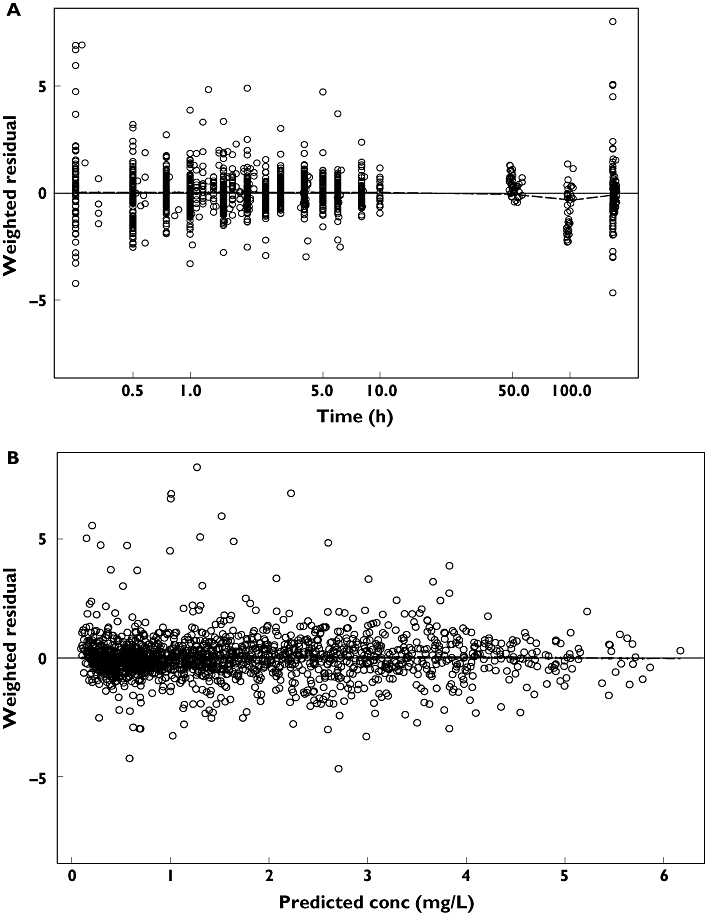
Plot of the weighted residuals vs. time on the logarithmic scale (a) and plot of weighted residuals vs. population predicted penciclovir concentrations (b) for the final model (model 6). The dashed line is a smooth line through the data
Figure 4.
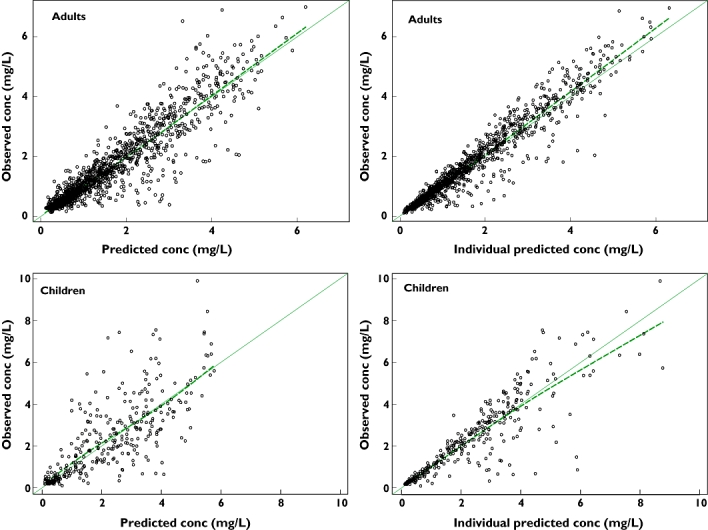
Plots of observed vs. population predicted and observed vs. individual predicted penciclovir concentrations for adults and children. The smooth line is a line of identity and the dashed line is a smooth line through the data
Table 4.
Parameter estimates of the final model for penciclovir and the results of bootstrap resampling procedure
| Original data | Bootstrap procedure | |||
|---|---|---|---|---|
| Parameter | Estimate | CV (%) | Estimate | CV (%) |
| ka (h−1) | 1.86 | 10.3 | 1.87 | 10.7 |
| CL (l h−1 70 kg−1) | 31.2 | 6 | 31.3 | 6.27 |
| V1 (l.70 kg−1) | 28.6 | 6 | 28.5 | 6.19 |
| V2 (l.70 kg−1) | 54.5 | 4.9 | 54.7 | 5.03 |
| Q (l h−1 70 kg−1) | 60.2 | 7.1 | 60.3 | 7.03 |
| F | 0.598 | 2.9 | 0.598 | 2.97 |
| Tlag (h) | 0.206 | 2.2 | 0.206 | 2.39 |
| KAGE < 40 | 159 | 37.4 | – | – |
| KAGE ≥ 40 | 113 | 24.4 | – | – |
| Exponent of FCLCR | 0.28 | 45.7 | 0.270 | 47.9 |
| BSVka | 0.640 | 25.9 | 0.627 | 25.35 |
| BSVCL | 0.23 | 22.3 | 0.220 | 22.34 |
| BSVV1 | 0.003 fix | – | 0.003 fix | – |
| BSVV2 | 0.255 | 29.3 | 0.250 | 29.50 |
| BSVQ | 0.342 | 59.4 | 0.331 | 55.12 |
| Proportional error | 0.221 | 9.6 | 0.221 | 9.48 |
| Additive error (mg l−1) | 0.01 fix | – | 0.01 fix | – |
Table 5.
The final model for famciclovir in adults and children
| Parameter | Model |
|---|---|
| ka = | 1.86 |
| CL<40 years = | 31.2 * (WT/70)0.75* (159-AGE/159–40) * (CLCR/100)0.28 |
| CLAGE<40 years = | 31.2 * (WT/70)0.75* (113-AGE/113–40) * (CLCR/100)0.28 |
| V1 = | 28.6 * (WT/70) |
| V2 = | 54.5 * (WT/70) |
| Q = | 60.2 * (WT/70)0.75 |
Figure 5.
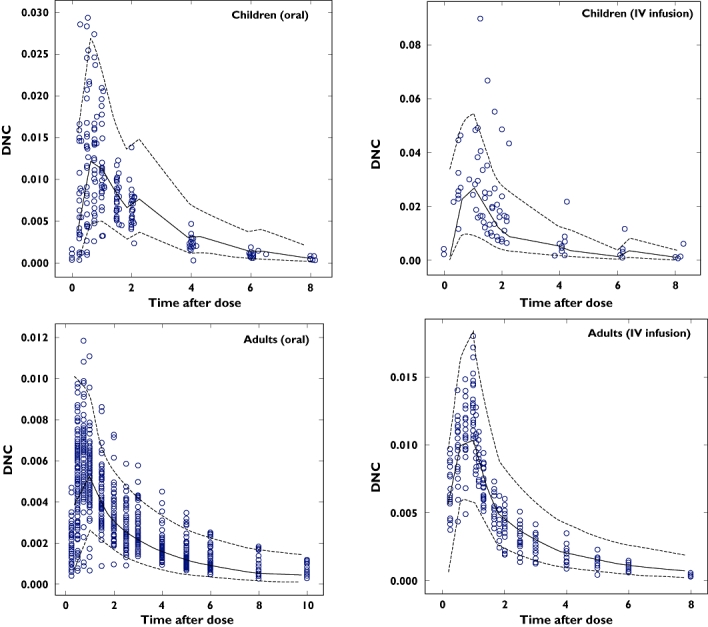
Plots of visual predictive check based on dose normalized concentration of penciclovir for children and adults using oral and intravenous infusion grouping. The broken lines represent the 90% prediction intervals and the continuous lines represent the median lines. The open circles are the observed penciclovir concentrations
Figure 6.
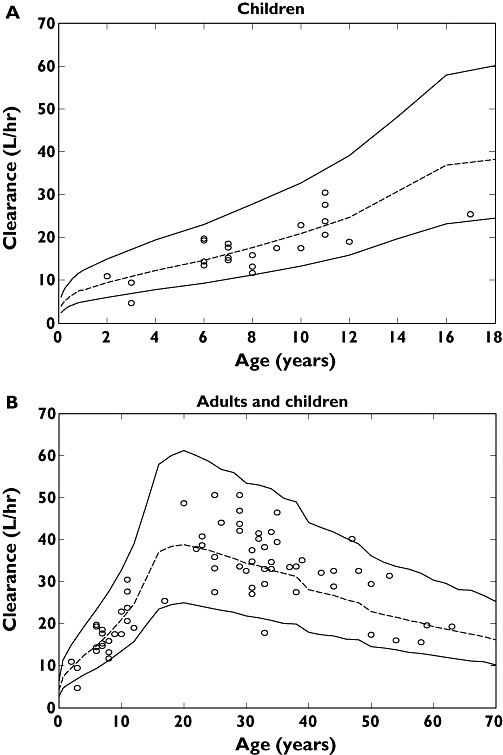
Plots of individual predicted penciclovir clearance for the final model vs. age with the 95% prediction interval from the final clearance model for children only, 0–18 years (a) and adults and children, 0–70 years (b). The dashed lines are the median lines and the continuous lines are the 95% prediction intervals
Paediatric study design
Paediatric dose adjustment
The aim was to obtain a paediatric dose adjustment based on body weight that will achieve the same exposure in children compared with the 500-mg adult dose. From the results a dose of 10 mg kg−1 body weight was selected because it gave an AUC ratio (paediatric mean/adult mean) that is close to 1 (0.95, 0.96, 1.02 for the three paediatric age groups) in all paediatric age groups, while the Cmax ratio is <1.2 (1.05, 1.10 and 1.15 for the three paediatric age groups). Figure 7 shows the plot of median lines and the 95% prediction intervals for the three different paediatric age groups (1–2, 2–5 and 5–12 years) using a dose of 10 mg kg−1 body weight and adults based on the 500-mg dose. The selected dose of 10 mg kg−1 should only be considered as a test dose especially in the lowest paediatric age groups and must not be used for labelling purposes. Information from the intended paediatric studies will be used to qualify this dose further.
Figure 7.
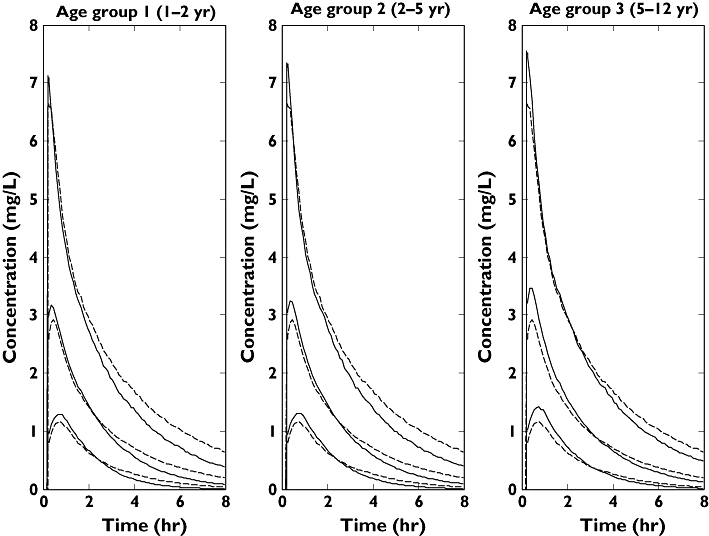
Plasma concentration–time profiles (95% prediction intervals and median lines) for the different paediatric age groups using a dose of 10 mg kg−1 of body weight and adults using an adult dose of 500 mg. Adult profiles are depicted with the dashed lines while paediatric profiles are depicted with the continuous lines
Sampling times and sampling windows optimization
Table 6 presents the results of optimizing sampling times and windows assuming 95% mean efficiency for the sampling windows relative to the fixed D-optimal time points and uniform distribution of samples within the windows. Optimizations were carried out using the selected paediatric dose of 10 mg kg−1 body weight, the final population pharmacokinetic model and the parameter estimates together with the reference values for the covariates in the model. The results showed that the sampling times and the sampling windows are not very different for the three age groups, therefore for simplicity the sampling windows for the different age groups were used to form a single sampling windows design that will be implemented in all children. The issue of overlap between the sampling windows (windows 2 and 3) was also addressed in the new single sampling windows design. Also, it was observed that the length of the first sampling window was very short (0.02 or 0.03 h) in the age groups and this was also extended in the new single sampling windows design. However, it was seen that the efficiencies of the sampling windows design were very sensitive to the length of the first sampling windows, which is due to the steepness of the profile during the absorption phase as a result of the fast absorption of penciclovir. Therefore the length of the first sampling window was extended carefully from 0.02 or 0.03 h to 0.15 h and the final single sampling windows design obtained for all children was 0.25–0.4, 0.5–1, 1.25–1.75, 2.75–3.5 and 7.25–8 h. This final single sampling windows design is at least 85% efficient for all paediatric age groups.
Table 6.
Results of sampling times and sampling windows optimization for the different paediatric age groups, assuming 95% mean efficiency for the sampling windows design relative to the fixed D-optimal time points and uniform distribution of samples within the windows
| Age groups (years) | ||||
|---|---|---|---|---|
| Sampling properties | Sample number | 1–2 | 2–5 | 5–12 |
| Optimal sampling times (h) | 1 | 0.25 | 0.25 | 0.25 |
| 2 | 0.70 | 0.70 | 0.85 | |
| 3 | 1.35 | 1.30 | 1.00 | |
| 4 | 3.05 | 3.00 | 2.80 | |
| 5 | 8.00 | 8.00 | 8.00 | |
| Normalized determinant | 3.32 | 3.42 | 3.57 | |
| Optimal sampling windows (h) | 1 | 0.25–0.28 | 0.25–0.28 | 0.25–0.27 |
| 2 | 0.58–0.82 | 0.58–0.82 | 0.62–1.08 | |
| 3 | 0.70–2.00 | 0.66–1.94 | 0.26–1.73 | |
| 4 | 2.47–3.63 | 2.48–3.52 | 2.61–2.99 | |
| 5 | 7.45–8.00 | 7.48–8.00 | 7.78–8.00 | |
| Normalized determinant | 3.15 | 3.25 | 3.38 | |
| Efficiency | 0.95 | 0.95 | 0.95 | |
Estimation of sample size
Figure 8 presents the plots of power against sample size for clearance (CL) and volume of the central compartment (V1) for the different age groups based on the final population pharmacokinetic model and parameter estimates, the selected paediatric dose (10 mg kg−1 body weight) and the single sampling windows design. The final criterion for sample sizes for the different age groups was based on 80% power and a 20% precision limit on clearance. Based on this criterion, a sample size of 10 was selected for each of the different paediatric age groups (30 children in total). This sample size will allow the absorption rate constant (ka), clearance (CL), volume of distribution of the central compartment (V1), volume of distribution of the peripheral compartment (V2) and intercompartmental clearance (Q) to be estimated with percentage standard error expressed as coefficient of variation (%CVSE) of approximately 47, 9, 36, 21 and 55, respectively. Final sample size of 10 in each paediatric age group has been selected based on the assumptions that data from each age group will be analysed separately before joint analysis and that emphasis is on estimation of clearance only. If estimation of other parameters is of interest in the power calculation, the power plots for the volume of distribution of the central compartment (V1) could be used to determine appropriate sample size (V1 is one of the least well-estimated parameters). An ideal criterion for V1 will be 80% power and 20% precision limit. Based on this, a sample size of 30 per paediatric age group will be sufficient and this will allow the parameters (ka, CL, V1, V2 and Q) to be estimated with 26%, 5%, 25%, 10% and 26%CVSE, respectively.
Figure 8.
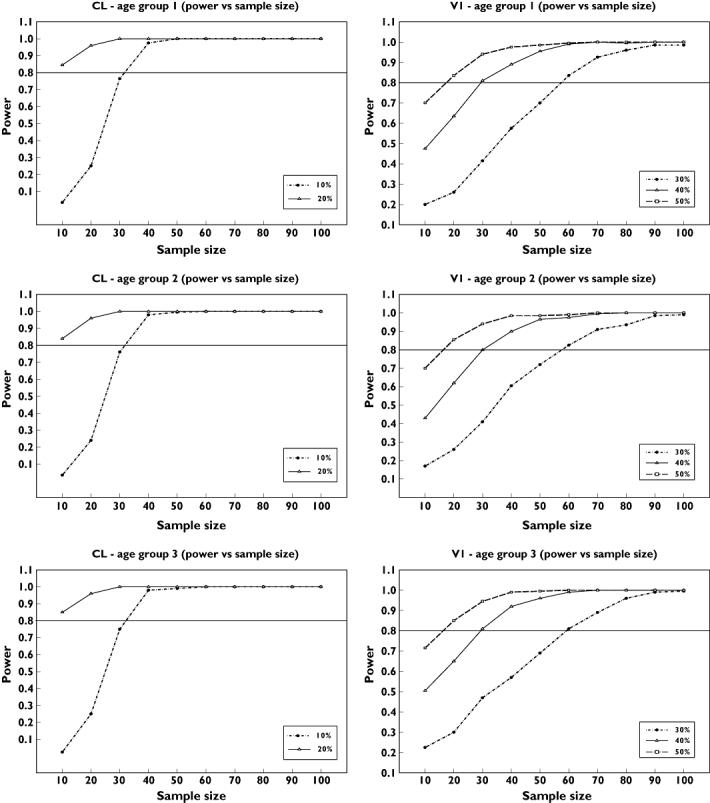
Plots of power vs. sample size for clearance (CL) and volume of distribution of the central compartment (V1) based on the final population pharmacokinetic model and parameter estimates, the selected paediatric dose (10 mg kg−1 body weight) and the single sampling windows design
Discussion
This analysis has presented a population pharmacokinetic model that adequately describes the pharmacokinetics of famciclovir/penciclovir in adults and children. Data from six different studies have been pooled together for the present analysis; given that these studies were conducted in well-controlled settings, participants and conditions are expected to be similar. This represents the first analysis based on a mixed-effect population pharmacokinetic model for famciclovir/penciclovir in adults and children. Various diagnostic plots obtained from the final population pharmacokinetic model did not reveal any visible trend and confirmed the adequacy of the model and the inclusion of the covariates. Plots in Figure 1 show a great improvement from the basic model to the final model. The figures also show that most of the data are around the line of identity, especially for the final model, meaning that the model-predicted data are similar to the observed data. Plots in Figure 3 show that there is no visible bias and that the model adequately describes the data at all time points. Plots of the visual predictive check based on the 90% prediction interval using the final model showed adequate coverage, confirming the ability of the model to predict plasma concentrations similar to the original data. The results of the bootstrap analysis confirmed the robustness of the final parameter estimates and the standard errors from the covariance step. The population parameter estimates obtained from the final model and mean of the bootstrap replicates are very similar, and the standard errors expressed as percentage coefficient of variation from the final model and the standard deviation expressed as the percentage coefficient of variation from the bootstrap analysis were also comparable. It is common in NONMEM that when the estimates are reported without the standard errors [34], bootstrap methods allow the estimation of standard errors in such cases.
Weight alone was unable to account for all the differences between individuals within this heterogeneous population. Models describing changes related to age and creatinine clearance as well as those for weight were necessary to help describe the between-subject variation. Reductions in between-subject variability with the addition of covariates (especially for clearance) were observed. When weight alone was introduced as a covariate on clearance, the between-subject variability was reduced by about 32%. When age was combined with weight it was reduced by about 42% and when creatinine clearance, weight and age were combined in the final clearance model it was reduced by about 46% (an additional 4%). The covariates of age, weight and creatinine clearance show a high correlation, especially in children. The correlation between weight and creatinine clearance is mostly due to age. As age increases from 0 to 35 or 40 years, weight and creatinine clearance increase. After this time, there is a reduction in creatinine clearance, and it was for this reason that two different age function parameters were introduced in the model: one for the upward trend in younger subjects and the other one for the downward trend in older subjects. In a group of healthy individuals, age and weight may be enough to predict clearance; however, in this analysis creatinine clearance is needed to help take into account different levels of renal function across patients and healthy volunteers in the different studies.
The VPC plots in Figure 5 show adequate coverage by the prediction intervals and that the model is capable of simulating data with a similar distribution and profile to the observed data. Also Figure 6 shows adequate coverage by the prediction intervals (approximately 5% of points are outside the interval for both plots). The mean predicted penciclovir clearance and total volume of distribution values for adults were 36 l h−1 and 85 l, respectively, from this population pharmacokinetic analysis. The adults' mean clearance and mean total volume of distribution values for penciclovir compare favourably with those obtained from previous noncompartmental analysis, i.e. 36.6 ± 6.3 l h−1 and 1.08 ± 0.17 l kg−1 for clearance and volume, respectively [11, 12].
Determining the right dose in children based on the adult dose can be difficult because, as is often said, ‘children are not little adults’. However, unless the children are very young (neonates) it is often practical to adjust adult dose for children using size [35]. This assumption is especially important due to the ethical constraints in dose finding in healthy children. The dosage adjustment simulations clearly confirmed the need for some form of dosage adjustment in children. The use of the body weight-based approach is widely accepted by clinicians due to its simplicity. The final choice of the 10 mg kg−1 regimen was selected empirically, based on the simulated AUC ratios and Cmax ratios of children with reference to a 500-mg adult dose. This dose gave the best combination of Cmax and AUC assuming that any toxicity is linked to both the Cmax and overall exposure in AUC. It is still essential to test these recommended doses in a prospective pharmacokinetic study in children because of the paucity of data in children <6 years old in the dataset used to develop the population pharmacokinetic model. Data from such a study could be subsequently used to validate, refine and, if necessary, adjust the current model-based recommendations.
Using prior information in the form of a population pharmacokinetic model, parameter estimates and dose, optimization of sampling times was undertaken for the different paediatric age groups subject to design constraints. The results showed that the five optimal sampling times were not very different between the age groups with time points in the absorption phase, around the peak, at the beginning of the distribution phase, at the end of the distribution phase and at the final elimination phase.
Sampling window designs have been proposed as a way of controlling sampling times in population pharmacokinetic experiments when collection of samples at specific times may not be feasible. They provide an opportunity to control sampling times and yet allow some flexibility and still result in informative data. This recently developed approach [32] was applied to the famciclovir/penciclovir paediatric studies. This approach is based on calculating time intervals around D-optimal time points and reflects parameter sensitivities by producing narrow windows where it is very important to sample close to D-optimal time points and wide windows where it is less important to sample close to D-optimal time points. The sampling windows for the different age groups were calculated based on 95% mean efficiency and uniform distribution of samples within the windows. The results obtained for the different paediatric age groups showed that the windows are very similar. They also showed that the first sampling window is very narrow due to the high sensitivity of the profile during the absorption phase. There is also an overlap between the second and third windows. Therefore, a new sampling windows design was obtained from a combination of the optimal sampling windows for the three paediatric age groups to be implemented in all age groups. This new single sampling design is at least 85% efficient in each of the paediatric age groups.
It is very important to include an adequate number of subjects in any population pharmacokinetic study. However, most sample size calculation methods are based on hypothesis testing, and in most population pharmacokinetic experiments there is no clear hypothesis to be tested. An approach that was proposed for population pharmacokinetics is based on simulation using CIs. It involves calculating the power of a population pharmacokinetic design using different sample sizes to estimate the CI on a parameter of choice within specified precision limits. This approach was applied to these paediatric studies using clearance (CL) as the parameter of choice. The results obtained showed that using 10 subjects in each of the age groups will estimate CL with at least 80% power to within a 20% precision limit. Only the age bands 1–2, 2–5 and 5–12 years were considered for power calculations and no other band was investigated. Therefore a sample size of 10 was recommended for each of the paediatric age groups (30 in total). As shown in the results, this sample size allows CL to be well estimated. However, the sample size would have to be increased if estimation of other parameters is considered.
In conclusion, this analysis has developed a model that adequately describes the pharmacokinetics of famciclovir/penciclovir in adults and children. This model provides the basis for the application of optimal design theory to suggest the design of a prospective pharmacokinetic study. This study is designed optimally with respect to suggested dose individualization, sample size and timing of pharmacokinetic samples.
Competing interests
The research was sponsored by the Centre for Applied Pharmacokinetic Research (CAPKR is supported by the following consortium members; Eli Lilly, GlaxoSmithKline, Novartis, Pfizer and Servier). I.M. received financial support from Biosim (Biosim is a network of excellence established under the 6th European Commission framework programme). M.L. and G.K. are employees of Novartis and are shareholders in the company.
REFERENCES
- 1.European Commission. Better Medicine for Children, Proposed Regulatory Actions on Paediatric Medicinal Products. Brussels: European Commission Brussels; 2002. Available at http://ec.europa.eu/enterprise/pharmaceuticals/pharmacos/docs/doc2002/feb/cd_pediatrics_en.pdf (last accessed 12 March 2008. [Google Scholar]
- 2.European Medicines Agency. Clinical Investigation of Medicinal Products in the Paediatric Population. Available at http://www.emea.europa.eu/pdfs/human/ich/271199en.pdf (last accessed 12 March 2008.
- 3.Anderson BJ, McKee AD, Holford NH. Size, myths and the clinical pharmacokinetics of analgesia in paediatric patients. Clin Pharmacokinet. 1997;33:313–27. doi: 10.2165/00003088-199733050-00001. [DOI] [PubMed] [Google Scholar]
- 4.Ginsberg G, Hattis D, Sonawane B, Russ A, Banati P, Kozlak M, Smolenski S, Goble R. Evaluation of child/adult pharmacokinetic differences from a database derived from the therapeutic drug literature. Toxicol Sci. 2002;66:185–200. doi: 10.1093/toxsci/66.2.185. [DOI] [PubMed] [Google Scholar]
- 5.Reed MD. Optimal sampling theory: an overview of its application to pharmacokinetic studies in infants and children. Pediatrics. 1999;104:627–32. [PubMed] [Google Scholar]
- 6.Ritschel WA, Kearns GL. Handbook of Basic Pharmacokinetics. Washington, DC: American Pharmaceutical Association; 1998. [Google Scholar]
- 7.FDA. Guidance for Industry, General Consideration for Paediatric Pharmacokinetic Studies for Drugs and Biological Products. Available at http://www.fda.gov/cder/guidance/index.htm (last accessed 14 September 2006.
- 8.Novartis AG. Famvir® (famciclovir) Available at http://www.fda.gov/cder/foi/label/2006/020363s027s028lbl.pdf (last accessed 28 February 2008.
- 9.Gill KS, Wood MJ. The clinical pharmacokinetics of famciclovir. Clin Pharmacokinet. 1996;31:1–8. doi: 10.2165/00003088-199631010-00001. [DOI] [PubMed] [Google Scholar]
- 10.Filer CW, Allen GD, Brown TA, Fowles SE, Hollis FJ, Mort EE, Prince WT, Ramji JV. Metabolic and pharmacokinetic studies following oral administration of 14C-famciclovir to healthy subjects. Xenobiotica. 1994;24:357–68. doi: 10.3109/00498259409045899. [DOI] [PubMed] [Google Scholar]
- 11.Boike SC, Pue M, Audet PR, Freed MI, Fairless A, Ilson BE, Zariffa N, Jorkasky DK. Pharmacokinetics of famciclovir in subjects with chronic hepatic-disease. J Clin Pharmacol. 1994;34:1199–207. doi: 10.1002/j.1552-4604.1994.tb04732.x. [DOI] [PubMed] [Google Scholar]
- 12.Boike SC, Pue MA, Freed MI, Audet PR, Fairless A, Ilson BE, Zariffa N, Jorkasky DK. Pharmacokinetics of famciclovir in subjects with varying degrees of renal impairment. Clin Pharmacol Ther. 1994;55:418–26. doi: 10.1038/clpt.1994.51. [DOI] [PubMed] [Google Scholar]
- 13.Pue MA, Pratt SK, Fairless AJ, Fowles S, Laroche J, Georgiou P, Prince W. Linear pharmacokinetics of penciclovir following administration of single oral doses of Famciclovir 125, 250, 500 and 750 mg to healthy-volunteers. J Antimicrob Chemother. 1994;33:119–27. doi: 10.1093/jac/33.1.119. [DOI] [PubMed] [Google Scholar]
- 14.Rolan P. Pharmacokinetics of new antiherpetic agents. Clin Pharmacokinet. 1995;29:333–40. doi: 10.2165/00003088-199529050-00003. [DOI] [PubMed] [Google Scholar]
- 15.Cockcroft DW, Gault MH. Prediction of creatinine clearance from serum creatinine. Nephron. 1976;16:31–41. doi: 10.1159/000180580. [DOI] [PubMed] [Google Scholar]
- 16.Beal SL, Sheiner LB. NONMEM Users Guides, Parts I–VII. San Francisco, CA: University of California; 1992. NONMEM Project Group. [Google Scholar]
- 17.Anderson BJ, Allegaert K, Holford NHG. Population clinical pharmacology of children: modelling covariate effects. Eur J Pediatr. 2006;165:819–29. doi: 10.1007/s00431-006-0189-x. [DOI] [PubMed] [Google Scholar]
- 18.Holford NH. A size standard for pharmacokinetics. Clin Pharmacokinet. 1996;30:329–32. doi: 10.2165/00003088-199630050-00001. [DOI] [PubMed] [Google Scholar]
- 19.West GB, Brown JH, Enquist BJ. A general model for the origin of allometric scaling laws in biology. Science. 1997;276:122–6. doi: 10.1126/science.276.5309.122. [DOI] [PubMed] [Google Scholar]
- 20.West GB, Brown JH, Enquist BJ. The fourth dimension of life: fractal geometry and allometric scaling of organisms. Science. 1999;284:1677–9. doi: 10.1126/science.284.5420.1677. [DOI] [PubMed] [Google Scholar]
- 21.Parke J, Holford NH, Charles BG. A procedure for generating bootstrap samples for the validation of nonlinear mixed-effects population models. Comput Methods Programs Biomed. 1999;59:19–29. doi: 10.1016/s0169-2607(98)00098-4. [DOI] [PubMed] [Google Scholar]
- 22.Holford N. Wings for NONMEM. 611. Available at http://wfn.sourceforge.net (last accessed 12 March 2008.
- 23.Cole TJ, Freeman JV, Preece MA. British 1990 growth reference centiles for weight, height, body mass index and head circumference fitted by maximum penalized likelihood. Stat Med. 1998;17:407–29. [PubMed] [Google Scholar]
- 24.Savory DJ. Reference ranges for serum creatinine in infants, children and adolescents. Ann Clin Biochem. 1990;27:99–101. doi: 10.1177/000456329002700201. [DOI] [PubMed] [Google Scholar]
- 25.Schwartz GJ, Haycock GB, Spitzer A. Plasma creatinine and urea concentration in children: normal values for age and sex. J Pediatr. 1976;88:828–30. doi: 10.1016/s0022-3476(76)81125-0. [DOI] [PubMed] [Google Scholar]
- 26.Atkinson AC, Donev AN. Optimum Experimental Designs. Oxford: Oxford University Press; 1992. [Google Scholar]
- 27.Gagnon R, Leonov S. Optimal population designs for PK models with serial sampling. J Biopharm Stat. 2005;15:143–63. doi: 10.1081/bip-200040853. [DOI] [PubMed] [Google Scholar]
- 28.Gueorguieva I, Ogungbenro K, Graham G, Glatt S, Aarons L. A program for individual and population optimal design for univariate and multivariate response pharmacokinetic– pharmacodynamic models. Comput Methods Programs Biomed. 2007;86:51–61. doi: 10.1016/j.cmpb.2007.01.004. [DOI] [PubMed] [Google Scholar]
- 29.Retout S, Mentré F. Further developments of the Fisher information matrix in nonlinear mixed effects models with evaluation in population pharmacokinetics. J Biopharm Stat. 2003;13:209–27. doi: 10.1081/BIP-120019267. [DOI] [PubMed] [Google Scholar]
- 30.Stein M. Large sample properties of simulations using latin hypercube sampling. Technometrics. 1987;29:143–51. [Google Scholar]
- 31.Ogungbenro K, Graham G, Gueorguieva I, Aarons L. The use of a modified Fedorov exchange algorithm to optimise sampling times for population pharmacokinetic experiments. Comput Methods Programs Biomed. 2005;80:115–25. doi: 10.1016/j.cmpb.2005.07.001. [DOI] [PubMed] [Google Scholar]
- 32.Ogungbenro K, Aarons L. An effective approach for obtaining optimal sampling windows for population pharmacokinetic experiments. J Biopharm Stat. 2008;19:174–89. doi: 10.1080/10543400802536131. [DOI] [PubMed] [Google Scholar]
- 33.Ogungbenro K, Aarons L. How many subjects are necessary for population pharmacokinetic experiments? Confidence interval approach. Eur J Clin Pharmacol. 2008;64:705–13. doi: 10.1007/s00228-008-0493-7. [DOI] [PubMed] [Google Scholar]
- 34.Ette EI, Onyiah LC. Estimating inestimable standard errors in population pharmacokinetic studies: the bootstrap with winsorization. Eur J Drug Metab Pharmacokinet. 2002;27:213–24. doi: 10.1007/BF03190460. [DOI] [PubMed] [Google Scholar]
- 35.Anderson BJ, Holford NH. Mechanism-based concepts of size and maturity in pharmacokinetics. Annu Rev Pharmacol Toxicol. 2008;48:303–32. doi: 10.1146/annurev.pharmtox.48.113006.094708. [DOI] [PubMed] [Google Scholar]


