Abstract
Successful ab initio folding of proteins with both α-helix and β-sheet requires a delicate balance among a variety of forces in the simulation model, which may explain that the successful folding of any α∕β proteins to within experimental error has yet to be reported. Here we demonstrate that it is an achievable goal to fold α∕β proteins with a force field emphasizing the balance between the two major secondary structures. Using our newly developed force field, we conducted extensive ab initio folding simulations on an α∕β protein full sequence design (FSD) employing both conventional molecular dynamics and replica exchange molecular dynamics in combination with a generalized-Born solvation model. In these simulations, the folding of FSD to the native state with high population (>64.2%) and high fidelity (Cα-Root Mean Square Deviation of 1.29 Å for the most sampled conformation when compared to the experimental structure) was achieved. The folding of FSD was found to follow two pathways. In the major pathway, the folding started from the formation of the helix. In the minor pathway, however, folding of the β-hairpin started first. Further examination revealed that the helix initiated from the C-terminus and propagated toward the N-terminus. The formation of the hydrophobic contacts coincided with the global folding. Therefore the hydrophobic force does not appear to be the driving force of the folding of this protein.
INTRODUCTION
Two of the most important secondary structure elements in proteins are α-helices and β-sheets. The native globular structures of proteins are the outcome of the proper packing of these two types of secondary structure elements interconnected by loops and turns. En route to the formation of secondary structures and subsequent global packing, protein folding process is accompanied by a delicate balance among many competing forces, including van der Waals, hydrogen bonding, hydrophobic force, and entropy. In the development of force fields, all these factors should be considered in order to achieve a balance between the two major secondary structures and successful global folding. For many years, this has posed significant challenge to the force field development community. It has been shown that minor imbalance in a force field can lead to serious bias toward either α-helix or β-sheet conformations.1, 2
Ab initio folding simulation is one of the most stringent ways to assess the quality of force fields. This is because of the unbiased sampling that can guide the proteins toward the energetically most favorable states dictated by the underlying force field. In recent years, successful ab initio folding has been reported on a few β peptides3, 4, 5 and several helical proteins, including trp-Cage,6, 7, 8 villin headpiece subdomain,9, 10, 11, 12 albumin binding domain,13 and the B domain of protein A.14, 15 Some of these reports even approached the accuracy within experimental error.9, 10, 14 However, reports on successful folding of mixed α∕β proteins have been absent. In a few attempts to fold proteins with different topologies (α, β, and α∕β), the structures closest to the experimental ones were still 3 and 4 Å away which were outside of the native basins of the respective proteins.16, 17 Due to the inadequate accuracy of folding, inconsistent or even contradictory conclusions have been drawn on the folding mechanism of the same proteins. Therefore, reliable information regarding the protein folding mechanism could not be obtained from those simulations, which ironically is the main objective of protein folding simulations.
Full sequence design (FSD) is a designed small α∕β protein.18, 19 Due to the small size (only 28 residues) and nontrivial topology, it has been a benchmark target for protein folding simulations. In previous works, we conducted extensive simulations with both explicit and implicit solvent models to investigate the folding mechanism of FSD.20, 21 The ab initio folding of FSD has also been attempted by Pak and co-workers22and Lee and co-workers.23 Recently, Hansmann and co-worker24 and Wang and co-workers25 applied replica exchange molecular dynamics (REMD) to the folding study of FSD. The protein in those simulations mostly drifted away from the experimental structure and the most populated conformation was centered at 2.5–4.0 Å, indicating significant artifact in the force fields used in those simulations that made the interpretation of the observed folding events somewhat challenging.
In light of the observed problems in the existing force fields, we decided to develop a new force field emphasizing the balance between the two major conformations in proteins, namely, α-helix and β-sheet. The new force field was developed following the approach applied in the AMBER force field development. In the charge fitting process, we included three major conformations of dipeptides, namely, α-helix, β-sheet, and PPII. Then, the main chain torsions were tuned to reflect the Φ∕Ψ distribution of each amino acid in the protein data bank (PDB). However, it should be noted that the force field was not tuned against any particular protein. For a more detailed description of the force field development, please see Sec. 2.
Here we report a set of ab initio folding simulations of FSD both for a detailed investigation of the folding mechanism and for an initial evaluation of the force field. All of the simulations started from the fully extended chain. In order to speed up the simulation, a generalized-Born (GB) model was chosen to model the solvation effect. A set of REMD simulations (240 ns with 20 replicas) was conducted to investigate the folding free energy landscape and other thermodynamic properties. To further examine the folding pathways, another set of simulations by conventional molecular dynamics (CMD) was performed (1.2 μs for each of the ten simulation trajectories). The successful approach to the experimental native basin and the fact that the native basin was the most populated state in the simulations demonstrated that molecular mechanics force field can indeed reach a delicate balance.
METHODS
The simulations were conducted with the AMBER simulation package.26 A newly developed all-atom point-charge force field was chosen to represent the protein. The combined GB (Ref. 27) and surface area model (surface tension=0.005 kcal mol Å2) was chosen to mimic solvation effect. Starting from the extended polypeptide chain of the FSD double mutant FSD-EY (Ref. 18) (for simplicity, we used the acronym FSD instead of FSDEY throughout the paper), short minimization (1000 steps) and equilibration (20 ps) with different random seeds at 300 K were applied to the system. These randomly collapsed structures served as the starting points for the simulation trajectories. There were 20 replicas in the REMD simulations28 and the target temperatures were as follows: 250.0, 260.6, 271.6, 283.1, 295.1, 307.6, 320.7, 334.3, 348.4, 363.2, 378.6, 394.6, 411.3, 428.8, 446.9, 465.9, 485.6, 506.2, 527.6, and 550.0 K. Temperature exchanges were attempted every 2000 steps. Temperature was set to 300 K in the CMD simulations. In most simulations, temperature was controlled by applying Berendsen’s thermostat29 with a coupling time constant of 2.0 ps. Ionic strength was set to 0.2 M. The cutoff for both general nonbonded interaction and GB pairwise summation was set to 12 Å. Time step was set to 1.5 fs in CMD and 1 fs in REMD. SHAKE was applied for hydrogen-connected bond constraint.30 Slow-varying terms were evaluated every four steps. The coordinates were saved every 15 ps in CMD and 30 ps in REMD. The simulations were run on an AMD dual-core Opteron cluster (four cores on each node) and it took ∼80 days to complete each 1.2 μs CMD simulation and ∼60 days to complete the 240 ns REMD simulation.
While the new force field is still under extensive test and further refinement, here we outline the key features. Interested readers are welcome to contact us for the parameters and the modified AMBER code for verification and other tests. The philosophy31, 32 of the AMBER force field parametrization was followed. Using the restricted electrostatic potential method,33 three representative conformations, namely, α-helix (Φ=−57.0° and Ψ=−47.0°), β-sheet (Φ=−139.0° and Ψ=113.0°), and PPII (Φ=−79.0° and Ψ=150.0°), for each amino acid were used to obtain the partial charges which were fitted to the quantum mechanical (QM) electrostatic potentials. Using polarizable continuum model (PCM) (solvent=ether),34, 35, 36 the electrostatic potentials were computed at the B3LYP∕cc-pVTZ∕∕B3LYP∕6-31G** level.37 This approach has been employed in the AMBER ff03 parametrization38 and can adequately account for the polarization effects that arose from the protein environment. The reasons for using the ether medium in the PCM calculations have been discussed in AMBER ff03.38 In charge fitting, the QM electrostatic potentials of the above-mentioned 60 conformations (3×20) were combined, to which the partial charges of the twenty amino acids were fitted. The charges are fixed after the fitting process.
Except for the parameters of the main chain (Φ,Ψ) torsions and the partial charges of atoms, all other parameters were adopted from the existing AMBER force fields. For the main chain (Φ∕Ψ) torsion parameters, the two-dimensional potential energy maps were used following the CMAP39, 40 approach from the recent CHARMM force field.41 Instead of using three maps in the CHARMM force field, we divided the 20 amino acids into six groups. Group I includes ALA, LEU, TRP, PHE, TYR, LYS, ARG, HID, and GLU. The main feature of this group is that they have Cβ(H2) with no polar atoms connected to γ carbon atoms. Group II contains THR, SER, CYS, ASP, and ASN, in which one polar atom links to γ carbon atom. The β carbon atoms in group III (VAL and ILE) link to two sp3 carbon atoms. MET and GLN constitute group IV. Finally, due to their special characters, PRO and GLY are groups V and VI, respectively. The energy maps of ALA and GLY, calculated at the MP2 (PCM,solvent=ether)∕cc-pVTZ∕∕MP2(PCM)∕6-31G** level, are used for group I and GLY, respectively. Based on the ALA map, the maps for groups II–V(PRO) are adjusted according to the Φ∕Ψ maps of these amino acids from PDB.
The first model of the NMR structure ensemble of the FSD double mutant FSD-EY (PDB code 1FME) (Ref. 18) was used as the reference structure to monitor the folding process. The two N-terminal and three C-terminal residues were excluded in the Root Mean Square Deviation (RMSD) calculations due to the high uncertainty in the NMR structure determination. To examine the sampling of the conformational space, clustering was conducted on the REMD trajectories at each target temperature separately. The snapshots were clustered using a hierarchical clustering method. In brief, two snapshots are considered as neighbors when their pairwise Cα-RMSD is below 2.5 Å. After the all-against-all pairwise Cα-RMSD evaluation, the snapshot with the most neighbors was identified as the center of the No. 1 cluster. Then, all the neighbors of the center of the No. 1 cluster are classified into this cluster and removed from further identification of other clusters. This process was iterated to identify No. 2 and No. 3 and other clusters from the remaining snapshots. Heat capacity was calculated using C=(⟨E2⟩−⟨E⟩2)∕RT2, where E is the potential energy, R is the gas constant, and T is the temperature. The calculation of heat capacity at certain temperature T was based on all the snapshots at the respective temperature from the REMD simulation. Helicity was evaluated using a simple main chain dihedral cutoff: Φ=−57±40° and Ψ=−47±40°. Strictly speaking, this is only an evaluation of the conformational state of each residue because consecutive main chain hydrogen bonding is required in the formation of helix, which is not considered in our simple evaluation of “helicity.”
RESULTS
In our current investigation, FSD consistently folded to within 0.80 Å Cα-RMSD with respect to the experimental structure in both the REMD and CMD simulations and the most populated conformation had a Cα-RMSD of 1.29 Å from the experimental structure. In this section, we will first demonstrate the folding of FSD from the REMD simulations, which is followed by the investigation of the temperature-dependent folding properties. Then, a detailed description of the folding pathways from the CMD simulations is presented.
Thermodynamics from the REMD simulation
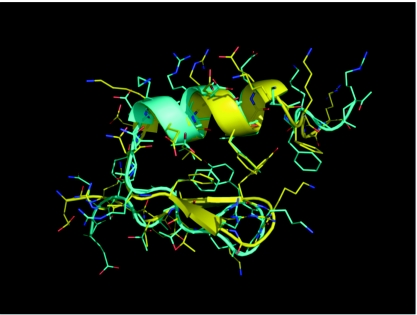
In the REMD simulation, the protein successfully folded to the native conformation with high quality, as judged by the small Cα-RMSD. Among the 20 replicas in the REMD simulation, FSD sampled conformations below 1.0 Å (Cα-RMSD) in the 12 replicas with temperature below 373 K. The best folded structure obtained from the REMD simulation had a Cα-RMSD of only 0.71 Å to the experimental structure (residues 3–25, excluding the five terminal residues, namely, 1, 2, 26, 27, and 28, which exhibited high uncertainty in the NMR structure). This best folded structure is shown in Fig. 1 (superimposed to the NMR structure). Except for the flexible termini, the backbone of the entire protein folded very well, especially in the helical segment. In addition, most of the residues in the α∕β packing interface (i.e., the hydrophobic core) adopted nativelike orientations. Consistent with the uncertain side chain orientations on the surface of the NMR structure ensemble, the side chain conformations of the surface residues displayed deviation from the experimental model used for RMSD evaluation.
Figure 1.
The best folded structure (cyan) from the ab initio folding simulation of FSD superimposed with the NMR structure (yellow, PDB code 1FME, the first model).
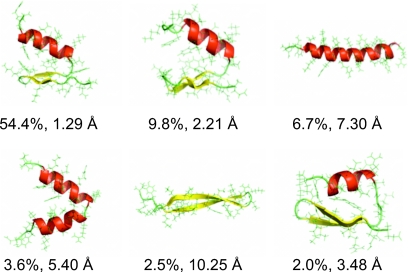
The conformations of FSD sampled at 300 K were analyzed by hierarchical clustering and the six most populated conformations are shown in Fig. 2. The most populated conformation was the closest to the experimental structure with a Cα-RMSD of 1.29 Å and a population of 54.4%. The second most populated conformation was also well folded with a Cα-RMSD of 2.21 Å and population of 9.8%. Therefore the folded conformations were dominant (>64.2%) at 300 K. Among other sampled conformations, we observed a nativelike conformation with Cα-RMSD of 3.48 Å and population of 2.0%, an α-hairpin conformation with Cα-RMSD of 5.40 Å and population of 3.6%, a long helix with Cα-RMSD of 7.30 Å and population of 6.7%, and a long β-hairpin with Cα-RMSD of 10.25 Å and population of 2.5%. This demonstrated the good sampling of the conformational space within the 240 ns REMD simulation time.
Figure 2.
Representative structures of the six highly sampled conformations (top six clusters) at 300 K from the ab initio folding of FSD by the REMD simulation. The population of each cluster and the Cα-RMSD of the cluster centers with respect to the NMR structure are indicated.
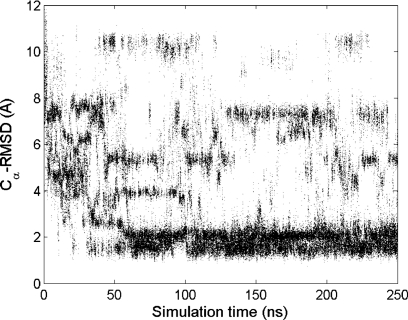
The reversible feature of the conformational sampling in the REMD simulation is shown in Fig. 3. Overall the folding was fast at 300 K. A transient folding occurred near 10 ns, and the sampling of the folded state became dominant after 50 ns. After reaching the stable folded conformation, the distribution of RMSD changed from continuous to discrete, indicating the limited set of accessible conformations. The bimodal feature of the native state is also consistent with the observation shown in Fig. 2 (1.29 and 2.21 Å for the top two clusters).
Figure 3.
The evolution of Cα-RMSD during the ab initio folding of FSD at 300 K from the REMD simulation.
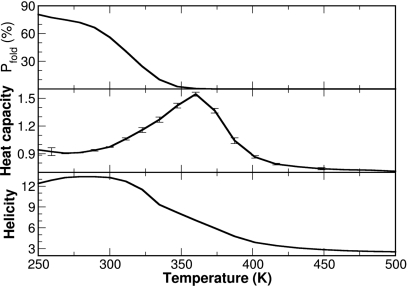
As temperature changes, the equilibrium among various conformations shifts accordingly. This property was well preserved in the REMD simulation, as shown in Fig. 4. We observed a monotonic decrease in the population of the folded conformation (defined as Cα-RMSD of <3.0 Å) from ∼80% at 250 K to ∼0% at 373 K. As for the helicity, the declining spanned the whole temperature range from ∼50% (13 out of 28 residues) at 250 K to a residual ∼10% helicity (three out of 28 residues) at 500 K. Interestingly, the peak of the heat capacity profile was near 360 K. This seems to correspond to the melting of the helix rather than the unfolding of the whole protein, since the population of the folded conformation was close to ∼0% at 360 K and was close to ∼50% at 315 K. Therefore, care should be taken when interpreting the heat capacity profile calculated from simulation.
Figure 4.
Temperature-dependent folding properties of FSD from the REMD simulation. Upper panel: The monotonic decrease in the population of the folded conformation as temperature increases. Middle panel: The heat capacity profile. Lower panel: The decrease in helical content (the number of residues in helical conformation) as temperature increases.
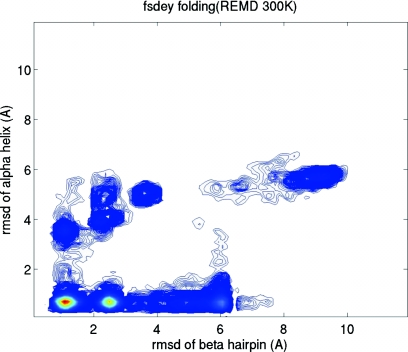
In order to understand the folding process, we constructed a folding landscape based on the replica at 300 K from the REMD simulation. We chose the folding of the two secondary structure segments (β-hairpin and α-helix) as the reaction coordinates. The folding landscape based on the folding of the two secondary structure segments is shown in Fig. 5. Two folding pathways can be implied from the folding landscape. The majority of the folding was through the primary folding pathway in which the helix folded to within 1.0 Å first that was followed by the folding of the β-hairpin and global folding. In the secondary pathway with a significantly lower population, formation of the β-hairpin preceded that of the helix.
Figure 5.
The folding landscape of FSD at 300 K from the REMD simulation. The Cα-RMSDs of the two structural segments (β-hairpin and α-helix) are chosen as the reaction coordinates.
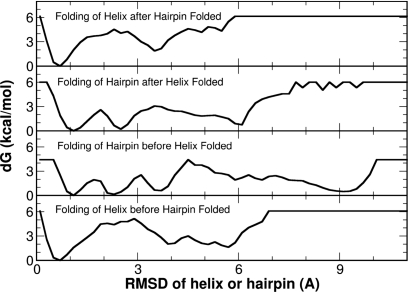
To further investigate the energetics in the formation of secondary structures, we constructed several free energy profiles shown in Fig. 6. These include the initial folding of either the helix or the hairpin (two lower panels) and the subsequent folding of the other secondary structure (two upper panels). A simple cutoff of Cα-RMSD of <2.0 Å was used to evaluate the folding of both secondary structure segments. It is rather clear that the folded state is notably favorable than other states for the helix segment, irrespective of the conformational state of the hairpin segment. In contrast, there exist several local free energy minima for the hairpin segment, which may imply a rate limiting step for the global folding of FSD.
Figure 6.
The free energy profiles of the segmental folding derived from the folding landscape shown in Fig. 5. These include the free energy profiles for the folding of the first structure element (either helix or hairpin, the two lower panels) and the folding of the second structure element (the two upper panels).
Folding pathways observed in the CMD simulations
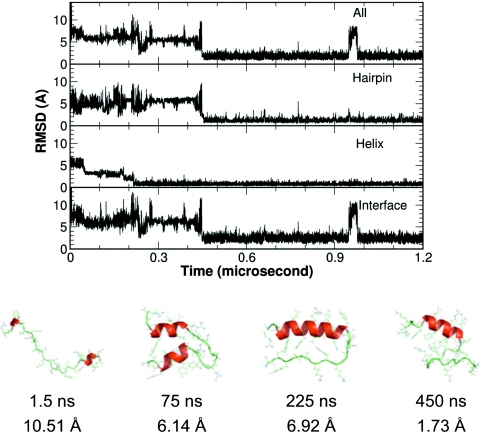
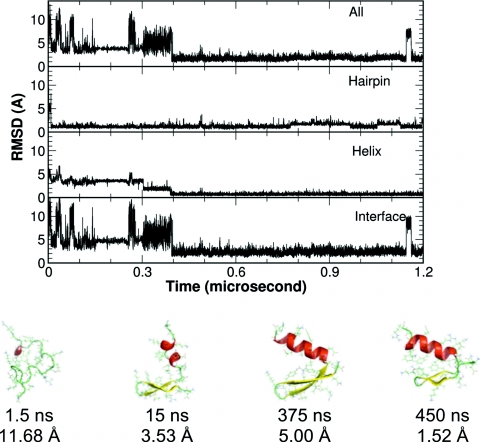
REMD simulations can provide more reliable information on the equilibrium. However, direct observation of the folding pathway can only come from ab initio folding by CMD simulations. From the ten CMD simulations, we observed six folding events (defined as Cα-RMSD of <2.5 Å). Consistent with the high quality folding in the REMD simulation, four of the six CMD folding trajectories sampled conformations with Cα-RMSD of <0.80 Å. Two of these folding trajectories are shown in Figs. 78. Interestingly, FSD took two different folding pathways in these two folding trajectories.
Figure 7.
A representative folding trajectory from the CMD simulations where the helix folded first. Upper panel: The Cα-RMSD of the whole protein, the structural segments, and the helix-hairpin interface. Lower panel: representative structures from different stages of the folding.
Figure 8.
A representative folding trajectory from the CMD simulations where the hairpin folded first. Upper panel: The Cα-RMSD of the whole protein, the structural segments, and the helix-hairpin interface. Lower panel: representative structures from different stages of the folding.
In the simulation trajectory shown in Fig. 7, the folding of the helix preceded that of the hairpin and the folding was roughly a three step process, as illustrated by the representative structures. At the beginning, the protein was rather extended. The C-terminal part of the helix started to form very early in this simulation, while misfolding was observed in the hairpin segment. The helix gradually matured while the hairpin segment sampled various conformations. Once the hairpin reached the native state, the whole protein reached a stable global folding immediately. It should be noted that the folding of the hydrophobic interface and the global folding were simultaneous, therefore the hydrophobic core interaction did not appear to be the driving force in this folding process.
In the simulation trajectory shown in Fig. 8, a very different folding process was observed. The protein quickly collapsed with the two turns roughly in the native conformations. This facilitated the fast formation of the hairpin segment, which greatly reduced the conformational space. The helix gradually grew to the full length. After the complete formation of the helix, it took about 70 ns to pack the interface before the global folding is accomplished. Evidently, the hydrophobic core interaction was not the driving force in this folding process either.
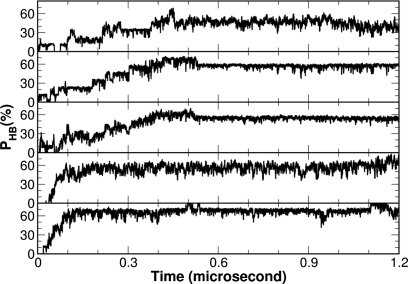
In order to investigate the helix initiation site, we studied the development of the five main chain hydrogen bonds within the helix using the combined average of the ten simulation trajectories. Shown in Fig. 9 is the development of the five hydrogen bonds from the N- to the C-terminus of the helix. It is rather clear that the C-terminal hydrogen bond was the fastest to develop. It reached ∼70% at about 100 ns and stayed around this level for the remaining simulation time. In contrast, the N-terminal hydrogen bond was the slowest to form. It only reached ∼40% at about 400 ns and stayed around this level. The development of the other three hydrogen bonds also followed this pattern and eventually reached ∼50%–60% at certain points. Based on this observation, we proposed that the helix initiation site for FSD is at the C-terminus of the helix.
Figure 9.
The formation of the individual native main chain hydrogen bonds within the helix illustrated from the N- to C-terminus of the helix (top to bottom). The percentages of the native hydrogen bonds at each time point are averaged over the ten trajectories from the CMD simulations.
DISCUSSION
Compared to previously reported simulation studies on the folding of FSD, the quality of the folding in this work is substantially higher. Therefore the reliability of the folding mechanism is likely higher as well. Highlights of the present study include the consistent folding to the native state within Cα-RMSD of ∼0.80 Å and the most populated cluster centered at ∼1.29 Å Cα-RMSD with a population of 54%. In the work by Pak and co-workers,42 although the nativelike conformation was sampled and the lowest Cα-RMSD reached 2.56 Å, the conformation with the lowest energy was an α-hairpin. Later, Pak and co-worker22 modified a version of AMBER force field with significant improvement by optimizing the native structure energy of small proteins including FSD. In a set of REMD simulations starting from the native structures, they examined the free energy profiles of small proteins including FSD. Strictly speaking, these simulations cannot be considered as folding simulations because they started from the native experimental structures. They found that the native basin was around 2.2 Å, which is still significantly higher than the 1.29 Å in the present work. Because their REMD simulation started from the native structures and the length of the simulation was only one-tenth of the present work, the simulations were insufficient to demonstrate folding, which is necessary for an accurate representation of the folding free energy landscape. In a folding study by Lee and co-workers,23 the center of the most populated conformation was around 3.7 Å, which is outside of the experimentally determined native basin for this 28 residue protein. In a recent work by Hansmann and co-worker,24 a modified ECEPP∕3 force filed gave ∼16% of the native conformation; however, the center of the “native basin” was still unsatisfactory (3.5 Å), also outside the experimentally determined native basin. In summary, these earlier studies clearly illustrated the challenges in ab initio folding simulations. A critical issue was the delicate balance of the main chain torsion angles. It is also noteworthy that although Pak and co-workers specifically tuned their parameters using FSD native structure as one of the template proteins, their results were notably inferior to ours, whereas our torsion parameters were not tuned on any specific proteins.
Previously, we conducted extensive simulations using AMBER ff03 force field with both explicit and implicit solvents to study the folding mechanism of FSD.20, 21 The consistent conclusion was the high stability of the helix and high plasticity of the hairpin and the hydrophobic core. The proposed unfolding process started with the deformation of the hairpin, followed by the separation of the hydrophobic core, and completed with the helix unwinding. The reversal of this unfolding process is consistent with the primary folding pathway observed in the current ab initio folding study. This folding mechanism is also consistent with a recent equilibrium REMD study of FSD using AMBER ff03 force field and explicit solvent.25 In the diffusion-collision model proposed by Karplus and co-workers,43, 44 protein folding starts with the formation of secondary structure elements, which diffuse and collide to form global contacts. In the current work, we observed two distinctive folding pathways, one started with the folding of helix and the other started with the folding of the hairpin. In either case, the formation of the secondary structure elements preceded the global folding, which is consistent with the diffusion-collision model.
Many of the conceivable conformations have been sampled in the REMD simulation (Fig. 2). Yet, the conformational preference was heavily biased to the native conformation and the sampling was not trapped in any of the misfolded conformations. In addition to the dominant native and nativelike α∕β conformations, the full α-helix, full β-hairpin, and α-hairpin were all sampled with significant population. This diverse but limited sampling of the conformational space is consistent with the backbone-based hypothesis by Rose et al.45 In contrast to the dominant view that side chain interactions dictate protein folding, Rose et al. proposed that main chain hydrogen bonding is responsible for the fast folding of native proteins. In order to reach the native states in a very short amount of time, proteins can only sample a limited set of conformations with different combinations of secondary structures whose formation is driven by main chain hydrogen bonding. In addition to the limited sampling, we also observed the late formation of the hydrophobic core. Both seem to support the backbone-based hypothesis by Rose et al. Furthermore, the fact that the α∕β linker region adopted mostly the nativelike loop∕turn conformations and the nonexistence of the reverse fold β∕α conformation indicated the importance of the secondary structure preference of the peptide segments in restricting the conformational sampling.
In the experimental studies by Mayo and co-worker,18, 19 FSD displayed modest stability with a melting temperature of 313 K and a rather smooth folding transition curve. Subsequent work resulted in a set of mutants including FSDEY with enhanced stability. Due to the low stability in the hairpin segment, the melting temperature derived from circular dichroism signal may not be a reliable measurement of the global folding. This is reflected in the temperature dependent properties shown in Fig. 4. According to the global folding (percentage of folded conformations), the melting temperature was around 315 K. However, the melting temperature was identified as 360 K when the melting of the helix was evaluated, which also corresponds to the maximum of the heat capacity. Therefore, care should be taken when interpreting data from either experiments or simulations.
In this work, we demonstrated a good balance of α and β conformations in our newly developed force field by ab initio folding of an α∕β protein FSD to the native state. However, successful folding of FSD does not guarantee the folding of other α∕β proteins, or proteins in general. More works need to be done to further validate this new force field. Unfortunately, extensive simulations like this work are very time consuming. We will conduct more tests and report the results down the road.
CONCLUSIONS
In order to achieve better balance between α-helix and β-sheet conformations, we developed a new all-atom force field by refitting the partial charges of atoms and retuning the main chain torsion parameters under the AMBER framework. Extensive ab initio folding simulation on a model α∕β protein FSD was conducted as an initial validation of the force field. Equilibrium simulation by REMD demonstrated that the most populated conformation was the native conformation and the native basin was centered around Cα-RMSD of 1.29 Å. The population of native conformation declined monotonically with the increase in temperature from 273 to 373 K, consistent with experimental observation. Simulations by CMD revealed two distinctive folding pathways. The primary folding pathway initiated with the folding of the helix and the secondary folding pathway initiated with the folding of the hairpin. Further investigation demonstrated that the folding of the helix started from the C-terminus.
ACKNOWLEDGMENTS
We are grateful to the AMBER development community led by Dr. David Case whose effort has made this work possible. This work was supported by research grants from NIH (Grant Nos. GM67168 and GM79383 to Y.D.). Part of the study was performed in China and was supported by the Chinese Academy of Sciences and NSFC (Grant No. 20773160 to Z.-X.W. and Grant No. 30870474 to H.L.) and by SRF for ROCS, SEM (to H.L.). The usage of graphics packages including GRACE, VMD, PYMOL, and RASMOL is gratefully acknowledged. H.L. and Z.-X.W. contributed equally to the work.
References
- Hu H., Elstner M., and Hermans J., Proteins 50, 451 (2003). 10.1002/prot.10279 [DOI] [PubMed] [Google Scholar]
- Lwin T. Z. and Luo R., Protein Sci. 15, 2642 (2006). 10.1110/ps.062438006 [DOI] [PMC free article] [PubMed] [Google Scholar]
- Suenaga A., Narumi T., Futatsugi N., Yanai R., Ohno Y., Okimoto N., and Taiji M., Asian J. Chem. 2, 591 (2007). 10.1002/asia.200600385 [DOI] [PubMed] [Google Scholar]
- Xu W. X., Lai T. F., Yang Y., and Mu Y. G., J. Chem. Phys. 128, 175105 (2008). [DOI] [PubMed] [Google Scholar]
- Yoda T., Sugita Y., and Okamoto Y., Proteins: Struct., Funct., Bioinf. 66, 846 (2007). 10.1002/prot.21264 [DOI] [PubMed] [Google Scholar]
- Chowdhury S., Lee M. C., Xiong G., and Duan Y., J. Mol. Biol. 327, 711 (2003). 10.1016/S0022-2836(03)00177-3 [DOI] [PubMed] [Google Scholar]
- Pitera J. W. and Swope W., Proc. Natl. Acad. Sci. U.S.A. 100, 7587 (2003). 10.1073/pnas.1330954100 [DOI] [PMC free article] [PubMed] [Google Scholar]
- Snow C. D., Zagrovic B., and Pande V. S., J. Am. Chem. Soc. 124, 14548 (2002). 10.1021/ja028604l [DOI] [PubMed] [Google Scholar]
- Lei H. and Duan Y., J. Mol. Biol. 370, 196 (2007). 10.1016/j.jmb.2007.04.040 [DOI] [PMC free article] [PubMed] [Google Scholar]
- Lei H., Wu C., Liu H., and Duan Y., Proc. Natl. Acad. Sci. U.S.A. 104, 4925 (2007). 10.1073/pnas.0608432104 [DOI] [PMC free article] [PubMed] [Google Scholar]
- Ripoll D. R., Vila J. A., and Scheraga H. A., J. Mol. Biol. 339, 915 (2004). 10.1016/j.jmb.2004.04.002 [DOI] [PubMed] [Google Scholar]
- Shen M. Y. and Freed K. F., Proteins 49, 439 (2002). 10.1002/prot.10230 [DOI] [PubMed] [Google Scholar]
- Lei H. and Duan Y., J. Phys. Chem. B 111, 5458 (2007). 10.1021/jp0704867 [DOI] [PubMed] [Google Scholar]
- Lei H., Wu C., Wang Z. X., Zhou Y., and Duan Y., J. Chem. Phys. 128, 235105 (2008). 10.1063/1.2937135 [DOI] [PMC free article] [PubMed] [Google Scholar]
- Nelson E. D. and Grishin N. V., Proc. Natl. Acad. Sci. U.S.A. 105, 1489 (2008). 10.1073/pnas.0705707105 [DOI] [PMC free article] [PubMed] [Google Scholar]
- Kim S. Y., Lee J., and Lee J., Biophys. Chem. 115, 195 (2005). 10.1016/j.bpc.2004.12.040 [DOI] [PubMed] [Google Scholar]
- Rojas A. V., Liwo A., and Scheraga H. A., J. Phys. Chem. B 111, 293 (2007). 10.1021/jp065810x [DOI] [PMC free article] [PubMed] [Google Scholar]
- Sarisky C. A. and Mayo S. L., J. Mol. Biol. 307, 1411 (2001). 10.1006/jmbi.2000.4345 [DOI] [PubMed] [Google Scholar]
- Dahiyat B. I. and Mayo S. L., Science 278, 82 (1997). 10.1126/science.278.5335.82 [DOI] [PubMed] [Google Scholar]
- Lei H. X. and Duan Y., J. Chem. Phys. 121, 12104 (2004). 10.1063/1.1822916 [DOI] [PubMed] [Google Scholar]
- Lei H. X., Dastidar S. G., and Duan Y., J. Phys. Chem. B 110, 22001 (2006). 10.1021/jp063716a [DOI] [PMC free article] [PubMed] [Google Scholar]
- Jang S., Kim E., and Pak Y., Proteins: Struct., Funct., Bioinf. 62, 663 (2006). 10.1002/prot.20771 [DOI] [PubMed] [Google Scholar]
- Kim S. Y., Lee J., and Lee J., J. Chem. Phys. 120, 8271 (2004). 10.1063/1.1689643 [DOI] [PubMed] [Google Scholar]
- Mohanty S. and Hansmann U. H. E., J. Chem. Phys. 127, 035102 (2007). 10.1063/1.2753835 [DOI] [PubMed] [Google Scholar]
- Li W. F., Zhang J., and Wang W., Proteins: Struct., Funct., Bioinf. 67, 338 (2007). 10.1002/prot.21312 [DOI] [Google Scholar]
- Case D. A., Cheatham T. E., Darden T., Gohlke H., Luo R., Merz K. M., Onufriev A., Simmerling C., Wang B., and Woods R. J., J. Comput. Chem. 26, 1668 (2005). 10.1002/jcc.20290 [DOI] [PMC free article] [PubMed] [Google Scholar]
- Onufriev A., Bashford D., and Case D. A., Proteins 55, 383 (2004). 10.1002/prot.20033 [DOI] [PubMed] [Google Scholar]
- Hansmann U. H. E. and Okamoto Y., Phys. Rev. E 56, 2228 (1997). 10.1103/PhysRevE.56.2228 [DOI] [Google Scholar]
- Berendsen H. J. C., Postma J. P. M., van Gunsteren W. F., Dinola A., and Haak J. R., J. Chem. Phys. 81, 3684 (1984). 10.1063/1.448118 [DOI] [Google Scholar]
- Ryckaert J. P., Ciccotti G., and Berendsen H. J. C., J. Comput. Phys. 23, 327 (1977). 10.1016/0021-9991(77)90098-5 [DOI] [Google Scholar]
- Weiner S. J., Kollman P. A., Case D. A., Singh U. C., Ghio C., Alagona G., Profeta S., and Weiner P., J. Am. Chem. Soc. 106, 765 (1984). 10.1021/ja00315a051 [DOI] [Google Scholar]
- Cornell W. D., Cieplak P., Bayly C. I., Gould I. R., Merz K. M., Ferguson D. M., Spellmeyer D. C., Fox T., Caldwell J. W., and Kollman P. A., J. Am. Chem. Soc. 117, 5179 (1995). 10.1021/ja00124a002 [DOI] [Google Scholar]
- Bayly C. I., Cieplak P., Cornell W. D., and Kollman P. A., J. Phys. Chem. 97, 10269 (1993). 10.1021/j100142a004 [DOI] [Google Scholar]
- Miertus S., Scrocco E., and Tomasi J., J. Chem. Phys. 55, 117 (1981). 10.1016/0301-0104(81)85090-2 [DOI] [Google Scholar]
- Cammi R., Mennucci B., and Tomasi J., J. Phys. Chem. A 104, 5631 (2000). 10.1021/jp000156l [DOI] [Google Scholar]
- Cossi M., Scalmani G., Rega N., and Barone V., J. Chem. Phys. 117, 43 (2002). 10.1063/1.1480445 [DOI] [Google Scholar]
- Frisch M. J., Trucks G. W., Schlegel H. B.et al. , GAUSSIAN 03W, Revision B.04, Gaussian, Inc., Pittsburgh, PA, 2003.
- Duan Y., Wu C., Chowdhury S., Lee M. C., Xiong G. M., Zhang W., Yang R., Cieplak P., Luo R., Lee T., Caldwell J., Wang J. M., and Kollman P., J. Comput. Chem. 24, 1999 (2003). 10.1002/jcc.10349 [DOI] [PubMed] [Google Scholar]
- MacKerell A. D., Feig M., and C. L.BrooksIII, J. Am. Chem. Soc. 126, 698 (2004). 10.1021/ja036959e [DOI] [PubMed] [Google Scholar]
- Chen J. H., Im W. P., and C. L.BrooksIII, J. Am. Chem. Soc. 128, 3728 (2006). 10.1021/ja057216r [DOI] [PMC free article] [PubMed] [Google Scholar]
- MacKerell A. D., Bashford D., Bellott M., Dunbrack R. L., Evanseck J. D., Field M. J., Fischer S., Gao J., Guo H., Ha S., Joseph-McCarthy D., Kuchnir L., Kuczera K., Lau F. T. K., Mattos C., Michnick S., Ngo T., Nguyen D. T., Prodhom B., Reiher W. E., Roux B., Schlenkrich M., Smith J. C., Stote R., Straub J., Watanabe M., Wiorkiewicz-Kuczera J., Yin D., and Karplus M., J. Phys. Chem. B 102, 3586 (1998). 10.1021/jp973084f [DOI] [PubMed] [Google Scholar]
- Jang S., Shin S., and Pak Y., J. Am. Chem. Soc. 124, 4976 (2002). 10.1021/ja025675b [DOI] [PubMed] [Google Scholar]
- Karplus M. and Weaver D. L., Protein Sci. 3, 650 (1994). [DOI] [PMC free article] [PubMed] [Google Scholar]
- Islam S. A., Karplus M., and Weaver D. L., J. Mol. Biol. 318, 199 (2002). 10.1016/S0022-2836(02)00029-3 [DOI] [PubMed] [Google Scholar]
- Rose G. D., Fleming P. J., Banavar J. R., and Maritan A., Proc. Natl. Acad. Sci. U.S.A. 103, 16623 (2006). 10.1073/pnas.0606843103 [DOI] [PMC free article] [PubMed] [Google Scholar]


