

Abstract
Vascular growth factors, including vascular endothelial growth factor and fibroblast growth factor-2, bind to heparan sulfate proteoglycans in the basement membrane. While this binding, storage, and release system provides a critical model for controlled drug release devices, basement membrane—growth factor binding kinetics have not been fully established. We modified endothelial cell—growth factor binding kinetics protocols for the basement membrane. The basement membrane showed low affinity for fibroblast growth factor-2 (Kd = 185.8 nM), with a slow off rate (koff = 0.00338 min−1). However, results were confounded by growth factor binding to tissue culture polystyrene in a manner strikingly similar to basement membrane. Since substrate binding could not be blocked, a binding kinetics based correction technique was developed to account for polystyrene growth factor binding. This method was validated by conducting binding kinetics experiments on bacteriologic plates that exhibit little growth factor binding. This novel method will improve our understanding of cell and protein interaction with the basement membrane in health and disease. They can also further be applied to develop biomimetic drug delivery systems.
Keywords: Basement membrane, Extracellular matrix, Binding kinetics, Endothelial cells, Growth factors
Introduction
The sub-endothelial extracellular matrix, also called the basement membrane, provides a reservoir for angiogenic growth factor storage and release. Vascular endothelial growth factor (VEGF) and fibroblast growth factor-2 (FGF-2) bind to heparan sulfate proteoglycans in the basement membrane, where they are protected from degradation and non-enzymatic glycosylation (Vlodavsky et al. 1987; Folkman et al. 1988; Houck et al. 1992; Murdoch et al. 1992; Park et al. 1993; Poltorak et al. 1997; Nissen et al. 1999). When growth factors are later released by heparatinase, heparin-like molecules, thrombin, or other proteases, they stimulate proliferation, migration or survival in neighboring cells (Bashkin et al. 1989; Ishai-Michaeli et al. 1992; Benezra et al. 1993; Whitelock et al. 1996).
Growth factors play an important role in extracellular matrix regulation of angiogenesis. As the matrix is degraded during endothelial cell invasion, matrix-bound growth factors are released to promote angiogenesis (Sottile 2004). FGF-2, along with stimulating critical steps in endothelial cell tube formation, further enhances extracellular matrix degradation through production of urokinase plasminogen activator and matrix metalloproteinases (Presta et al. 2005). As the matrix is degraded, extracellular matrix protein fragments inhibit angiogenesis (Kalluri 2003; Folkman 2006). The pro- and anti-angiogenic balance within the extracellular matrix keeps physiological angiogenesis focal and time-limited (Folkman 2007).
Disruption of the extracellular matrix angiogenic balance contributes to a wide range of angiogenesis dependent diseases (Folkman 2007). Of particular interest is diabetes, which is marked by dysregulated angiogenesis throughout varied vascular beds. Advanced glycation end products increase both extracellular matrix and growth factor expression, perhaps contributing to the enhanced tissue VEGF observed in diabetic nephropathy and retinopathy (Di Mario and Pugliese 2001; Tsilibary 2003). In diabetic wounds, the precise cellular growth factor response required for efficient healing is disrupted either by altered growth factor concentrations or by unresponsive cells (Falanga 2005). In vitro, hyperglycemic cell culture models show altered basement membrane heparan sulfate proteoglycans, as well as higher levels of basement membrane-bound growth factors due to increased growth factor release and endothelial cell permeability (Vogl-Willis and Edwards 2004; Morss and Edelman 2007).
Basement membrane growth factor storage and release is a model for controlled release drug delivery systems. Since growth factor release kinetics affect cell response, sustained growth factor release systems have been developed using synthetic polymers (polyglycolic acid, polylactic acid), natural polymers (collagen, fibrin), or heparin derivatives (heparin–sepharose beads, heparin–alginate gel) (Edelman et al. 1991, 1993; Dinbergs et al. 1996; Tanihara et al. 2001; Kanematsu et al. 2004; Fischbach and Mooney 2007). Within these systems, growth factor temporal and spatial gradients can be created by adjusting polymer concentration, size, charge, and crosslinking density. Matrix-mimetic techniques have also been used, including covalently bonding matrix components into the polymer to control growth factor release using endogenous enzymatic degradation. When an appropriate synthetic system is not available, extracted matrix itself provides the substrate for cell growth and tissue engineering (Kibbey 1994; Hodde et al. 2001).
Despite wide use of biomimetic growth factor delivery systems, the specifics of extracellular matrix—growth factor binding kinetics are not fully known. Endothelial cell—growth factor binding kinetics have been studied, and mechanisms of growth factor binding to extracellular matrix have been explored (Moscatelli 1988; Bashkin et al. 1989; Nugent and Edelman 1992). Heparin, pH and thrombospondin affect growth factor transport through and binding to the extracellular matrix (Flaumenhaft et al. 1990; Dowd et al. 1999; Margosio et al. 2003; Goerges and Nugent 2004). However, no systematic study has characterized the dissociation constant, as well as the on and off rates, for growth factors and the basement membrane.
We now demonstrate a new method for measuring basement membrane FGF-2 binding kinetics, based on proven protocols for cell FGF-2 binding kinetics (Nugent and Edelman 1992). A detailed understanding of growth factor binding kinetics was used to normalize data for substrate binding. This technique will improve our understanding of growth factor interaction with the extracellular matrix, which will contribute to the development of more efficacious growth factor therapies.
Materials and methods
Cell culture
Porcine aortic endothelial cells (PAEC) were isolated from porcine aortae by the collagenase dispersion method (Wong and Gotlieb 1984). PAEC were selected for these studies because they produce abundant extracellular matrix and demonstrate similar growth factor binding kinetics as human cells, yet require less growth factor supplementation in the cell medium. Cells were maintained in low glucose Dulbecco’s Modified Eagle’s Medium (DMEM) supplemented with 5% fetal bovine serum (FBS), 1% penicillin–streptomycin, and 2% glutamine (Invitrogen, Carlsbad, CA, USA). Culture medium was changed every 48 h, and cells were used between passages four and nine. For basement membrane growth, PAEC were seeded near confluence and grown for 4 days in 24-well tissue culture polystyrene plates (Corning, Corning, NY, USA). 4% w/v 40 kDa dextran (Sigma, St. Louis, MO, USA) was added to medium for the last 2 days to increase cellular basement membrane production (Gospodarowicz et al. 1980).
Basement membrane isolation
After 4 days in culture, PAEC were removed using four different cell lysis buffers to determine which method produced an intact basement membrane free from cellular debris. The first lysis buffer consisted of Triton X-100 (0.5%, Sigma, St. Louis, MO, USA) in a 20 mM sodium hydroxide (NH4OH, Sigma, St. Louis, MO, USA) solution to lyse cells and remove them from the basement membrane. Triton X-100 is a non-ionic detergent which is often used at low concentrations to permeabilize cells and solubilize proteins. Most proteins and enzymes remain active when exposed to up to 1% Triton X-100. For the second lysis solution, Complete Protease Inhibitor (Roche, Indianapolis, IN, USA) and DNAse (Invitrogen, Carlsbad, CA, USA) were added to the first lysis buffer to ensure that basement membrane proteins were not degraded in the lysis process and that any remaining DNA was removed from the basement membrane. The third lysis buffer consisted of 4% sodium deoxycholate (Sigma, St. Louis, MO, USA) as an alternative detergent. Sodium deoxycholate is an anionic detergent commonly used for cell lysis and membrane protein isolation. For the fourth lysis buffer, water alone was used to disrupt the cells and isolate the basement membrane. Following cell lysis, basement membrane was thoroughly washed in phosphate buffered saline (PBS, Invitrogen, Carlsbad, CA, USA) and stored at 4 °C in sterile PBS for up to 1 week.
Sample preparation for scanning electron microscopy
PAEC were cultured on glass cover slips (VWR, West Chester, PA, USA) and basement membrane isolated as described. Samples were dehydrated in graded solutions of ethanol and hexamethyldisilazane (HMDS, Sigma, St. Louis, MO, USA). HMDS has been shown to be as effective at preserving biological sample structure as critical point drying (Braet et al. 1997). HMDS was evaporated overnight in a fume hood, and basement membrane samples were stored under desiccant for a minimum of 3 days to ensure complete dehydration. Samples were mounted on stubs, coated with 20 nm gold, and imaged with a JEOL 5910 SEM.
FGF-2 extraction and measurement
Basement membrane FGF-2 was extracted using a salt buffer (2 M NaCl, 20 mM Hepes, pH 7.4), which was deemed sufficient after subsequent extractions failed to produce additional FGF-2 (Nugent and Edelman 1992). FGF-2 was quantified with an FGF ELISA (R&D Systems, Minneapolis, MN, USA). Extraction buffer alone did not alter FGF ELISA accuracy. Since each ELISA varied slightly, and FGF-2 degraded quickly in salt buffer, FGF-2 levels for each experiment were quantified immediately using a single ELISA kit whenever possible.
FGF-2 binding kinetics
FGF-2 basement membrane binding kinetics were evaluated using a modification of the method of Nugent and Edelman (1992). To determine FGF-2 equilibrium binding capacity (saturation binding), recombinant human FGF-2 (Peprotech, Rocky Hill, NJ, USA) in binding buffer (25 mM Hepes, 0.05% w/v gelatin, pH 7.4; Sigma, St. Louis, MO, USA) was added to isolated basement membrane at concentrations from 0 to 1 μg/mL. Equilibrium, defined as the time at which association and dissociation occur at equal rates resulting in no change in FGF-2 bound to basement membrane, occurred approximately 3 h after growth factor addition. The FGF-2 solution was aspirated, basement membrane washed quickly in binding buffer to remove unbound FGF-2, and bound FGF-2 extracted as described.
Basement membrane FGF-2 association was measured by adding 5 ng/mL FGF-2 in binding buffer to isolated basement membrane for 0–360 min. This concentration (5 ng/mL) is within the linear binding range and results in physiologically relevant bound FGF-2 levels. After the incubation period, the FGF-2 solution was aspirated, basement membrane washed quickly in binding buffer, and bound FGF-2 extracted as described.
FGF-2 basement membrane dissociation kinetics were determined by incubating isolated basement membrane with 5 ng/mL 125I-FGF-2 (Perkin Elmer, Waltham, MA, USA) in binding buffer to equilibrium (3 h). The 125I-FGF-2 solution was aspirated, basement membrane washed in binding buffer, and binding buffer containing unlabeled FGF-2 (1 μg/mL) added to each well for 0–360 min. Unlabeled FGF-2 was included in dissociation buffer to decrease rebinding of released 125I-FGF-2 to basement membrane. After the dissociation period, dissociation buffer was removed and basement membrane bound 125I-FGF-2 was extracted as described. 125I-FGF-2 in dissociation buffer and salt extraction buffer was quantified in a gamma counter (Packard, Waltham, MA, USA).
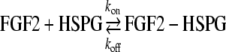
FGF-2 binding kinetics to basement membrane HSPG were determined assuming the following reversible binding reaction:
 |
The equilibrium dissociation constant, Kd, was determined by fitting a one-site binding (hyperbolic) model to the saturation binding curve using linear regression in Prism software (Graphpad, La Jolla, CA USA), according to the equation:
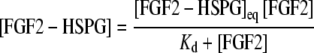 |
The off rate constant, koff, was determined by fitting a dissociation (exponential) model to the dissociation (off-rate) curve using linear regression in Prism software, according to the equation:
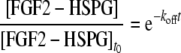 |
The on rate constant, kon, was then calculated from the dissociation and off rate constants according to:
 |
Binding kinetics constants are presented as mean ± SE, as calculated from three samples of each condition or time point. Unbound FGF-2 depletion, determined by calculating the percentage of bound versus unbound FGF-2, was less than 10% for all experiments.
Statistics
Statistical analyses were performed with Prism software. Data are graphed as mean ± SD, while binding constants are presented as mean ± SE. Comparisons between two groups were analyzed by Student’s t test, and comparisons between more than two groups were analyzed by ANOVA. A value of p < 0.05 was considered statistically significant and is indicated in the text as such or in figures with a pound sign (#). A value of p < .01 is indicated with an asterisk (*). If no statistical significance is reported, none was observed.
Results
Basement membrane isolation techniques
Four cell lysis solutions were tested for endothelial cell basement membrane isolation. Scanning electron microscopy images (Fig. 1) show that lysis buffers containing either Triton X-100 or sodium deoxycholate successfully isolated basement membrane, which appears as a protein mesh adhered to the substrate. Each isolated basement membrane was free of cell debris, and there was no discernable difference either visually or functionally (assessed by endothelial cell proliferation on isolated basement membrane, data not shown) among the detergent-based methods. However, when water alone was used as the lysis solution, no basement membrane was apparent on the substrate. Since the detergent lysis buffers were equally effective, the Triton X-100 buffer without protease inhibitor or DNAse was used for all subsequent experiments.
Fig. 1.

Basement membrane can be isolated with a variety of detergent buffers. Endothelial cells grown for 4 days were removed with a Triton X-100 in 20 mM NH4OH, b Triton X-100 in 20 mM NH4OH with protease inhibitor and DNAse, c sodium deoxycholate, or d water. Samples were imaged by scanning electron microscopy
Basement membrane and tissue culture polystyrene FGF-2 binding kinetics
FGF-2 binds to tissue culture polystyrene in a manner similar to basement membrane, which confounds growth factor basement membrane binding kinetics experiments. Equilibrium FGF-2 binding capacity of basement membrane and tissue culture polystyrene increased linearly from 0 to 2,500 ng/mL added FGF-2 and reached a maximum at approximately 5,000 ng/mL. (Fig. 2a). At saturation, FGF-2 bound to basement membrane was ~15% higher than that bound to tissue culture polystyrene. FGF-2 association to and dissociation from basement membrane and tissue culture polystyrene showed similar binding kinetics (Fig. 2b, c). Associated FGF-2 increased linearly with time for both basement membrane and tissue culture polystyrene, reaching equilibrium at 60 min. Equilibrium FGF-2 association was 15% higher for basement membrane than tissue culture polystyrene. While more FGF-2 was initially bound to basement membrane, FGF-2 dissociated from both basement membrane and tissue culture polystyrene at similar rates (Fig. 2c). However, for both substrates, less than 25% of initially bound FGF-2 dissociated in the 360 min experiment. The low affinity of basement membrane for FGF-2, the slow off rate, and the similarities between basement membrane and tissue culture polystyrene binding kinetics are confirmed by the calculated dissociation, on, and off constants in Table 1.
Fig. 2.

FGF-2 binds and releases from tissue culture polystyrene in a manner similar to basement membrane. a FGF-2 equilibrium capacity (p < 0.05 by ANOVA) was determined by adding FGF-2 in binding buffer to isolated basement membrane or tissue culture polystyrene at concentrations ranging from 0 to 1 μg/mL. After 3 h, the FGF-2 solution was aspirated, bound FGF-2 extracted using a 2 M salt buffer, and quantified via FGF ELISA; b FGF-2 association (p < 0.01 by ANOVA) was measured by adding 5 ng/mL FGF-2 in binding buffer to basement membrane or tissue culture polystyrene for 0–360 min. FGF-2 was then extracted and quantified as described; c FGF-2 dissociation (p < 0.01 by ANOVA) was determined by incubating basement membrane or tissue culture polystyrene with 5 ng/mL 125I-FGF-2 for 3 h. The 125I-FGF-2 was aspirated and binding buffer with 1 μg/mL unlabeled FGF-2 was added for 0–360 min. After the incubation period, 125I-FGF-2 was extracted as described and quantified in a gamma counter; d equilibrium FGF-2 bound after tissue culture polystyrene binding sites were blocked by incubating samples with medium or Triton X-100 overnight. Gelatin and heparinase were similarly ineffective (data not shown)
Table 1.
FGF-2 binding constants for basement membrane and tissue culture polystyrene
| Basement membrane | Tissue culture polystyrene | Basement membrane-corrected | |
|---|---|---|---|
| koff (min−1) | 0.00338 ± 0.0014 | 0.00367 ± 0.0020 | 0.00692 ± 0.0047 |
| kon (M−1 min−1) | 1.82 × 10⁴ | 2.71 × 10⁴ | 1.08 × 10⁴ |
| Kd (nM) | 185.8 ± 44.8 | 135.2 ± 46.1 | 640.2 ± 250.2 |
Several methods were used to block FGF-2 binding to tissue culture polystyrene (Fig. 2d). However, neither using medium to blocking non-specific binding nor using Triton X-100 to wash away binding sites prevented FGF-2 from binding to polystyrene. Gelatin was also ineffective as a blocking agent, as was heparinase in removing binding sites (data not shown). Decreasing extraction time slightly decreased FGF-2 removed from the tissue culture polystyrene, however this method did not eliminate polystyrene effects from altering basement membrane FGF-2 binding kinetics calculations. We therefore developed a method to correct for growth factor binding to polystyrene in our basement membrane binding kinetics experiments.
Correction method for substrate binding
Basement membrane binding kinetics assays were corrected for polystyrene substrate binding. FGF-2 bound to the tissue culture polystyrene was subtracted using a combination of exposed polystyrene binding area and polystyrene—FGF-2 binding kinetics data. Exposed tissue culture polystyrene area on basement membrane samples was calculated by adding the exposed area on the bottom and sides of the tissue culture well.
The exposed polystyrene on the well bottom was calculated based on the percentage of the well covered by basement membrane proteins. SEM basement membrane images were converted to black and white in Photoshop (Adobe, San Jose, CA, USA), where white indicated basement membrane protein (Fig. 3). White pixels were counted and divided by the total image pixels to determine the exposed polystyrene percentage. For samples with basement membrane, an average of 30% of the bottom area of the tissue culture well was exposed polystyrene. This percentage was multiplied by the well bottom area to determine the exposed polystyrene on the well bottom. The exposed polystyrene on the well sides was determined from the added fluid volume and the well dimensions. The exposed polystyrene on the well bottom and sides were added to calculate the total exposed polystyrene area for basement membrane samples:
 |
Fig. 3.

Basement membrane images were used to calculate exposed tissue culture polystyrene area. Scanning electron microscopy basement membrane images (a) were converted to black and white (b). White pixels were considered to be basement membrane proteins, and black pixels were considered to be tissue culture polystyrene
The total exposed polystyrene area for samples without basement membrane was similarly calculated, but in this case the entire well bottom area was exposed:
 |
Corrected basement membrane-bound FGF-2 (FGF2BM,corrected) was determined by subtracting the exposed polystyrene-bound FGF-2 from the total bound FGF-2 (FGF2BM). The exposed polystyrene bound FGF-2 was calculated by multiplying FGF-2 bound to polystyrene alone (FGF2TCPS) for a given time point and experiment type (capacity, association, dissociation) by the ratio of exposed polystyrene area with basement membrane present (PolystyreneAreaBM) to exposed polystyrene area without basement membrane (PolystyreneAreaTCPS). The corrected basement membrane-bound FGF-2 was then divided by the bottom well area to find bound FGF-2 per sq. cm.
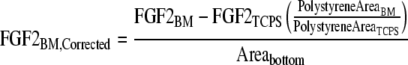 |
Validation of substrate binding correction method
The substrate binding correction method was validated by growing basement membrane on bacteriologic plates, which do not bind FGF-2. Corrected FGF-2 basement membrane association on tissue culture polystyrene was statistically similar to FGF-2 basement membrane association on bacteriologic plates (Fig. 4a). Basement membrane FGF-2 capacity, association, and dissociation were each corrected for FGF-2 binding to polystyrene (capacity data are shown in Fig. 4b). In each case, correction lowered the bound FGF-2 quantity but did not significantly change the binding rate constants (Table 1).
Fig. 4.

Corrected FGF-2 basement membrane binding is similar to that on bacteriologic plates. FGF-2 binding kinetics experiments were repeated on basement membrane grown on bacteriologic plates, which bind little to no FGF-2. Association data are shown in (a), and capacity data are shown in (b)
The correction method importance was evident in basement membrane FGF-2 binding in high glucose binding buffer (Fig. 5). Without the correction, high glucose binding buffer appeared to decrease FGF-2 basement membrane binding. Upon further examination, high glucose binding buffer actually decreased FGF-2 binding to tissue culture polystyrene. When basement membrane-bound FGF-2 was corrected for polystyrene binding, the glucose effect disappeared.
Fig. 5.

Correction eliminated a change in FGF-2 binding in high glucose. a FGF-2 basement membrane association appears lower in high glucose binding buffer (p < 0.01 by ANOVA), b FGF-2 polystyrene binding is actually lower in high glucose binding buffer (p < 0.05 by ANOVA), c Correcting FGF-2 basement membrane association for polystyrene binding removes the glucose effect
Discussion
Growth factor binding, storage, and release play critical roles in vascular function in health and disease. While basement membrane growth factor binding mechanisms and tissue transport had been studied, basement membrane growth factor binding kinetics remained largely unexplored. We now show that FGF-2 basement membrane binding is a low affinity interaction with a slow off rate, and basement membrane binding kinetics are similar to those of tissue culture polystyrene. In light of these findings, we validated a new method for measuring basement membrane binding kinetics. In this technique, growth factor binding to the substrate was accounted for using a detailed understanding of binding kinetics. In addition to helping us understand how growth factors bind to the basement membrane in vivo, these experiments provide the basis for intelligent controlled release drug delivery device design.
Our experiments show similar binding kinetics as earlier studies of FGF-2 and VEGF binding to basement membrane from bovine aortic, bovine corneal, and human umbilical vein endothelial cells (Vlodavsky et al. 1987; Bashkin et al. 1989; Poltorak et al. 1997). While basement membrane from different cell types may have varied composition, and therefore different growth factor binding kinetics, we believe that our methods are applicable even if binding kinetics vary. Our data also confirm the large FGF-2 basement membrane saturation capacity. We calculated that 2.7 × 10¹² FGF-2 molecules bind in a square centimeter of basement membrane when the binding saturates near 5 μg/mL added FGF-2. Previous work by Bashkin et al. (1989) reported 1.5 × 10¹² FGF-2 molecules in a square millimeter, a factor of 100 higher than our results. This apparent discrepancy is likely related to the total basement membrane amount, since basement membrane in our study was prepared by growing cells for 4 days after confluence whereas cells in the Bashkin study were grown for 6–8 days. These saturation data support the basement membrane’s potential to bind FGF-2 levels three orders of magnitude higher (ng/cm2) that those measured from cell-produced basement membrane in vitro (pg/cm2) (Morss and Edelman 2007).
Several previous studies examined growth factor binding kinetics to endothelial cells (cell surface receptors and heparan sulfate proteoglycans) and basement membrane (heparan sulfate proteoglycans). For cells, dissociation constants ranged from 2.7 × 10⁻¹⁰ M for cell surface receptors to 2 × 10⁻⁹ M for heparan sulfate proteoglycans (Neufeld and Gospodarowicz 1985; Moscatelli 1987). For basement membrane, the dissociation constant was much higher at 6.1 × 10⁻⁷ M (Bashkin et al. 1989). Our calculated dissociation constant for basement membrane (1.86 × 10⁻⁷ M uncorrected, 6.40 × 10⁻⁷ M corrected) agrees well with the literature. It is thought that this low affinity binding allows rapid release of basement membrane bound FGF-2 for cell use when a specific signal is given.
The on and off constants for FGF-2 basement membrane binding had not previously been reported. The calculated basement membrane off rate (0.0034 min−1 uncorrected, 0.0069 min−1 corrected) is closer to the previously reported off rate for cell surface receptors (0.003 min−1) than cell surface heparan sulfate proteoglycans (0.68 min−1) (Nugent and Edelman 1992). Our calculated off rate agrees with previously published observations that little matrix-bound FGF-2 is spontaneously released (Bashkin et al. 1989). Yet it is surprising that FGF-2 interaction with heparan sulfate proteoglycans shows different kinetics for cells and basement membrane. Nugent hypothesized that the slow FGF-2 off rate for cell surface receptors could result from stable complex formation of FGF-2, cell surface receptors, and heparan sulfate proteoglycans (Nugent and Edelman 1992). Therefore, it is possible that FGF-2 and heparan sulfate proteoglycans interact with other proteins in the basement membrane to form stable complexes that prevent FGF-2 release unless a signal is provided.
Detergents are commonly used to perforate and solubilize cell membranes. In this study, we examined the efficacy of different detergent buffers for basement membrane isolation. Both Triton X-100 and sodium deoxycholate removed endothelial cells, leaving an intact basement membrane adherent to the tissue culture plate. However, sodium deoxycholate is an ionic detergent which modifies protein structure to a greater extent than non-ionic detergents such as Triton X-100. Additionally, ionic detergents are more sensitive to pH, which might be an issue when a base such as ammonium hydroxide is used in conjunction with detergent to aid in quickly lysing cells. Because of its effectiveness in thoroughly removing cells while causing minimal apparent damage to basement membrane, we used the Triton X-100 NH4OH solution to isolate basement membrane throughout these experiments. As protease inhibitor and DNAse addition did not significantly alter cellular debris on basement membrane or basement membrane promotion of cell proliferation, these additional reagents were deemed unnecessary for the cell lysis buffer. An alternative solution for basement membrane isolation is removing cells without lysis. We also tested basement membrane isolation with urea, which did not lyse cells, but no change in basement membrane characteristics was observed.
Endothelial cell FGF-2 binding protocols were modified for basement membrane FGF-2 binding kinetics (Nugent and Edelman 1992). Many of these modifications were actually simplifications. Basement membrane binding kinetics experiments were completed at room temperature, rather than at 4 °C, since cell viability and cell growth factor metabolism were not issues. While the ideal experiment would match the in vivo temperature, room temperature is closer to 37 °C, therefore this method is more likely to simulate in vivo binding kinetics. The lysis buffer used only Hepes as a buffer base rather than serum free medium, again because cell viability did not need to be considered. For cell experiments, growth factor bound to both heparan sulfate proteoglycans and cell surface receptors was determined by sequential salt and acid buffers. For basement membrane, only the salt buffer was used because there are no known specific FGF-2 receptors in basement membrane. Previous research on FGF-2 basement membrane binding mechanisms suggests that FGF-2 binds primarily to heparan sulfate moieties in basement membrane. Heparinase effectively released basement membrane-bound FGF-2 whereas chondroitinase did not, and heparan sulfate inhibited 50% of FGF-2 binding to basement membrane whereas chondroitin sulfate, keratan sulfate, and hyaluronic acid had minimal effects (Bashkin et al. 1989). FGF-2 may bind to other proteoglycans or proteins in the basement membrane, and methods to assess this binding would improve the current protocol.
However, a unique complication does arise in basement membrane FGF-2 binding kinetics measurements. Tissue culture polystyrene, which is exposed underneath the fibrillar basement membrane, binds and releases FGF-2 in a manner similar to basement membrane. It is not clear if FGF-2 binds to a specific site on polystyrene, or if the binding is non-specific. However, no reagent that either blocked or removed binding sites was able to prevent FGF-2 binding to polystyrene. Since we were unable to block FGF-2 polystyrene binding, we accounted for this effect by subtracting FGF-2 bound to exposed polystyrene area in the basement membrane samples. Through this calculation, we showed that corrected basement membrane FGF-2 capacity is significantly lower than originally measured. The large drop is related to the high surface to volume ratio, since these experiments were conducted in 96 well plates. While FGF-2 binding and release levels changed with the polystyrene correction, the shapes of the equilibrium capacity, association, and dissociation curves are similar. Our validation with bacteriologic plates, which bind little to no FGF-2, suggests that our method adequately corrected for FGF-2 binding to polystyrene.
The correction methodology is limited by the exposed tissue culture polystyrene area calculation. The basement membrane is fibrillar, porous, and nanoscale, therefore the exposed polystyrene area was assessed by scanning electron microscopy. Since the basement membrane is visible by phase contrast microscopy, and fluorescent antibodies and colored stains exist for varied basement membrane proteins, it may be possible to image the basement membrane with high resolution fluorescent or light microscopy if an electron microscope is not available. In any case, the correction for FGF-2 binding to the sides of the polystyrene well can be implemented without basement membrane imaging.
FGF-2 binding to and slow release from tissue culture polystyrene likely contributes to polystyrene’s efficacy as a cell culture substrate. FGF-2 is present in serum supplemented medium, therefore when cells are seeded, FGF-2 binds to polystyrene. FGF-2 is then slowly released as soluble FGF-2 stores are consumed by cells. This polystyrene property can be leveraged further by incubating tissue culture polystyrene plates with FGF-2 prior to cell seeding. An FGF-2 coated polystyrene plate achieves long term improved cell proliferation, comparable to coating a plate with basement membrane or a matrix derivative (Data not shown).
This method to measure growth factor binding kinetics with the basement membrane will enhance our knowledge of the complex role of extracellular matrix in health and disease. In particular, this method could be applied to studying the role of growth factors in angiogenesis and metastasis, among others. It can also be extrapolated to inflammatory cytokines, which have also been shown to bind into the basement membrane where their residence life is increased. Finally, an improved understanding of native binding kinetics may significantly improve the efficacy of bio-inspired controlled release drug devices.
Acknowledgment
We would like to thank Matthew Nugent for his advice on binding kinetics.
References
- Bashkin P, Doctrow S et al (1989) Basic fibroblast growth factor binds to subendothelial extracellular matrix and is released by heparitinase and heparin-like molecules. Biochemistry 28(4):1737–1743 [DOI] [PubMed]
- Benezra M, Vlodavsky I et al (1993) Thrombin-induced release of active basic fibroblast growth factor-heparan sulfate complexes from subendothelial extracellular matrix. Blood 81(12):3324–3331 [PubMed]
- Braet F, deZanger R et al (1997) Drying cells for SEM, AFM and TEM by hexamethyldisilazane: a study on hepatic endothelial cells. J Microsc-Oxford 186:84–87 [DOI] [PubMed]
- Di Mario U, Pugliese G (2001) 15th Golgi lecture: from hyperglycaemia to the dysregulation of vascular remodelling in diabetes. Diabetologia 44(6):674–692 [DOI] [PubMed]
- Dinbergs ID, Brown L et al (1996) Cellular response to transforming growth factor-beta1 and basic fibroblast growth factor depends on release kinetics and extracellular matrix interactions. J Biol Chem 271(47):29822–29829 [DOI] [PubMed]
- Dowd CJ, Cooney CL et al (1999) Heparan sulfate mediates bFGF transport through basement membrane by diffusion with rapid reversible binding. J Biol Chem 274(8):5236–5244 [DOI] [PubMed]
- Edelman ER, Mathiowitz E et al (1991) Controlled and modulated release of basic fibroblast growth-factor. Biomaterials 12(7):619–626 [DOI] [PubMed]
- Edelman ER, Nugent MA et al (1993) Perivascular and intravenous administration of basic fibroblast growth factor: vascular and solid organ deposition. Proc Natl Acad Sci USA 90(4):1513–1517 [DOI] [PMC free article] [PubMed]
- Falanga V (2005) Wound healing and its impairment in the diabetic foot. Lancet 366(9498):1736–1743 [DOI] [PubMed]
- Fischbach C, Mooney DJ (2007) Polymers for pro- and anti-angiogenic therapy. Biomaterials 28(12):2069–2076 [DOI] [PubMed]
- Flaumenhaft R, Moscatelli D et al (1990) Heparin and heparan sulfate increase the radius of diffusion and action of basic fibroblast growth factor. J Cell Biol 111(4):1651–1659 [DOI] [PMC free article] [PubMed]
- Folkman J (2006) Angiogenesis. Annu Rev Med 57:1–18 [DOI] [PubMed]
- Folkman J (2007) Angiogenesis: an organizing principle for drug discovery? Nat Rev Drug Discov 6(4):273–286 [DOI] [PubMed]
- Folkman J, Klagsbrun M et al (1988) A heparin-binding angiogenic protein–basic fibroblast growth factor–is stored within basement membrane. Am J Pathol 130(2):393–400 [PMC free article] [PubMed]
- Goerges AL, Nugent MA (2004) pH regulates vascular endothelial growth factor binding to fibronectin: a mechanism for control of extracellular matrix storage and release. J Biol Chem 279(3):2307–2315 [DOI] [PubMed]
- Gospodarowicz D, Delgado D et al. (1980) Permissive effect of the extracellular-matrix on cell-proliferation invitro. Proceedings of the national academy of sciences of the United States of America-biological sciences, 77(7): 4094–4098 [DOI] [PMC free article] [PubMed]
- Hodde JP, Record RD et al (2001) Vascular endothelial growth factor in porcine-derived extracellular matrix. Endothelium 8(1):11–24 [DOI] [PubMed]
- Houck KA, Leung DW et al (1992) Dual regulation of vascular endothelial growth factor bioavailability by genetic and proteolytic mechanisms. J Biol Chem 267(36):26031–26037 [PubMed]
- Ishai-Michaeli R, Svahn CM et al (1992) Importance of size and sulfation of heparin in release of basic fibroblast growth factor from the vascular endothelium and extracellular matrix. Biochemistry 31(7):2080–2088 [DOI] [PubMed]
- Kalluri R (2003) Basement membranes: structure, assembly and role in tumour angiogenesis. Nat Rev Cancer 3(6):422–433 [DOI] [PubMed]
- Kanematsu A, Marui A et al (2004) Type I collagen can function as a reservoir of basic fibroblast growth factor. J Control Release 99(2):281–292 [DOI] [PubMed]
- Kibbey MC (1994) Maintenance of the EHS sarcoma and matrigel preparation. Tissue Cult Methods 16:4
- Margosio B, Marchetti D et al (2003) Thrombospondin 1 as a scavenger for matrix-associated fibroblast growth factor 2. Blood 102(13):4399–4406 [DOI] [PubMed]
- Morss AS, Edelman ER (2007) Glucose modulates basement membrane fibroblast growth factor-2 via alterations in endothelial cell permeability. J Biol Chem 282(19):14635–14644 [DOI] [PubMed]
- Moscatelli D (1987) High and low affinity binding-sites for basic fibroblast growth-factor on cultured-cells—absence of a role for low affinity binding in the stimulation of plasminogen-activator production by bovine capillary endothelial-cells. J Cell Physiol 131(1):123–130 [DOI] [PubMed]
- Moscatelli D (1988) Metabolism of receptor-bound and matrix-bound basic fibroblast growth factor by bovine capillary endothelial cells. J Cell Biol 107(2):753–759 [DOI] [PMC free article] [PubMed]
- Murdoch AD, Dodge GR et al (1992) Primary structure of the human heparan-sulfate proteoglycan from basement-membrane (Hspg2/Perlecan)—a chimeric molecule with multiple domains homologous to the low-density-lipoprotein receptor, laminin, neural cell-adhesion molecules, and epidermal growth-factor. J Biol Chem 267(12):8544–8557 [PubMed]
- Neufeld G, Gospodarowicz D (1985) The identification and partial characterization of the fibroblast growth-factor receptor of baby hamster-kidney cells. J Biol Chem 260(25):3860–3868 [PubMed]
- Nissen NN, Shankar R et al (1999) Heparin and heparan sulphate protect basic fibroblast growth factor from non-enzymic glycosylation. Biochem J 338(Pt 3):637–642 [DOI] [PMC free article] [PubMed]
- Nugent MA, Edelman ER (1992) Kinetics of basic fibroblast growth factor binding to its receptor and heparan sulfate proteoglycan: a mechanism for cooperactivity. Biochemistry 31(37):8876–8883 [DOI] [PubMed]
- Park JE, Keller GA et al (1993) The vascular endothelial growth factor (VEGF) isoforms: differential deposition into the subepithelial extracellular matrix and bioactivity of extracellular matrix-bound VEGF. Mol Biol Cell 4(12):1317–1326 [DOI] [PMC free article] [PubMed]
- Poltorak Z, Cohen T et al (1997) VEGF145, a secreted vascular endothelial growth factor isoform that binds to extracellular matrix. J Biol Chem 272(11):7151–7158 [DOI] [PubMed]
- Presta M, Dell’Era P et al (2005) Fibroblast growth factor/fibroblast growth factor receptor system in angiogenesis. Cytokine Growth Factor Rev 16(2):159–178 [DOI] [PubMed]
- Sottile J (2004) Regulation of angiogenesis by extracellular matrix. Biochim Biophys Acta 1654(1):13–22 [DOI] [PubMed]
- Tanihara M, Suzuki Y et al (2001) Sustained release of basic fibroblast growth factor and angiogenesis in a novel covalently crosslinked gel of heparin and alginate. J Biomed Mater Res 56(2):216–221 [DOI] [PubMed]
- Tsilibary EC (2003) Microvascular basement membranes in diabetes mellitus. J Pathol 200(4):537–546 [DOI] [PubMed]
- Vlodavsky I, Folkman J et al (1987) Endothelial cell-derived basic fibroblast growth factor: synthesis and deposition into subendothelial extracellular matrix. Proc Natl Acad Sci USA 84(8):2292–2296 [DOI] [PMC free article] [PubMed]
- Vogl-Willis CA, Edwards IJ (2004) High-glucose-induced structural changes in the heparan sulfate proteoglycan, perlecan, of cultured human aortic endothelial cells. Biochim Biophys Acta 1672(1):36–45 [DOI] [PubMed]
- Whitelock JM, Murdoch AD et al (1996) The degradation of human endothelial cell-derived perlecan and release of bound basic fibroblast growth factor by stromelysin, collagenase, plasmin, and heparanases. J Biol Chem 271(17):10079–10086 [DOI] [PubMed]
- Wong MKK, Gotlieb AI (1984) Invitro reendothelialization of a single-cell wound—role of microfilament bundles in rapid lamellipodia-mediated wound closure. Lab Invest 51(1):75–81 [PubMed]