Abstract
OBJECTIVE
An increase in the rate of hepatic glucose production is the major determinant of fasting hyperglycemia in type 2 diabetes. A better understanding of the signaling pathways and molecules that regulate hepatic glucose metabolism is therefore of great clinical importance. Recent studies suggest that an increase in vagal outflow to the liver leads to decreased hepatic glucose production and reduced blood glucose levels. Since acetylcholine (ACh) is the major neurotransmitter of the vagus nerve and exerts its parasympathetic actions via activation of muscarinic ACh receptors (mAChRs), we examined the potential metabolic relevance of hepatocyte mAChRs.
RESEARCH DESIGN AND METHODS
We initially demonstrated that the M3 mAChR is the only mAChR subtype expressed by mouse liver/hepatocytes. To assess the physiological role of this receptor subtype in regulating hepatic glucose fluxes and glucose homeostasis in vivo, we used gene targeting and transgenic techniques to generate mutant mice lacking or overexpressing M3 receptors in hepatocytes only.
RESULTS
Strikingly, detailed in vivo phenotyping studies failed to reveal any significant metabolic differences between the M3 receptor mutant mice and their control littermates, independent of whether the mice were fed regular or a high-fat diet. Moreover, the expression levels of genes for various key transcription factors, signaling molecules, and enzymes regulating hepatic glucose fluxes were not significantly altered in the M3 receptor mutant mice.
CONCLUSIONS
This rather surprising finding suggests that the pronounced metabolic effects mediated by activation of hepatic vagal nerves are mediated by noncholinergic signaling pathways.
An increase in the rate of hepatic glucose production is the major contributor to fasting hyperglycemia in type 2 diabetes (1). A better understanding of the signaling pathways and molecules that regulate hepatic glucose metabolism is therefore of high pathophysiological relevance.
Besides the well-known hepatic actions of the pancreatic hormones insulin and glucagon, hepatic glucose fluxes are regulated by several other hormones and neurotransmitters. For example, several studies suggest that stimulation of hepatic parasympathetic (vagal) nerves leads to reduced hepatic glucose output (2–4), increased glycogen storage (5,6), and enhanced hepatic glucose uptake (4,7,8). Consistent with these results, acetylcholine (ACh), the principal neurotransmitter stored in peripheral parasympathetic nerve endings, has been shown to promote glycogen synthesis in isolated rat hepatocytes (9,10).
Interestingly, a brain-liver circuit has been described recently that is thought to be critical for maintaining normal glucose homeostasis (11–13). In this circuit, increased insulin and fatty acid levels are sensed in the mediobasal hypothalamus, and the resulting activation of central ATP-sensitive K+ channels eventually triggers an increase in vagal outflow to the liver. This increased activity of efferent hepatic vagal nerves results in decreased hepatic glucose production including reduced gluconeogenesis, leading to a lowering of blood glucose levels (11–13). A recent study (14) demonstrated that this brain-liver circuit can also be activated by the direct administration of lipids into the upper intestinal tract. These studies led to the conclusion that any alterations within this gut-brain-liver are likely to contribute to diabetic hyperglycemia.
The molecular nature of the hepatic receptors mediating the striking metabolic effects following activation of hepatic vagal nerves remains unknown at present. Following its release from vagal nerve endings, ACh acts on distinct muscarinic ACh receptor subtypes (M1–M5 mAChRs) to regulate specific signaling pathways (15,16). It seemed therefore reasonable to assume that mAChRs play a key role in mediating the prominent changes in glucose fluxes seen after stimulation of vagal nerves innervating the liver.
In this study, we initially demonstrated that the M3 mAChR is the only mAChR subtype expressed by mouse liver/hepatocytes. To assess the physiological role of this receptor subtype in regulating hepatic glucose fluxes and glucose homeostasis in vivo, we employed Cre/loxP technology to generate mutant mice lacking M3 receptors in hepatocytes only. Moreover, to study the metabolic effects of enhanced signaling through liver M3 mAChRs, we also generated mutant mice selectively overexpressing this receptor subtype in hepatocytes.
Interestingly, we found that the absence or overexpression of hepatocyte M3 mAChRs had little or no effect on hepatic glucose fluxes and glucose homeostasis in vivo. These studies led to the surprising conclusion that the pronounced metabolic effects mediated by activation of the efferent vagal nerves innervating the liver are mediated by signaling pathways that do not involve the activation of hepatic mAChRs.
RESEARCH DESIGN AND METHODS
Mouse maintenance and diet.
Mice were housed in a specific pathogen-free barrier facility, maintained on a 12-h light/dark cycle. Unless indicated otherwise, all experiments were carried out with male littermates maintained on a C57BL/6 background. All experiments were approved by the animal care and use committee of the National Institute of Diabetes and Digestive and Kidney Diseases, National Institutes of Health, Bethesda, Maryland.
Generation of mutant mice selectively lacking or overexpressing M3 mAChRs in hepatocytes.
M3 mAChR mutant mice selectively lacking or overexpressing M3 mAChRs in hepatocytes (Hep-M3-KO and Hep-M3-Tg mice, respectively) were generated as described under supplemental Methods in the online appendix (available at http://diabetes.diabetesjournals.org/cgi/content/full/db09-0522/DC1) (see also Fig. 1). Mouse genotypes were determined via Southern blotting and/or PCR analysis using mouse tail DNA (see supplemental Methods for details).
FIG. 1.
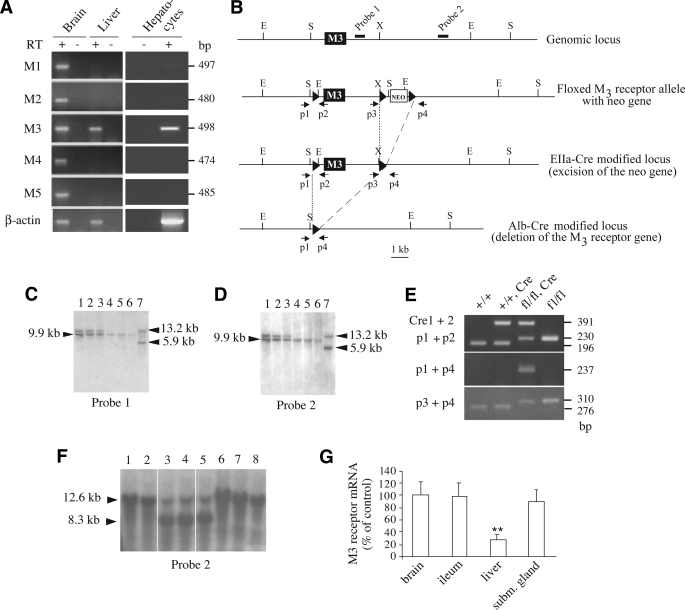
Gene targeting strategy used to selectively delete the M3 mAChR gene in mouse hepatocytes. A: RT-PCR analysis of M1–M5 mAChR expression in mouse liver, hepatocytes, and brain. Primers specific for the individual mouse mAChRs were used to amplify cDNA prepared from wild-type mouse (C57BL/6 background) liver, hepatocyte, and brain total RNA. As expected, all five mAChR subtypes were found to be expressed in the brain (positive control). In mouse liver, only M3 mAChR mRNA could be detected. RT, reverse transcriptase. B: Schematic representation of the mouse M3 mAChR genomic locus, the configuration of the floxed version of the M3 receptor gene, and the EIIa-Cre– and AlbCre-modified alleles. The M3 receptor coding region is represented by the filled boxes. The approximate locations of the probes (filled bars) and primers (arrows) used for Southern analysis and PCR genotyping studies, respectively, are shown. LoxP sites are depicted as black triangles. Relevant restriction enzyme sites are indicated: E, EcoRV; S, SpeI, X, XhoI. C and D: Southern blotting strategy used to identify floxed M3 receptor mice lacking the neo cassette due to EIIa-Cre–mediated deletion of the neo gene. For this analysis, EcoRV-digested mouse tail DNA was examined using either probe 1 (C) or probe 2 (D). The 9.9-kb band indicates the presence of the floxed M3 receptor allele (fl) lacking the neo gene (neo–), whereas the 13.2- and 5.9-kb bands are diagnostic for the wild-type allele and the floxed M3 receptor allele carrying the neo gene (neo+), respectively. The following mouse genotypes were observed: lanes 1–3, M3fl/+, neo−; lanes 4–6, M3fl/fl, neo−; and lane 7, M3fl/+, neo+. E: PCR analysis of liver genomic DNA isolated from mice of the indicated genotypes. Cre indicates the presence of the AlbCre transgene. The location of the p1–p4 PCR primers is indicated in A. The Cre1 and Cre2 primers were used to detect the presence of the AlbCre transgene. The expected sizes of the PCR products are indicated on the right. As expected, only liver DNA obtained from floxed M3 receptor mice harboring the AlbCre transgene gave the 237-bp band (use of PCR primers p1 and p4; center panel), indicative of Cre-mediated deletion of the M3 receptor gene. The 230-bp (upper panel) and 310-bp (lower panel) PCR products are diagnostic for the 5′ and 3′ loxP sites, respectively (the 196- and 276-bp bands correspond to wild-type sequence). F: Southern blotting strategy used to demonstrate the deletion of the M3 receptor gene in the liver of floxed M3 receptor mice carrying the AlbCre transgene. Mouse genomic DNA that had been digested with SpeI was subjected to Southern blotting analysis using probe 2 (see B). Lanes 1 and 2: Genomic DNA isolated from the liver of M3fl/fl mice. Lanes 3–5: Genomic DNA isolated from the liver of M3fl/fl mice carrying the AlbCre transgene. Lanes 6–8: Genomic DNA isolated from brain (lane 6), ileum (lane 7), or submandibular gland (subm. gland) (lane 8) of M3fl/fl mice carrying the AlbCre transgene. The 12.6-kb band is diagnostic for the presence of the floxed M3 receptor allele, whereas the 8.3-kb band indicates that AlbCre-mediated deletion of the M3 receptor gene has occurred. G: qRT-PCR analysis indicating greatly reduced M3 receptor mRNA expression in the liver of M3fl/fl mice carrying the AlbCre transgene. Real-time qRT-PCR studies were carried out using total RNA prepared from the indicated tissues of M3fl/fl AlbCre mice and control (M3fl/fl) littermates (7-month-old males, n = 3). Data were normalized relative to expression levels observed with the control mice (100%). Cyclophilin A served as an internal control. **P < 0.01 vs. control.
Isolation of mouse hepatocytes and Kupffer cells.
Mouse hepatocytes and Kupffer cells were isolated from C57BL/6 mice (aged 2–3 months) (as described in refs. 17 and 18, respectively).
Preparation of cDNA.
Total RNA was extracted from various mouse tissues using the QIAzol Lysis reagent (Qiagen). During total RNA preparation, an on-column DNase I treatment step was performed (RNeasy Mini Kit; Qiagen). For each sample, 1 μg of RNA was reverse-transcribed into cDNA by using the Superscript III first-strand synthesis system for RT-PCR kit (Invitrogen).
RT-PCR analysis of mAChR expression in mouse liver.
The expression of M1–M5 receptor mRNA in liver and hepatocytes from wild-type mice (3-month-old males; C57BL/6 background) was studied via RT-PCR, using cDNA prepared as described above. The receptor subtype–specific PCR primers and other experimental details have been described previously (19). The following PCR conditions were used: 95°C for 30 s, followed by 37 cycles of 95°C for 10 s, 56°C for 40 s, and 72°C for 30 s.
RT-PCR analysis of M3 receptor transgene expression.
cDNA prepared from different tissues of Hep-M3-Tg mice was amplified via PCR using a primer pair specific for the M3 receptor transgene (see supplemental Methods for details).
Real-time quantitative RT-PCR analysis of gene expression.
cDNA was prepared from liver and other mouse tissues as described above. Gene expression levels were measured by real-time quantitative RT-PCR (qRT-PCR) analysis using an ABI 7900HT Fast Real-Time PCR System (Applied Biosystems) (see supplemental Methods for details). Primer sequences are provided in supplemental Table 2.
Radioligand binding studies with mouse liver membranes.
For saturation binding studies, mouse liver membrane preparations were incubated with increasing concentrations (20 pmol/l–3 nmol/l) of [3H]N-methylscopolamine ([3H]NMS) (specific activity: 83 Ci/mmol; PerkinElmer), a non–subtype-selective muscarinic antagonist, following a previously described protocol (20). The preparation of mouse liver membranes is described in detail in the supplemental Methods. Binding data were analyzed using the nonlinear curve–fitting program Prism 4.0 (GraphPad).
Determination of liver glycogen content.
After extraction of glycogen from mouse livers, glycogen was digested with amylase, and glucose concentrations were measured by a glucokinase radiometric assay (see supplemental Methods for details).
Hormone and blood chemistry measurements.
Blood glucose levels were determined by using an automated blood glucose reader (Glucometer Elite Sensor; Bayer). Serum insulin concentrations were determined via enzyme-linked immunosorbent assay (Crystal Chem), and serum corticosterone, norepinephrine, epinephrine, and glucagon levels were measured in freely fed mice by the use of radioimmunoassay kits (corticosterone, MP Biomedicals; norepinephrine and epinephrine, Rocky Mountain Diagnostics; glucagon, Linco). Serum chemistry measurements were performed by the National Institutes of Health Department of Laboratory Medicine.
Western blotting studies.
Extracellular-regulated kinase (Erk) phosphorylation of mouse liver tissues was studied via Western blotting analysis, as described in detail in the supplemental Methods.
In vivo physiological studies.
Oral and intraperitoneal glucose tolerance tests (OGTT and IGTT, respectively) were carried out with mice that had been subjected to an overnight (12-h) fast. In the OGTT, mice were administered an oral load of glucose (2 mg/g body wt) via oral gavage. In the IGTT, mice received the same dose of glucose via intraperitoneal injection. In both tests, blood samples were collected via retroorbital sinus puncture before (0 min) and 15, 30, 60, and 120 min after glucose administration.
In insulin tolerance (sensitivity) tests, human insulin (0.75 units/kg; Eli Lilly) was administered intraperitoneally to mice that had been fasted overnight for 12 h. To obtain an estimate of gluconeogenesis in vivo, pyruvate challenge tests (21) were performed in which mice deprived of food for 12 h were injected intraperitoneally with sodium pyruvate (2 mg/g; Sigma). To study the effect of glucagon on hepatic glucose production in vivo, mice were fasted for 12 h and then injected intraperitoneally with human glucagon (16 μg/kg) (22). Blood glucose levels were determined using blood obtained from the tail vein just prior to (0 min) and at specific time points (up to 120 min) after drug application.
Measurements of in vivo glucose kinetics and insulin clamp procedures.
Euglycemic clamps were performed in conscious, unrestrained, catheterized mice as previously described (23) (see supplemental Methods for details).
Body composition analysis.
Body composition was determined by magnetic resonance spectroscopy using an ECHO magnetic resonance spectroscopy instrument (Echo Medical Systems, Houston, TX).
Statistical analysis.
Data are expressed as means ± SE for the indicated number of observations. P values were calculated by using the appropriate t tests.
RESULTS
RT-PCR analysis of mAChR expression in mouse liver.
Our initial goal was to determine which mAChR subtypes are expressed in mouse liver (hepatocytes). To address this question, we subjected total RNA prepared from either whole liver or purified hepatocytes of wild-type mice (C57BL/6 background) to RT-PCR amplification using mouse M1–M5 mAChR–specific primers (see research design and methods for details). This analysis showed that only M3 receptor cDNA could be detected in samples from mouse liver and hepatocytes (Fig. 1A).
Generation of hepatocyte-specific M3 mAChR knockout mice.
To examine the physiological relevance of hepatocyte M3 mAChRs in vivo, we used Cre/loxP technology to generate mutant mice that selectively lacked this receptor subtype in hepatocytes (Fig. 1B–G) (for details, see research design and methods). After EIIa-Cre–mediated deletion of the neo gene (Fig. 1B–D), floxed M3 receptor mice in which the M3 receptor coding sequence was flanked by loxP sites (24) were crossed with AlbCre transgenic mice that selectively express Cre recombinase in hepatocytes (25). To generate mutant mice that were homozygous for the floxed M3 receptor allele and carried the AlbCre transgene (for the sake of simplicity, these mice are referred to as Hep-M3-KO mice in the following), we crossed M3 fl/+ mice with M3 fl/+ mice that were hemizygous for the AlbCre transgene. This mating strategy also produced three littermate control groups: fl/fl, +/+, and +/+ AlbCre mice (Fig. 1E).
PCR and Southern blotting studies confirmed that AlbCre-mediated deletion of the M3 receptor gene had occurred with high efficiency and selectivity in liver genomic DNA prepared from Hep-M3-KO mice (Fig. 1E and F). Real-time qRT-PCR studies indicated that hepatic M3 receptor mRNA levels were reduced by ∼75% in Hep-M3-KO mice, as compared with the corresponding levels found with floxed control mice (Fig. 1G). Similar results were obtained when liver mAChRs were labeled with [3H]NMS, a non–subtype-selective muscarinic antagonist (data not shown). In contrast, M3 receptor mRNA expression was comparable between Hep-M3-KO mice and control littermates in other tissues (brain, ileum, or submandibular gland), where M3 receptors are known to be expressed at physiologically relevant levels (15,16) (Fig. 1G). The small population of hepatic M3 mAChRs/transcripts remaining in Hep-M3-KO mice may be due to residual M3 receptor expression in nonhepatocyte liver cells (note that ∼85% of liver cells represent hepatocytes).
All mice were born at the expected Mendelian frequency, and the body weight of the Hep-M3-KO mice did not differ significantly from that of the three control groups (data not shown). Moreover, Hep-M3-KO mice were fertile and showed no obvious developmental, behavioral, or morphological deficits. Hep-M3-KO mice and their control littermates showed similar serum levels in hepatic enzymes, cholesterol, albumin, total protein, and uric acid (supplemental Table 2), suggesting that overall liver function was not affected by the lack of hepatocyte M3 receptors. Similarly, the lack of hepatic M3 receptors had no obvious effects on liver histology in hematoxylin and eosin, oil red O, or PAS staining studies (data not shown).
The lack of hepatic M3 receptors has little or no obvious metabolic consequences in vivo.
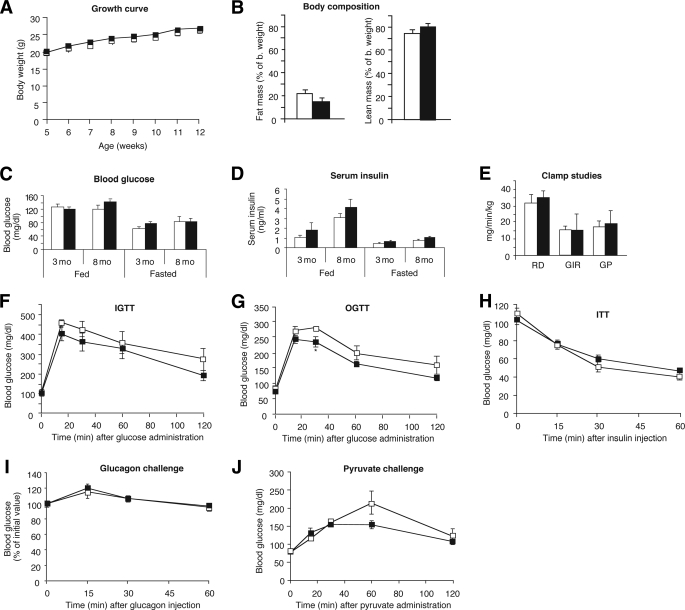
We initially conducted a series of metabolic studies using Hep-M3-KO mice and control littermates (M3 fl/fl mice) maintained on regular mouse diet. The two mouse strains did not show any significant differences in body weight and composition (Fig. 2A and B), as well as fed and fasting blood glucose and serum insulin levels (measured in 3- and 8-month-old males) (Fig. 2C and D).
FIG. 2.
Physiological analysis of Hep-M3-KO mice (■) and control littermates (□) maintained on regular diet. A: Growth curves of male mice. B: Body composition (4-month-old males; control, n = 9; Hep-M3-KO, n = 6). C: Fed and fasting blood glucose. D: Serum insulin levels of Hep-M3-KO mice and control littermates. Blood samples were taken from freely fed mice or from mice that had been fasted for 12 h (3- and 8-month-old males; n = 7–9 per group). E: Insulin clamp studies. Rates of glucose uptake (RD, glucose disposal), GIR, and endogenous glucose production (GP) are indicated (4-month-old males; n = 3 per group). F: Blood glucose levels following intraperitoneal administration of 2 mg/g of glucose (IGTT; 16-week-old males, n = 6 per group). G: Blood glucose levels following oral administration of 2 mg/g of glucose (OGTT; 20-week-old males, n = 6 per group). H: Insulin tolerance test (ITT). Blood glucose levels were measured at the indicated time points after intraperitoneal injection of 0.75 units/kg of insulin (18-week-old males, n = 6 per group). I: Glucagon tolerance test. Blood glucose levels were measured at the indicated time points after intraperitoneal injection of 16 μg/kg of glucagon (18-week-old males, n = 6 per group). J: Pyruvate challenge test. Blood glucose levels were measured at the indicated time points after intraperitoneal injection of 2 mg/g of sodium pyruvate (22-week-old males, n = 6 per group). *P < 0.05 vs. control.
To investigate whether the Hep-M3-KO mice exhibited changes in glucose tolerance, we carried out OGTTs and IGTTs (glucose dose: 2 mg/g body wt). In both tests, Hep-M3-KO mice and their control littermates displayed similar increases in blood glucose levels throughout the entire 2-h observation period (Fig. 2F and G), except for a slight decrease in glucose levels in Hep-M3-KO mice in the OGTT at the 30-min time point. Similarly, both groups of mice showed comparable decreases in blood glucose levels in an insulin tolerance test (insulin dose: 0.75 units/kg i.p.) (Fig. 2H).
To reveal potential differences in hepatic glucose production in vivo, we injected Hep-M3-KO mice and control littermates with glucagon (16 μg/kg i.p.) and monitored changes in blood glucose levels for a 1-h period (22). The main action of glucagon is to stimulate hepatic glucose production by increasing glycogenolysis and gluconeogenesis while inhibiting glycogen synthesis (26). Figure 2I clearly shows that Hep-M3-KO mice and control littermates displayed identical increases in blood glucose levels in this glucagon challenge test.
To examine whether the lack of hepatic M3 receptors affected gluconeogenesis in vivo, we injected Hep-M3-KO mice and control littermates with the gluconeogenic substrate pyruvate (2 mg/g i.p.) and monitored changes in blood glucose levels over a 2-h period (pyruvate challenge test) (21). We found that the observed increases in blood glucose levels did not differ significantly between the two groups of mice (Fig. 2J).
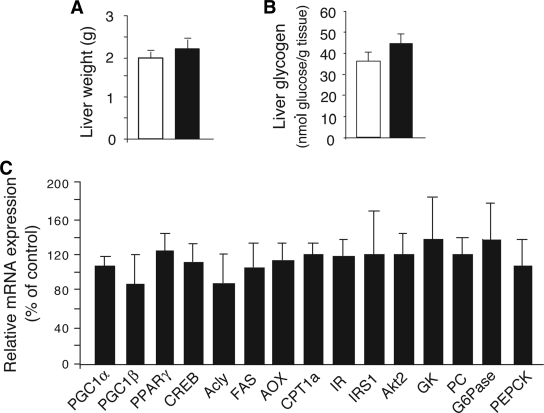
To further examine whether the lack of hepatocyte M3 receptors affected glucose fluxes in vivo, we carried out insulin clamp studies using Hep-M3-KO mice and control littermates maintained on standard diet (4-month-old males). The glucose infusion rate (GIR) was adjusted in order to maintain blood glucose concentrations in both groups of mice at similar levels (8 mmol/l), while insulin was infused at a rate of 3.6 mU · kg−1 · min−1 to generate a physiological increase in plasma insulin levels (∼8 ng/ml). All measurements were performed during the final 40 min of the 90-min clamp procedure, after steady-state conditions for plasma glucose and insulin concentrations, glucose-specific activity, and rates of glucose infusion were achieved. The GIR required to prevent the mice from developing hypoglycemia was not significantly different between Hep-M3-KO mice and control littermates (Fig. 2E). Similarly, the rate of glucose disappearance (Rd) and the rate of endogenous glucose production (net increase in glucosyl units derived from gluconeogenesis and glycogenolysis) did not differ significantly between the two mouse strains (Fig. 2E). Liver weight and liver glycogen content did not differ significantly between freely fed Hep-M3-KO mice and their control littermates (Fig. 3A and B).
FIG. 3.
Liver weight, glycogen content, and gene expression analysis of Hep-M3-KO mice (■) and control littermates (□) maintained on regular diet. A: Liver weight. B: Liver glycogen content of Hep-M3-KO mice and control littermates (freely fed 8-month-old males, n = 6 per group). C: Liver gene expression analysis. Gene expression was studied by real-time qRT-PCR using total hepatic RNA prepared from Hep-M3-KO mice and control littermates (freely fed 3-month-old males). Data from three independent experiments were normalized relative to the expression of cyclophilin A, which served as an internal control. Results are presented as percent change in gene expression in Hep-M3-KO mice relative to control littermates (100%). Acly, ATP citrate lyase; AOX, acyl-CoA oxidase; CPT, carnitine palmitoyltransferase; CREB, cAMP-response element binding protein; FAS, fatty acid synthase; GK, glucokinase; IR, insulin receptor; IRS1, IR substrate 1; PC, pyruvate carboxylase; PGC, PPAR coactivator; PPAR, peroxisome proliferator–activated receptor.
Liver gene expression analysis in Hep-M3-KO mice.
We next used real-time qRT-PCR to study whether the expression of genes for various key transcription factors, signaling molecules, and enzymes regulating hepatic glucose fluxes and other metabolic functions were altered in Hep-M3-KO mice (freely fed). The genes studied included those coding for phosphoenolpyruvate carboxykinase (PEPCK) and glucose-6-phosphatase (G6Pase), the two key enzymes regulating the rate of gluconeogenesis. This analysis did not reveal any significant differences in liver gene expression levels between Hep-M3-KO mice and control littermates (Fig. 3C).
Physiological studies with Hep-M3-KO mice maintained on a high-fat diet.
Several studies have shown that the consumption of a high-fat diet triggers an increase in the activity of the parasympathetic nervous system in mice (27,28). We therefore speculated that the resulting increase in ACh release from peripheral parasympathetic nerves may lead to enhanced signaling through hepatic M3 mAChRs, potentially unmasking a critical metabolic role for these receptors in Hep-M3-KO mice.
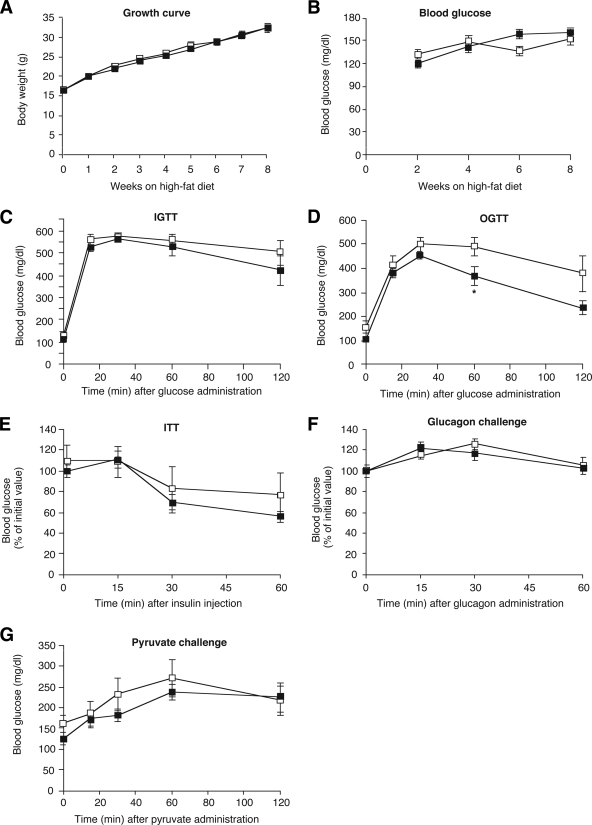
Specifically, Hep-M3-KO mice and their control littermates (5-week-old males) were fed a high-fat diet (fat content: 35.5%, wt/wt) and then monitored for an 8-week period. As expected, the consumption of the high-fat diet triggered rapid weight gain (Fig. 4A), hyperglycemia (Fig. 4B), impaired glucose tolerance (IGTT, Fig. 4C; OGTT, Fig. 4D), and insulin resistance (Fig. 4E) in the control mice. Interestingly, Hep-M3-KO mice showed very similar metabolic deficits in all of these tests (Fig. 4A–E), except for a slight reduction in blood glucose levels in the OGTT at the 60-min time point (Fig. 4D). Hep-M3-KO mice and their control littermates also showed very similar increases in blood glucose levels in the glucagon and pyruvate challenge tests (Fig. 4F and G).
FIG. 4.
Physiological analysis of Hep-M3-KO mice (■) and control littermates (□) maintained on a high-fat diet. A: Growth curves. B: Fed blood glucose levels of male mice maintained on a high-fat diet (n = 7–9 per group). C: Blood glucose levels following intraperitoneal administration of 2 mg/g of glucose (IGTT; 16-week-old males, n = 6 per group). D: Blood glucose levels following oral administration of 2 mg/g of glucose (OGTT; 20-week-old males, n = 6 per group). E: Insulin tolerance test (ITT). Blood glucose levels were measured at the indicated time points after intraperitoneal injection of 0.75 units/kg of insulin (18-week-old males, n = 6 per group). F: Glucagon tolerance test. Blood glucose levels were measured at the indicated time points after intraperitoneal injection of 16 μg/kg of glucagon (18-week-old males, n = 6 per group). G: Pyruvate challenge test. Blood glucose levels were measured at the indicated time points after intraperitoneal injection of 2 mg/g of sodium pyruvate (22-week-old males, n = 6 per group). *P < 0.05 vs. control.
Generation of transgenic mice selectively overexpressing M3 mAChRs in hepatocytes.
To examine the possible metabolic consequences of enhanced signaling through hepatic M3 mAChRs, we generated transgenic mice that selectively overexpressed this receptor subtype in hepatocytes. To ensure that M3 receptors were selectively expressed by hepatocytes, transgene expression was placed under the control of the mouse albumin promoter/enhancer (29). By using standard transgenic techniques (see research design and methods), we obtained several mutant mouse lines that had stably incorporated the M3 receptor transgene into their genomes.
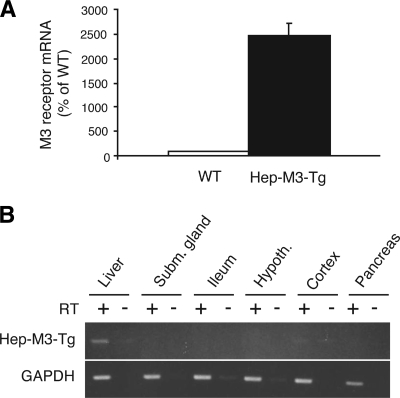
To quantitate the number of M3 receptors overexpressed in hepatocytes of the different transgenic lines, we incubated mouse liver membranes with a saturating concentration (2 nmol/l) of the muscarinic antagonist, [3H]NMS. Control experiments with wild-type littermates showed that endogenous liver mAChRs were expressed at a density of 15.3 ± 4.0 fmol/mg membrane protein (n = 3; 3-month-old males). Interestingly, one of the analyzed transgenic lines, referred to as Hep-M3-Tg in the following, showed a pronounced (approximately fourfold) increase in hepatic mAChR density (61.6 ± 2.4 fmol/mg membrane protein; n = 3; 3-month-old males). Consistent with these results, qRT-PCR studies demonstrated that Hep-M3-Tg mice displayed a striking increase in hepatic M3 receptor mRNA expression levels compared with wild-type littermates (Fig. 5A). RT-PCR studies using total RNA prepared from several peripheral and central tissues confirmed that the M3 receptor transgene was selectively expressed in the liver of Hep-M3-Tg mice (Fig. 5B). For these reasons, the Hep-M3-Tg mouse line was selected and amplified for more detailed physiological studies.
FIG. 5.
Liver-specific overexpression of M3 mAChRs in Hep-M3-Tg mice. A: Real-time qRT-PCR analysis of M3 receptor mRNA expression in the liver of Hep-M3-Tg and wild-type (WT) control mice. qRT-PCR experiments were carried out with mouse liver cDNA as described under supplemental Methods, using a primer pair that amplifies both the M3 receptor transgene and native M3 receptor transcripts (supplemental Table 1; n = 5 per group; mouse age 12 weeks). The mRNA expression levels displayed by liver samples prepared from WT mice were set equal to 100%. B: RT-PCR analysis of M3 mAChR transgene expression in different tissues from Hep-M3-Tg mice. RT-PCR experiments were performed as described under supplemental Methods using an M3 receptor transgene-specific primer pair (size of the PCR product: 405 bp). As expected, transgene expression was found to be liver specific. Control samples (indicated by the minus signs above the lanes) that had not been treated with reverse transcriptase (RT) did not give any detectable signal, confirming the absence of contaminating genomic DNA. Hypoth., hypothalamus; Subm., submandibular.
Overexpression of hepatic M3 receptors has no significant metabolic effects in vivo.
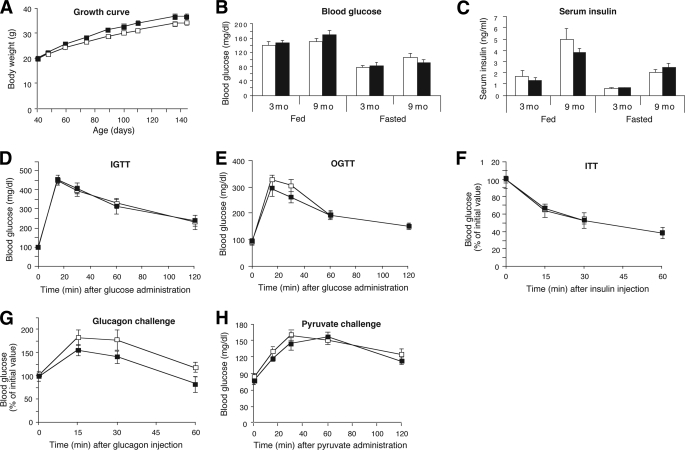
Hep-M3-Tg mice were subjected to the same set of physiological studies as Hep-M3-KO mice (see above). Hep-M3-Tg mice appeared healthy and showed no obvious behavioral or morphological abnormalities. Moreover, the body weight of Hep-M3-Tg mice maintained on regular mouse chow did not differ significantly from that of their wild-type littermates (Fig. 6A).
FIG. 6.
Physiological analysis of Hep-M3-Tg mice (■) and wild-type (WT) littermates (□) maintained on regular diet. A: Growth curves of male mice. B: Fed and fasting blood glucose. C: Serum insulin levels of Hep-M3-Tg and WT control mice maintained on regular diet. Blood samples were taken from freely fed mice or from mice that had been fasted for 15 h (3- and 9-month-old males; n = 7–9 per group). Hep-M3-Tg mice (■) and WT control littermates (□). D: Blood glucose levels following intraperitoneal administration of 2 mg/g of glucose (IGTT; 16-week-old males, n = 6 per group). E: Blood glucose following oral administration of 2 mg/g of glucose (OGTT; 20-week-old males, n = 6 per group). F: Insulin tolerance test (ITT). Blood glucose levels were measured at the indicated time points after intraperitoneal injection of 0.75 units/kg of insulin (16-week-old males, n = 7 per group). G: Glucagon tolerance test. Blood glucose levels were measured at the indicated time points after intraperitoneal injection of 16 μg/kg of glucagon (20-week-old males, n = 7 per group). H: Pyruvate challenge test. Blood glucose levels were measured at the indicated time points after intraperitoneal injection of 2 mg/g of sodium pyruvate (18-week-old males, n = 7 per group). Hep-M3-Tg mice (■) and WT littermates (□).
Hep-M3-Tg and wild-type control mice consuming regular mouse diet showed similar fed and fasting blood glucose and serum insulin levels (measured in 3- and 9-month-old males) (Fig. 6B and C). Moreover, in both OGTTs and IGTTs (glucose dose: 2 mg/g body wt), Hep-M3-Tg and wild-type control mice exhibited similar changes in blood glucose levels throughout the entire 2-h observation period (16- to 18-week-old males; Fig. 6D and E). Likewise, Hep-M3-Tg and wild-type control mice displayed comparable glucose responses in insulin, glucagon, and pyruvate tolerance/challenge tests (16- to 20-week-old males) (Fig. 6F–H).
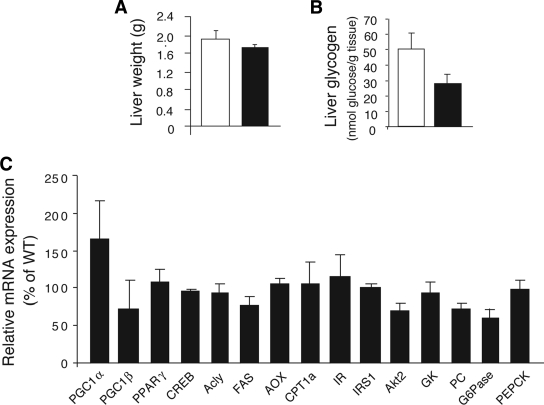
As shown in Fig. 7A and B, liver weight and liver glycogen content did not differ significantly between Hep-M3-Tg mice and their wild-type littermates (freely fed). Moreover, real-time qRT-PCR studies did not reveal any significant differences in liver gene expression levels between freely fed Hep-M3-Tg mice and wild-type littermates (Fig. 7C).
FIG. 7.
Liver weight, glycogen content, and gene expression analysis of Hep-M3-Tg mice (■) and wild-type (WT) control mice (□) maintained on a regular diet. A: Liver weight. B: Liver glycogen content of Hep-M3-Tg mice and control littermates (freely fed 8-month-old males, n = 6 per group). C: Liver gene expression analysis. Gene expression was studied by real-time qRT-PCR using total hepatic RNA prepared from Hep-M3-Tg mice and WT littermates (freely fed 3-month-old males). Data from three independent experiments were normalized relative to the expression of cyclophilin A, which served as an internal control. Results are presented as percent change in gene expression in Hep-M3-Tg mice relative to WT control mice (100%). For full gene names, see the legend to Fig. 3.
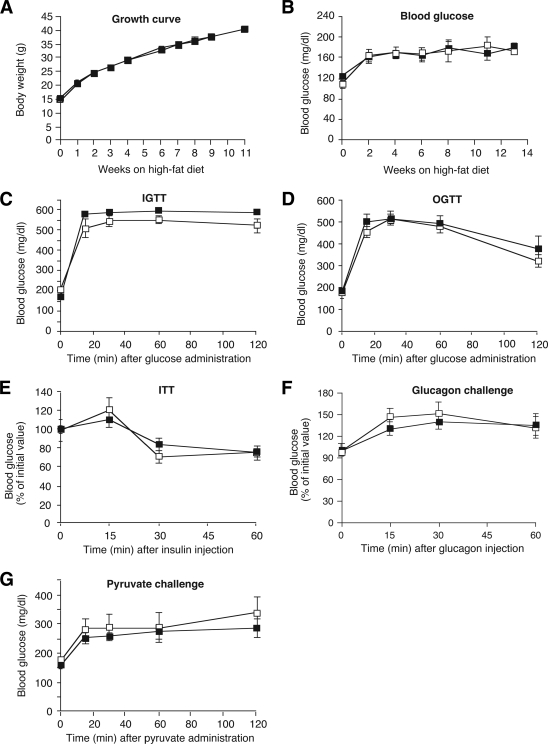
To examine whether overexpression of hepatic M3 receptors had any effect on the metabolic deficits associated with the chronic consumption of a high-fat diet, Hep-M3-Tg mice and their control littermates (5-week-old males) were fed a high-fat diet (fat content: 35.5%, wt/wt) and then monitored for a 14-week period. Wild-type littermates maintained on the high-fat diet showed rapid weight gain (Fig. 8A), hyperglycemia (Fig. 8B), impaired glucose tolerance (IGTT, Fig. 8C; OGTT, Fig. 8D), and insulin resistance (Fig. 8E). In all of these tests, Hep-M3-Tg mice displayed metabolic phenotypes that were not significantly different from those observed with the wild-type control mice (Fig. 8A–E). Hep-M3-Tg mice and their wild-type littermates also exhibited virtually identical glucose responses in the glucagon and pyruvate challenge tests (Fig. 8F and G).
FIG. 8.
Physiological analysis of Hep-M3-Tg mice (■) and wild-type (WT) littermates (□) maintained on a high-fat diet. A: Growth curves. B: Fed blood glucose levels of male mice maintained on a high-fat diet (n = 7–9 per group). C: Blood glucose levels following intraperitoneal administration of 2 mg/g of glucose (IGTT; 16-week-old males, n = 6 per group). D: Blood glucose levels following oral administration of 2 mg/g of glucose (OGTT); 18-week-old males, n = 6 per group). E: Insulin tolerance test (ITT). Blood glucose levels were measured at the indicated time points after intraperitoneal injection of 0.75 units/kg of insulin (20-week-old males, n = 7 per group). F: Glucagon tolerance test. Blood glucose levels were measured at the indicated time points after intraperitoneal injection of 16 μg/kg of glucagon (22-week-old males, n = 7 per group). G: Pyruvate challenge test. Blood glucose levels were measured at the indicated time points after intraperitoneal injection of 2 mg/g of sodium pyruvate (14-week-old males, n = 7 per group).
Additional hormone and hepatic Erk measurements in Hep-M3-KO and Hep-M3-Tg mutant mice and control littermates.
To examine whether glucose-dependent insulin release was altered by the lack or overexpression of hepatic M3 receptors, fasted Hep-M3-KO and Hep-M3-Tg mutant mice and their corresponding control littermates received an oral glucose load (2 mg/g; 18- to 20-week-old males). For these studies, we used mice maintained on either regular or a high-fat diet. Serum insulin levels were monitored 15, 30, 60, and 120 min after glucose administration. This analysis showed that glucose-induced insulin release was not significantly affected by the lack or overexpression of hepatic M3 receptors (supplemental Fig. 1).
To exclude the possibility that the activity of the sympathetic nervous system was altered in the M3 receptor mutant mice, we measured serum norepinephrine and epinephrine levels in Hep-M3-KO and Hep-M3-Tg mutant mice and control littermates (freely fed 2-month-old males). We found that serum norepinephrine and epinephrine levels did not differ significantly between M3 receptor mutant mice and their corresponding control mice (supplemental Table 3).
We also found that the serum levels of corticosterone and glucagon, two of the key hormones counteracting the glucose-lowering effects of insulin, did not differ significantly between M3 receptor mutant mice and their corresponding control mice (freely fed 2-month-old males; supplemental Table 3).
A recent study demonstrated that hepatic stimulation of Erk led to the activation of a relay of neuronal pathways resulting in increased pancreatic β-cell proliferation and enhanced glucose-induced insulin secretion (30). We therefore examined whether Erk phosphorylation was altered in the livers of Hep-M3-KO and Hep-M3-Tg mutant mice (freely fed 2-month-old males). However, Western blotting experiments demonstrated that the M3 receptor mutant mice did not show any significant changes in hepatic Erk phosphorylation compared with their corresponding control littermates (supplemental Fig. 2).
Lack of M3 receptor expression in Kupffer cells.
To examine whether M3 receptors were expressed by nonparenchymal liver cells, we used RT-PCR to study M3 receptor expression in Kupffer cells prepared from adult wild-type mice (C57BL/6 mice). This analysis failed to detect M3 receptor mRNA in mouse Kupffer cells (supplemental Fig. 3). On the other hand, F4/80 mRNA that codes for a Kupffer cell-specific glycoprotein was readily detectable in both Kupffer cell preparations used (supplemental Fig. 3).
DISCUSSION
ACh, the major neurotransmitter released from efferent vagal nerve endings, mediates its physiological actions via stimulation of distinct mAChR subtypes (15,16). Recent studies (11–14) suggest that the activity of efferent hepatic vagal nerves is critical for maintaining normal glucose homeostasis.
In this study, we found that the M3 mAChR is the only mAChR subtype expressed by mouse liver or hepatocytes, consistent with a previous study examining the pattern of mAChR subtype expression in rat hepatocytes (10). To examine the potential metabolic relevance of hepatocyte M3 mAChRs, we used Cre/loxP technology to generate mutant mice lacking M3 receptors in hepatocytes only (Hep-M3-KO mice). In parallel, we also generated and analyzed transgenic mice that overexpressed M3 mAChRs selectively in hepatocytes (Hep-M3-Tg mice). Surprisingly, detailed in vivo phenotyping studies failed to detect any significant metabolic differences between Hep-M3-KO or Hep-M3-Tg mice and their control littermates. Consistent with this observation, qRT-PCR studies showed that the lack or overexpression of hepatic M3 mAChRs had no significant effect on the hepatic expression of PEPCK and G6Pase, the two key enzymes regulating the rate of gluconeogenesis, and of various key transcription factors, signaling molecules, and enzymes regulating hepatic glucose fluxes. Similarly, euglycemic-hyperinsulinemic clamp studies did not reveal any significant differences in glucose fluxes between Hep-M3-KO mice and their control littermates. Thus, the presence of hepatocyte M3 receptors is not required for the ability of insulin to suppress hepatic glucose production.
The consumption of a high-fat diet is known to trigger an increase in the activity of the parasympathetic nervous system in mice (27,28). Moreover, the intake of a high-fat diet usually leads to increased levels of plasma lipids and insulin, due to rapid development of insulin resistance. As discussed above, accumulating evidence indicates that increased plasma lipid and insulin levels are monitored in the mediobasal hypothalamus (11–13), triggering an increase in vagal outflow to the liver, followed by inhibition of hepatic glucose production and lowering of blood glucose levels. We therefore speculated that changes in the activity of hepatic M3 mAChRs might lead to altered glucose homeostasis in Hep-M3-KO or Hep-M3-Tg mice. For example, since the M3 mAChR is the only mAChR subtype detectable in mouse hepatocytes, we hypothesized that enhanced signaling through hepatic M3 mAChRs in Hep-M3-Tg mice would be associated with beneficial effects on whole-body glucose homeostasis, due to inhibition of hepatic glucose production. However, a series of in vivo studies carried out with Hep-M3-KO and Hep-M3-Tg mice maintained on a high-fat diet showed that the M3 receptor mutant mice and their control littermates showed quantitatively similar metabolic deficits, including increased blood glucose levels, impaired glucose tolerance, and insulin resistance. Taken together, these observations lead to the surprising conclusion that hepatocyte (M3) mAChRs do not play a critical role in maintaining proper glucose homeostasis in vivo.
Consistent with the in vivo results discussed above, incubation of primary mouse or rat hepatocytes with ACh or the hydrolytically stable ACh derivative, carbachol, had no significant effect on glucose production in vitro (C.B., unpublished data). One possible explanation for our findings is that other neurotransmitters or neuromodulators, which are coreleased with ACh following vagal stimulation, are responsible for the vagus-mediated suppression of hepatic glucose production. For example, several neuropeptides, including vasoactive intestinal polypeptide, gastrin-releasing peptide, and pituitary adenylate cyclase–activating peptide, as well as nitric oxide (NO), are known to be coreleased with ACh from peripheral parasympathetic nerve endings (27,28). Interestingly, Horton et al. (31) previously demonstrated that NO exerts a strong inhibitory effect on hepatic gluconeogenesis in isolated rat hepatocytes.
Another possibility is that ACh, following its release from hepatic vagal nerve endings, does not act primarily on hepatocytes but on nonparenchymal cells like Kupffer or hepatic stellate cells that subsequently cause the release of one or more other signaling molecules such as prostaglandins (32) or cytokines (33) that affect hepatocyte function in a paracrine fashion. Interestingly, a recent study (34) showed that activation of central insulin receptors results in the release of interleukin-6 (IL-6) from nonparenchymal liver cells resembling Kupffer cells, most likely due to stimulation of efferent hepatic nerves. In addition, the authors demonstrated that the paracrine release of IL-6 triggered the activation of STAT3, leading to the suppression of hepatic glucose production (34). However, we showed in the present study that mouse Kupffer cells do not express M3 receptors, excluding the possibility that mAChRs play a role in insulin-induced hepatic IL-6 release.
In conclusion, our data convincingly demonstrate that hepatic mAChRs do not play a critical role in maintaining proper glucose homeostasis in mice. Since the activity of efferent hepatic vagal nerves is predicted to be critically involved in maintaining normal blood glucose levels (11–14), the identification of other (nonmuscarinic) hepatic signaling pathways that are under vagal control may lead to novel strategies to modulate hepatic glucose fluxes for therapeutic purposes.
Supplementary Material
Acknowledgments
This work was supported by the Intramural Research Program of the National Institute of Diabetes and Digestive and Kidney Diseases (NIDDK), National Institutes of Health (NIH), U.S. Department of Health and Human Services. C.B. was supported by DK074873 and DK082724 and a junior faculty award from the American Diabetes Association.
No potential conflicts of interest relevant to this article were reported.
The pGEMAlb-SVPA vector was provided by Dr. Jake Liang (NIH/NIDDK). We thank Lei Wang and Dr. Bin Gao (NIH/National Institute on Alcohol Abuse and Alcoholism [NIAAA]) for their help with the hepatocyte isolation procedure and Drs. Ogyi Park and Bin Gao (NIH/NIAAA) for preparing the mouse Kupffer cells.
Footnotes
The costs of publication of this article were defrayed in part by the payment of page charges. This article must therefore be hereby marked “advertisement” in accordance with 18 U.S.C. Section 1734 solely to indicate this fact.
REFERENCES
- 1.Taylor SI: Deconstructing type 2 diabetes. Cell 1999; 97: 9– 12 [DOI] [PubMed] [Google Scholar]
- 2.Lautt WW: Afferent and efferent neural roles in liver function. Prog Neurobiol 1983; 21: 323– 348 [DOI] [PubMed] [Google Scholar]
- 3.Gardemann A, Jungermann K: Control of glucose balance in the perfused rat liver by the parasympathetic innervation. Biol Chem Hoppe Seyler 1986; 367: 559– 566 [DOI] [PubMed] [Google Scholar]
- 4.Matsuhisa M, Yamasaki Y, Shiba Y, Nakahara I, Kuroda A, Tomita T, Iida M, Ikeda M, Kajimoto Y, Kubota M, Hori M: Important role of the hepatic vagus nerve in glucose uptake and production by the liver. Metabolism 2000; 49: 11– 16 [DOI] [PubMed] [Google Scholar]
- 5.Shimazu T, Fujimoto T: Regulation of glycogen metabolism in liver by the autonomic nervous system: IV. Neural control of glycogen biosynthesis. Biochim Biophys Acta 1971; 252: 18– 27 [DOI] [PubMed] [Google Scholar]
- 6.Xue C, Aspelund G, Sritharan KC, Wang JP, Slezak LA, Andersen DK: Isolated hepatic cholinergic denervation impairs glucose and glycogen metabolism. J Surg Res 2000; 90: 19– 25 [DOI] [PubMed] [Google Scholar]
- 7.Stümpel F, Jungermann K: Sensing by intrahepatic muscarinic nerves of a portal-arterial glucose concentration gradient as a signal for insulin-dependent glucose uptake in the perfused rat liver. FEBS Lett 1997; 406: 119– 122 [DOI] [PubMed] [Google Scholar]
- 8.Shiota M, Jackson P, Galassetti P, Scott M, Neal DW, Cherrington AD: Combined intraportal infusion of acetylcholine and adrenergic blockers augments net hepatic glucose uptake. Am J Physiol Endocrinol Metab 2000; 278: E544– E552 [DOI] [PubMed] [Google Scholar]
- 9.Akpan JO, Gardner R, Wagle SR: Studies on the effects of insulin and acetylcholine on activation of glycogen synthase and on glycogenesis in hepatocytes. Biochem Biophys Res Commun 1974; 61: 222– 229 [DOI] [PubMed] [Google Scholar]
- 10.Vatamaniuk MZ, Horyn OV, Vatamaniuk OK, Doliba NM: Acetylcholine affects rat liver metabolism via type 3 muscarinic receptors in hepatocytes. Life Sci 2003; 72: 1871– 1882 [DOI] [PubMed] [Google Scholar]
- 11.Pocai A, Obici S, Schwartz GJ, Rossetti L: A brain-liver circuit regulates glucose homeostasis. Cell Metab 2005; 1: 53– 61 [DOI] [PubMed] [Google Scholar]
- 12.Pocai A, Lam TK, Gutierrez-Juarez R, Obici S, Schwartz GJ, Bryan J, Aguilar-Bryan L, Rossetti L: Hypothalamic KATP channels control hepatic glucose production. Nature 2005; 434: 1026– 1031 [DOI] [PubMed] [Google Scholar]
- 13.Lam TK, Pocai A, Gutierrez-Juarez R, Obici S, Bryan J, Aguilar-Bryan L, Schwartz GJ, Rossetti L: Hypothalamic sensing of circulating fatty acids is required for glucose homeostasis. Nat Med 2005; 11: 320– 327 [DOI] [PubMed] [Google Scholar]
- 14.Wang PY, Caspi L, Lam CK, Chari M, Li X, Light PE, Gutierrez-Juarez R, Ang M, Schwartz GJ, Lam TK: Upper intestinal lipids trigger a gut-brain-liver axis to regulate glucose production. Nature 2008; 452: 1012– 1016 [DOI] [PubMed] [Google Scholar]
- 15.Caulfield MP, Birdsall NJ: International Union of Pharmacology: XVII. classification of muscarinic acetylcholine receptors. Pharmacol Rev 1998; 50: 279– 290 [PubMed] [Google Scholar]
- 16.Wess J, Eglen RM, Gautam D: Muscarinic acetylcholine receptors: mutant mice provide new insights for drug development. Nat Rev Drug Discov 2007; 6: 721– 733 [DOI] [PubMed] [Google Scholar]
- 17.Jaruga B, Hong F, Kim WH, Gao B: IFN-γ/STAT1 acts as a proinflammatory signal in T cell-mediated hepatitis via induction of multiple chemokines and adhesion molecules: a critical role of IRF-1. Am J Physiol Gastrointest Liver Physiol 2004; 287: G1044– G1052 [DOI] [PubMed] [Google Scholar]
- 18.Horiguchi N, Wang L, Mukhopadhyay P, Park O, Jeong WI, Lafdil F, Osei-Hyiaman D, Moh A, Fu XY, Pacher P, Kunos G, Gao B: Cell type-dependent pro- and anti-inflammatory role of signal transducer and activator of transcription 3 in alcoholic liver injury. Gastroenterology 2008; 134: 1148– 1158 [DOI] [PMC free article] [PubMed] [Google Scholar]
- 19.Duttaroy A, Zimliki CL, Gautam D, Cui Y, Mears D, Wess J: Muscarinic stimulation of pancreatic insulin and glucagon release is abolished in M3 muscarinic acetylcholine receptor-deficient mice. Diabetes 2004; 53: 1714– 1720 [DOI] [PubMed] [Google Scholar]
- 20.Li JH, Han SJ, Hamdan FF, Kim SK, Jacobson KA, Bloodworth LM, Zhang X, Wess J: Distinct structural changes in a G protein-coupled receptor caused by different classes of agonist ligands. J Biol Chem 2007; 282: 26284– 26293 [DOI] [PubMed] [Google Scholar]
- 21.Banerjee RR, Rangwala SM, Shapiro JS, Rich AS, Rhoades B, Qi Y, Wang J, Rajala MW, Pocai A, Scherer PE, Steppan CM, Ahima RS, Obici S, Rossetti L, Lazar MA: Regulation of fasted blood glucose by resistin. Science 2004; 303: 1195– 1198 [DOI] [PubMed] [Google Scholar]
- 22.Gelling RW, Du XQ, Dichmann DS, Romer J, Huang H, Cui L, Obici S, Tang B, Holst JJ, Fledelius C, Johansen PB, Rossetti L, Jelicks LA, Serup P, Nishimura E, Charron MJ: Lower blood glucose, hyperglucagonemia, and pancreatic alpha cell hyperplasia in glucagon receptor knockout mice. Proc Natl Acad Sci U S A 2003; 100: 1438– 1443 [DOI] [PMC free article] [PubMed] [Google Scholar]
- 23.Rossetti L, Stenbit AE, Chen W, Hu M, Barzilai N, Katz EB, Charron MJ: Peripheral but not hepatic insulin resistance in mice with one disrupted allele of the glucose transporter type 4 (GLUT4) gene. J Clin Invest 1997; 100: 1831– 1839 [DOI] [PMC free article] [PubMed] [Google Scholar]
- 24.Gautam D, Han SJ, Hamdan FF, Jeon J, Li B, Li JH, Cui Y, Mears D, Lu H, Deng C, Heard T, Wess J: A critical role for β cell M3 muscarinic acetylcholine receptors in regulating insulin release and blood glucose homeostasis in vivo. Cell Metab 2006; 3: 449– 461 [DOI] [PubMed] [Google Scholar]
- 25.Postic C, Shiota M, Niswender KD, Jetton TL, Chen Y, Moates JM, Shelton KD, Lindner J, Cherrington AD, Magnuson MA: Dual roles for glucokinase in glucose homeostasis as determined by liver and pancreatic β cell-specific gene knock-outs using Cre recombinase. J Biol Chem 1999; 274: 305– 315 [DOI] [PubMed] [Google Scholar]
- 26.Lefebvre PJ: Glucagon and its family revisited. Diabetes Care 1995; 18: 715– 730 [DOI] [PubMed] [Google Scholar]
- 27.Ahren B: Autonomic regulation of islet hormone secretion: implications for health and disease. Diabetologia 2000; 43: 393– 410 [DOI] [PubMed] [Google Scholar]
- 28.Gilon P, Henquin JC: Mechanisms and physiological significance of the cholinergic control of pancreatic β-cell function. Endocr Rev 2001; 22: 565– 604 [DOI] [PubMed] [Google Scholar]
- 29.Kawamura T, Furusaka A, Koziel MJ, Chung RT, Wang TC, Schmidt EV, Liang TJ: Transgenic expression of hepatitis C virus structural proteins in the mouse. Hepatology 1997; 25: 1014– 1021 [DOI] [PubMed] [Google Scholar]
- 30.Imai J, Katagiri H, Yamada T, Ishigaki Y, Suzuki T, Kudo H, Uno K, Hasegawa Y, Gao J, Kaneko K, Ishihara H, Niijima A, Nakazato M, Asano T, Minokoshi Y, Oka Y: Regulation of pancreatic β cell mass by neuronal signals from the liver. Science 2008; 322: 1250– 1254 [DOI] [PubMed] [Google Scholar]
- 31.Horton RA, Ceppi ED, Knowles RG, Titheradge MA: Inhibition of hepatic gluconeogenesis by nitric oxide: a comparison with endotoxic shock. Biochem J 1994; 299: 735– 739 [DOI] [PMC free article] [PubMed] [Google Scholar]
- 32.Kuiper J, Zijlstra FJ, Kamps JA, Van Berkel TJ: Cellular communication inside the liver: binding, conversion and metabolic effect of prostaglandin D2 on parenchymal liver cells. Biochem J 1989; 262: 195– 201 [DOI] [PMC free article] [PubMed] [Google Scholar]
- 33.Yerkovich ST, Rigby PJ, Fournier PA, Olynyk JK, Yeoh GC: Kupffer cell cytokines interleukin-1β and interleukin-10 combine to inhibit phosphoenolpyruvate carboxykinase and gluconeogenesis in cultured hepatocytes. Int J Biochem Cell Biol 2004; 36: 1462– 1472 [DOI] [PubMed] [Google Scholar]
- 34.Inoue H, Ogawa W, Asakawa A, Okamoto Y, Nishizawa A, Matsumoto M, Teshigawara K, Matsuki Y, Watanabe E, Hiramatsu R, Notohara K, Katayose K, Okamura H, Kahn CR, Noda T, Takeda K, Akira S, Inui A, Kasuga M: Role of hepatic STAT3 in brain-insulin action on hepatic glucose production. Cell Metab 2006; 3: 267– 275 [DOI] [PubMed] [Google Scholar]
Associated Data
This section collects any data citations, data availability statements, or supplementary materials included in this article.


