Abstract
Recoverin is a heterogeneously acylated calcium-binding protein thought to regulate visual transduction. Its effect on the photoresponse was investigated by dialyzing the recombinant protein into truncated salamander rod outer segments. At high Ca2+ (Ca), myristoylated recoverin (Ca-recoverin) prolonged the recovery phase of the bright flash response but had less effect on the dim flash response. The prolongation of recovery had an apparent Kd for Ca of 13 μM and a Hill coefficient of 2. The prolongation was shown to be mediated by inhibition of rhodopsin deactivation. After a sudden imposed drop in Ca concentration, the effect of recoverin switched off with little lag. The myristoyl (C14:0) modification of recoverin increased its activity 12-fold, and the C12:0 or C14:2 acyl group gave similar effects. These experiments support the notion that recoverin mediates Ca-dependent inhibition of rhodopsin phosphorylation and thereby controls light-triggered phosphodiesterase activity, particularly at high light levels.
Recoverin, a Ca2+ (Ca)-binding protein of retinal photoreceptors (1), belongs to a family of proteins found in the brain of vertebrates, neuromuscular junctions of Drosophila and Xenopus, and even yeast (for a review, see ref. 2). Recoverin contains four EF-hands, of which two bind Ca (3), and is heterogeneously acylated at its amino terminus (4, 5). Ca-induced extrusion of the acyl group from a hydrophobic cleft in the protein (6) drives the translocation of recoverin from solution to the disc membrane (7, 8). In vitro Ca-recoverin inhibits the phosphorylation of photoexcited rhodopsin (Rh*) (9–11), a key event in deactivation (12–15). The Ca-sensitivity of recoverin and the fall in free Ca concentration during the photoresponse (16–18) has led to the suggestion that it participates in recovery and/or light adaptation (19, 20).
When recoverin was infused into an intact rod outer segment from a patch pipette, the amplitude of the flash response increased and recovery slowed (21). To determine the locus of the effects of recoverin as well as their dependence on Ca concentration and acyl modification, we dialyzed the recombinant protein into single truncated rod outer segments.
MATERIALS AND METHODS
Electrical Recording.
Larval salamanders, Ambystoma tigrinum, were dark-adapted for at least 4 hr and killed under dim red light in accordance with a protocol approved by the Panel on Laboratory Animal Care at Stanford University. Retinas were isolated under infrared light and intact rods were dissociated by tearing the retina in a drop of Ringer containing (in mM) 110 NaCl, 1 CaCl2, 1.6 MgCl2, 2.5 KCl, and 10 Hepes (pH 7.6).
The outer segment of an intact rod was drawn into a suction electrode containing (in mM) 110 NaCl, 1.6 MgCl2, 10 Hepes, 1 EGTA, and 0.048 CaCl2 (free Ca ≈1.5 nM), (pH 7.6) and was truncated (14) in a solution containing (in mM) 105 Arg Glu, 10 Hepes, 3.01 MgCl2, 1 ATP, 0.01 GTP, 0.10 cGMP, and 1 1,2-bis(2-aminophenoxy)ethane-N,N,N′,N′-tetraacetic acid, bromo or fluoro derivative, and CaCl2 for final free Ca of 0.5 μM (pH 7.6; see below). Reagents were from Sigma unless otherwise noted. EGTA also was obtained as puriss. grade from Fluka.
Outer segment currents were measured by using an Axopatch-1A patch clamp amplifier (Axon Instruments, Foster City, CA). The recorded current was processed with an 8-pole Bessel low pass filter (−3 dB point at 10 Hz) and digitized in real time at 10 ms intervals by using pulse software (HEKA Electronics, Lambrecht Pfalz, Germany). The stimulating flashes (12 ms, 500 nm) were attenuated with neutral density filters; the light source was calibrated with a radiometer (268R, Graseby Optronics, Orlando, FL). Unless otherwise indicated, the flash strength was adjusted to produce responses that were just saturating in the absence of Ca-recoverin.
The dialyzing solution bathing the intracellular side of the outer segment was usually changed by an arrangement previously described (22). Alternatively, the solutions were delivered through individual 100-μm inner diameter microcapillary tubes (glued into a common outlet pipette) under positive pressure from compressed helium and changed by electronically operated pinch valves.
Digitized records of membrane current were analyzed by using igor software (WaveMetrics, Lake Oswego, OR) that used least squares optimization for curve fitting. Unless otherwise noted, numerical values are expressed as mean ± SEM. Most of the records were corrected for drift by fitting a straight line to the current before and/or after the light response and subtracting it from the entire record. An exponential was then fitted to the falling phase of the response to derive the time constant, τ. The prolongation factor used to quantify the effect of Ca-recoverin was: τCa-recoverin/τcontrol. The control τ was obtained from a preceding flash response with recoverin at low Ca (0.5 μM Ca for myristoylated or 0.03 μM Ca for unmyristoylated; ref. 3) or without recoverin at high Ca unless otherwise indicated. To ensure that Ca-recoverin was responsible for slowed recovery, a subsequent flash was delivered without Ca-recoverin, and if the slowing was not reversible, the results were ignored. Unless otherwise specified, the recoverin used in the experiments was myristoylated.
Phototransduction Dynamics in the Truncated Rod.
The time required for cGMP to diffuse into the truncated rod from the cut end was determined by observing the development of current following the introduction of 100 μM cGMP in the dialyzing solution. The final two-thirds of the rise in current was satisfactorily fitted with an exponential of time constant 3.0 ± 0.3 s (n = 9). This time constant was the same to within 6% at high and low Ca and in the presence or absence of nucleotides. As the half-saturating flash response recovered with a time constant, τ, of 4.7 ± 0.5 s (n = 5), the recovery kinetics were primarily determined by the rate of phosphodiesterase (PDE) deactivation rather than by diffusion of cGMP into the rod.
Control of Ca Concentration in the Truncated Rod.
In the intact cell, the intracellular level of Ca is established dynamically by influx through the cGMP-gated channels and efflux through the Na:Ca, K exchanger (reviewed in ref. 23). In the truncated rod, influx across the plasma membrane was effectively abolished by keeping free Ca in the suction electrode at <5 nM Ca. Surprisingly, we were unable to elicit Na:Ca, K exchanger activity in truncated rods. Thus, as Ca influx and exchanger activity were absent, the steady–state free Ca was set by the Ca buffer in the intracellular solution.
Measurement of Ca Concentration.
Free Ca in the intracellular solutions was measured by using Ca-selective electrodes: WPI’s Kwik tip (Sarasota, FL) or Orion’s Model 93–20 (Beverly, MA) with reference electrode 90–01. The electrode voltage was linear with the logarithm of free Ca concentration (≈28 mV/decade) down to 100 nM Ca. Individual measurements were reproducible to ≈8%. Calibration was performed with commercially available standards (CalBuf I, WPI Instruments) or our own standards. The latter were prepared by serial dilution of Ca standard (Orion) for pCa 1–4. For pCa 6–8, Ca-EGTA stocks were made by mixing stoichiometric Ca-EGTA stock, prepared as described (24), with EGTA stock to achieve the desired free Ca as calculated with the program bound-and-determined (25). Independent determination of free Ca by using Rhod-2 (Molecular Probes) fluorescence agreed well with the values obtained with the Ca electrode.
Preliminary experiments established that the effect of recoverin required Ca concentrations higher than those effectively buffered by EGTA. Consequently, lower affinity Ca buffers were used for intracellular solutions: 5,5′-dibromo-BAPTA (free acid, Fluka) or 4,4′-difluoro-BAPTA (K+ salt, Molecular Probes), which had Kds in our intracellular solutions of 1.9 and 3.1 μM Ca, respectively, as determined by Scatchard analysis of Ca titration results.
Free Ca in intracellular solutions was set by monitoring Ca with the Ca electrode while titrating with Ca standard. For experiments using 100 μM recoverin, the solution volume was too low to use the Ca electrode and the amount of Ca standard needed for a given free Ca level was determined by calculation. Measurement of free Ca in unused solutions agreed with the initial value within 15%, indicating that the buffer was stable. Addition of recoverin to 20 μM altered the free Ca level by ≤30%.
Recombinant Proteins.
Unmyristoylated, myristoylated (C14:0), and the C12:0- and C14:2-acylated recombinant recoverins were expressed in Escherichia coli by the method described (26, 27) or an adaptation. When the bacterial culture grown at 37° reached an OD660 of 0.3 absorbance units, 10 μg/ml (final concentration) myristic acid (C14:0), 10 μg/ml (cis-Δ5, cis-Δ8)-tetradecadienoic acid (C14:2) (Deva Biotech, Hatboro, PA), or 100 μg/ml C12:0 fatty acid was added. The C14:2 protein was purified on a 25 × 100 mm C18 Waters delta-pak preparative reverse phase column by using a gradient of 0–62% acetonitrile in 0.05% trifluoroacetic acid and followed by phenyl Sepharose chromatography after renaturation. The purity of the acylated recoverins was checked by analytical HPLC (4.6 × 150 mm Vydac C8 reverse phase column 208TP5415 run on a Hewlett–Packard 1050 series system) and/or liquid chromatography/mass spectrometry (API-III triple quadrupole mass spectrometer, PESciex, Thornhill, Ontario).
RESULTS
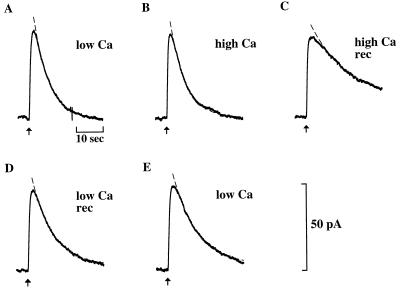
The effect of recoverin on the bright flash response is illustrated in Fig. 1. Before adding recoverin, the flash response was unaffected by raising the free Ca concentration from 0.5 “low” (Fig. 1A) to 20 μM “high” Ca (Fig. 1B). Addition of recoverin at high Ca (Fig. 1C) prolonged the recovery phase without affecting the rising phase or the dark current. At low Ca (Fig. 1D), recoverin had no effect, indicating that prolongation of recovery was Ca-dependent. Recovery gradually slowed during an experiment in the absence of recoverin (see Fig. 1 A and E), probably because of the slow loss of soluble proteins. This slowing was readily distinguishable from the effect of recoverin because it was irreversible and Ca-independent.
Figure 1.
Effect of Ca-recoverin on the flash response of a single truncated outer segment. Plots of membrane current as a function of time. Sequential responses to flashes (80 photons/μm2, delivered at times indicated by arrows) during dialysis with 0.5 μM Ca (A), 20 μM Ca (B), 20 μM Ca with 8.6 μM recoverin (C), 0.5 μM Ca with 8.6 μM recoverin (D), and 0.5 μM Ca only (E). Recovery phases were fitted by single exponentials (dashed lines) with time constants, τ, of (s): 6.0 (A and B); 21 (C); 8.8 (D); 11 (E). Response prolongation, defined as τhigh Ca-rec/τcontrol, was 3.5. The recoverin was myristoylated.
The time course of recovery of the photoresponse was assessed by fitting a single exponential (Figs. 1 and 2, dashed curves). In Fig. 1, the exponential time constant τ was 6 s in high Ca (Fig. 1B) and 21 s in Ca-recoverin (Fig. 1C). The ratio τCa-recoverin/τcontrol provided a useful index of prolongation. In this cell, the prolongation factor was 3.5. Ca-dependent prolongation by recoverin also was observed in 12 other cells. In 8.6 μM recoverin at high Ca, the prolongation factor was 3.1 ± 0.3 (n = 13) whereas at low Ca, it was 1.1 ± 0.1 (n = 10). At 100 μM recoverin, a concentration closer to the level expected in the intact rod (1, 9, 11, 28), the effect of recoverin at low Ca was still slight, the prolongation factor being 1.4 ± 0.2 (n = 4). These results indicate that recoverin rendered the recovery phase of the flash response sensitive to Ca.
Figure 2.
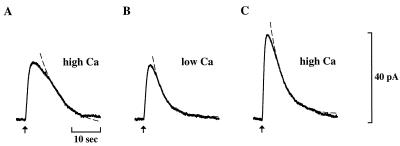
Evidence for the presence of an endogenous recoverin-like protein that prolongs recovery. Sequential responses of an outer segment truncated in high Ca (20 μM) solution. (A) Response in 20 μM Ca. (B) Subsequent response in 1 μM Ca, and (C) final response in 20 μM Ca. Flash strength was 40 photons/μm2. The fitted exponentials have time constants, τ, of (s): 8.0 (A) ; 4.0 (B); 4.7 (C).
The endogenous recoverin of the outer segment might be expected to confer Ca dependence on recovery. Yet when a rod was truncated in 0.5 μM Ca in the absence of exogenous recoverin, τ20 μM Ca/τ0.5 μM Ca was 1.1 ± 0.1 (n = 11), and τ0.5 μM Ca/τ0.03 μM Ca was 1.1 ± 0.1 (n = 5). The lack of a Ca effect on recovery suggested that native recoverin was no longer present. In an attempt to retain recoverin by exploiting its Ca-dependent binding to membranes, rods were truncated at higher Ca (20 μM Ca). After truncation in this solution, the flash response recovered relatively slowly (Fig. 2A), but after the Ca level was dropped to 1 μM, recovery became faster (Fig. 2B). The ratio of the time constant of recovery in high Ca to that for a subsequent response in low Ca was 1.8 ± 0.5 (n = 5). Ca sensitivity of recovery was lost after exposure to submicromolar Ca for >1 min (Fig. 2C). These results suggest that the truncated rod rapidly loses native recoverin at submicromolar Ca. Similar observations in frog rods have been reported by Kawamura and Murakami (19).
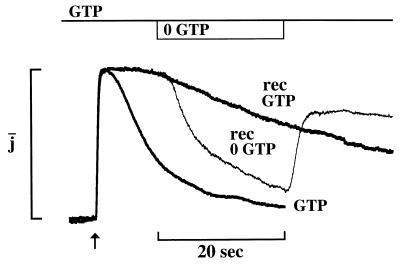
At the low GTP concentrations we used, cGMP synthesis was negligible (29). The time course of recovery of the flash response was determined by the lifetime of light-activated PDE and the time required for cGMP to diffuse back into the truncated outer segment. Because replenishment of cGMP by diffusion was faster than the recovery of the photoresponse (Materials and Methods), the time course of recovery was limited by PDE deactivation. Prolongation of recovery then implies slowed deactivation of activated rhodopsin, transducin, or PDE or slowed reopening of the cGMP-gated channel. To determine where Ca-recoverin acts, GTP was transiently removed from the dialyzing solution to halt activation of transducin by Rh*. Upon GTP removal, the prolonged response in Ca-recoverin rapidly deactivated (thin trace in Fig. 3). This result indicates that the prolonged photoresponse required continuous activation of transducin by Rh*. The photoresponse reappeared when GTP was reintroduced, confirming that Rh* was still present. These results reveal that Ca-recoverin prolongs the lifetime of Rh*, an effect consistent with the inhibition of Rh* phosphorylation observed in vitro (10, 11, 20).
Figure 3.
Evidence that Ca-recoverin prolonged the flash response by slowing rhodopsin deactivation. Saturating flash responses in the presence of GTP (bold traces) without recoverin and with Ca-recoverin. During the response shown by the thin trace, GTP was transiently removed (timing shown above) with Ca-recoverin present throughout. Removal of GTP caused the flash response to deactivate, and reintroduction of GTP resulted in reactivation. Thirty micromolar Ca was present throughout. Concentration of myristoylated recoverin was 20 μM. Flash strength was 97 photons/μm2. Time constants, τ, were (s): 5.8, control; 56, recoverin with GTP; 5.2, during GTP removal in recoverin (exponentials not shown). Absolute amplitudes (pA): 82, control; 55, recoverin with GTP; 59, recoverin with GTP removal. Junction currents induced by GTP removal have been subtracted.
To determine whether Ca-recoverin also might affect a site downstream from rhodopsin, we compared the recovery of the current upon GTP removal in the presence and absence of recoverin. The current recovered with a time constant of 4.2 ± 0.9 s (n = 5) in Ca-recoverin and 4.8 ± 0.5 s (n = 5) without recoverin when GTP was removed during the falling phase of a saturating flash response (data not shown). The similarity of these time constants gives no indication of an additional site of action.
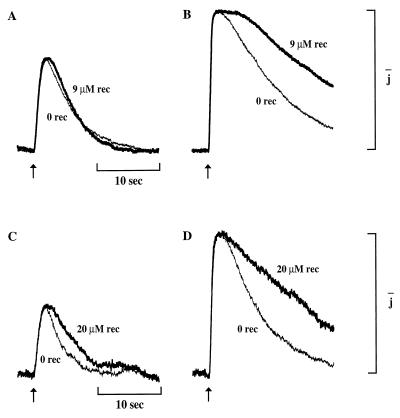
The effect of Ca-recoverin depended on flash strength. In 8.6 μM Ca-recoverin, the response to a bright flash remained in saturation longer and the prolongation factor was 1.3 (Fig. 4B). Yet, in the same outer segment, the response to a 2-fold dimmer flash was not prolonged in Ca-recoverin (Fig. 4A). Recovery of the dim flash response was not affected by 8.6 μM Ca-recoverin in 2 of 3 cells. Higher recoverin concentrations could however prolong responses to dim flashes. In the cell of Fig. 4C, 20 μM Ca-recoverin delayed recovery of the dim flash response and prolonged it by a factor of 1.6 (Fig. 4C), whereas for the bright flash response the prolongation factor was 3.3 (Fig. 4D). Prolongation of dim flash responses at 20 μM Ca-recoverin was observed in 2 of 3 cells. The dim flash response was significantly less affected than the bright flash response in all cells tested at both concentrations of Ca-recoverin (n = 6).
Figure 4.
Dependence of the effect of Ca-recoverin on flash strength. (A) Half-saturating responses to dim flashes (185 photons/μm2). Response in 9 μM Ca-recoverin (bold trace) and subsequent response in 0 μM Ca-recoverin (thin trace). Time constants, τ, were (s): 4, recoverin; 4, control. Absolute amplitudes (pA): 30, recoverin; 31, control. For comparison, the subsaturating control and Ca-recoverin responses have been scaled to the same amplitude and expressed relative to the saturating control response amplitude. (B) Saturating responses of the cell of A to brighter flashes (894 photons/μm2). Response in 9 μM Ca-recoverin (bold trace) and subsequent response in 0 μM Ca-recoverin (thin trace). Time constants, τ, were (s): 13.3, recoverin; 10.4, control. Absolute amplitudes were (pA): 54, recoverin; 47, control. For A and B, control solution contained 0 μM recoverin and 0.5 μM Ca, recoverin solution contained 8.6 μM C14:2 recoverin and 30 μM Ca. (C) Half-saturating responses from a different outer segment to dim flashes (8 photons/μm2) at a higher concentration of Ca-recoverin (20 μM, bold trace). Subsequent response in 0 μM Ca-recoverin (thin trace). Time constants, τ, were (s): 2.9, control; 4.6, recoverin. Absolute amplitudes were (pA): 13, control; 11, recoverin, and the responses have been scaled as in A. (D) Saturating responses of cell of C to brighter flashes (42 photons/μm2) with Ca-recoverin (20 μM, bold trace). Subsequent response in 0 μM Ca-recoverin (thin trace). Time constants, τ, were (s): 6.3, control; 21, recoverin. Absolute amplitudes were (pA): 27, control; 18, recoverin. For C and D, control solution contained 0 μM recoverin and 0.5 μM Ca, recoverin solution contained 20 μM myristoylated recoverin and 30 μM Ca.
A possible mechanism for the different susceptibilities of bright and dim flash responses to Ca-recoverin is suggested by the observation that in the absence of Ca-recoverin, responses to bright flashes had longer time constants of recovery than responses to dim flashes (thin traces in Fig. 4). The recovery time constant of just saturating responses was 9.1 ± 0.8 s (n = 5), whereas in the same rods it was 3.7 ± 0.8 s (n = 3) for responses to 8-fold dimmer flashes. Because the bright flash response recovered more slowly than the current redeveloped upon GTP removal (see above), Rh* deactivation apparently limited the rate of its recovery. Yet, the recovery of the dim flash responses apparently was not limited by Rh* deactivation. Thus, Ca-recoverin might have inhibited Rh* phosphorylation without slowing recovery.
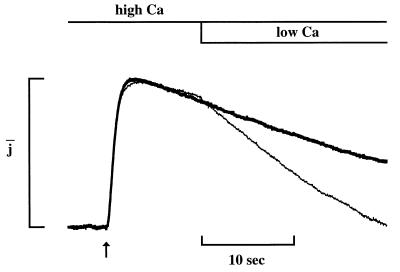
The effect of recoverin switched off with little lag after an imposed drop in Ca concentration. Recovery accelerated within 0.5 s after Ca was lowered (thin trace, Fig. 5). In two other experiments in which the solution changes were complete within 1.7 s, acceleration was apparent within 1.4–2.1 s.
Figure 5.
Rapid response of the effect of Ca-recoverin to a drop in Ca concentration. Flash response in recoverin at 20 μM Ca (bold trace). During the response shown by the thin trace, Ca concentration of the dialyzing solution was lowered from 20 to 0.5 μM Ca (timing indicated above). Recovery accelerated within 300 ms after the drop in Ca. Myristoylated recoverin at 8.6 μM was present throughout. Flash strength 80 photons/μm2. Time constants, τ, were (s): 32, Ca-recoverin; 23, Ca-recoverin after Ca removal. Absolute amplitudes (pA): 54, Ca-recoverin; 51, Ca-recoverin with Ca removal. Junction currents induced by Ca removal have been subtracted.
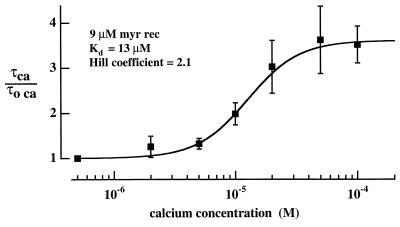
The Ca dependence of the effect of myristoylated recoverin is illustrated in Fig. 6. The prolongation factor τhigh Ca-recoverin/τ0.5 μM Ca at 8.6 μM recoverin is plotted as a function of the high Ca concentration. The Hill equation fitted to the results (continuous curve) had a Kd of 12.7 ± 3.8 (SD) μM Ca and a Hill coefficient of 2.1 ± 0.7. The effective calcium affinity of recoverin is expected to be higher in the intact rod (see Discussion).
Figure 6.
Ca dependence of response prolongation by myristoylated recoverin. Prolongation factor, τhigh Ca-recoverin/τ0.5 μM Ca, for flash response plotted as a function of the high Ca concentration (log scale). Collected results from saturating responses of 14 cells with 8.6 μM myristoylated recoverin, points are means of at least four measurements; error bars indicate SEM. Continuous curve drawn according to the Hill equation with parameters determined by weighted least squares fit: Kd 13 ± 4 μM (SD), Hill coefficient was 2.1 ± 0.7. The point at 0.5 μM Ca was taken as equal to 1 and assigned a weight consistent with the highest SEM.
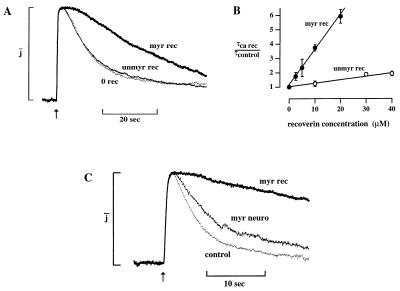
The impact of acylation on the action of recoverin at high Ca was investigated by comparing the effects of the unmyristoylated and myristoylated forms. In the experiment shown in Fig. 7A, 20 μM unmyristoylated Ca-recoverin did not significantly prolong the flash response, whereas the same concentration of the myristoylated form prolonged it by a factor of 5.9. Similar differences in potency were observed in six cells. The dependence of response prolongation on Ca-recoverin concentration for these forms of the protein is shown in Fig. 7B. Prolongation increased linearly with concentration to the highest concentrations tested. Linear least squares fits yielded slopes of 0.25 ± 0.05 μM−1 (myristoylated) and 0.02 ± 0.01 μM−1 (unmyristoylated). This 12-fold difference indicates that myristoylation markedly enhanced the effect of recoverin but was not essential for it.
Figure 7.
(A) Effect of myristoylation of recoverin. Flash response with no added recoverin (control, dotted trace), in 20 μM unmyristoylated recoverin (light trace), and in 20 μM myristoylated recoverin (bold trace). All responses at 30 μM Ca. Flash strength 346 photons/μm2. Time constants, τ, were (s): 9.1, control; 9.5, unmyristoylated; 54, myristoylated. Absolute amplitudes were (pA): 58, control; 72, unmyristoylated; 63, myristoylated. (B) Dependence of prolongation on Ca-recoverin concentration. Prolongation factor, τCa-recoverin/τcontrol, plotted as a function of concentrations of myristoylated (•) and unmyristoylated (○) forms. Collected results from 11 cells (myristoylated) and 8 cells (unmyristoylated). Ca concentration for Ca-recoverin solutions was 30 μM. The control was without recoverin at 30 μM Ca or with recoverin at 0.03 μM Ca (unmyristoylated) or 0.5 μM Ca (myristoylated). Points are means of at least three measurements, error bars SEM. The straight lines were determined by weighted least squares fit, with slopes of 0.024 ± 0.010 μM−1 (unmyristoylated) and 0.25 ± 0.05 μM−1 (SD) (myristoylated). The point at 0 μM recoverin was taken as 1 and assigned a weight consistent with the highest SD. (C) Effect of α neurocalcin, a recoverin homolog. Flash responses with no added protein (control, dotted trace), with 20 μM myristoylated α neurocalcin (thin trace) and with 20 μM myristoylated recoverin (bold trace), 30 μM Ca throughout. Flash strength 80 photons/μm2. Time constants, τ, were (s): 4.5, control; 9.0, neurocalcin; 37, recoverin. Absolute amplitudes were (pA): 38, control; 27, neurocalcin; 36, recoverin.
Recoverin in vivo is heterogeneously acylated, bearing either the myristoyl (C14:0) or the C14:1, C14:2, or C12:0 group (4, 5). Table 1 compares the effect of the various acylated forms of recombinant recoverin (8.6 μm) and shows that there were no significant differences among them.
Table 1.
Effect of various acyl groups
| [Ca], μM | τrec/τcontrol | |
|---|---|---|
| C14:0 recoverin (n) | C12:0 recoverin (n) | |
| 0.5 | 1.2 ± 0.1 (3) | 1.0 ± 0.2 (3) |
| 2 | 1.4 ± 0.1 (6) | 1.6 ± 0.3 (4) |
| 12 | 2.9 ± 0.5 (3) | 3.0 ± 0.8 (5) |
| C14:0 recoverin (n) | C14:2 recoverin (n) | |
| 0.5 | 1.2, 1.2 (2) | 1.1 ± 0.1 (7) |
| 10 | 2.2 ± 0.3 (5) | 2.2 ± 0.6 (5) |
| 30 | 3.4, 3.5 (2) | 2.4 ± 0.3 (5) |
The effect of recoverin was compared with that of neurocalcin, a homolog with 49% sequence identity (30) expressed in retinal ganglion and amacrine cells and the brain (31). Myristoylated α neurocalcin prolonged recovery by a factor of 2.0, whereas for the same concentration of myristoylated recoverin the factor was 8.2 (Fig. 7C). Neurocalcin prolonged recovery in each of two cells at 30 μM Ca and one of two cells at 12 μM Ca. At 30 μM Ca, the prolongation by neurocalcin was 2.0 and 2.1 compared with an expected value of 5.9 for recoverin (Fig. 7B). This result indicates that sequence-specific elements gave recoverin a 3-fold higher activity than that of neurocalcin.
DISCUSSION
Ca-recoverin prolonged the recovery of the flash response by prolonging the catalytic lifetime of Rh*. These observations are consistent with in vitro results demonstrating that the Ca-bound forms of recoverin and S-modulin (the counterpart in frogs) inhibit Rh* phosphorylation (9–11, 20). Ca-recoverin had a larger effect on responses to bright flashes than to dim flashes. Our finding that neurocalcin also prolonged the light response suggests that other members of the recoverin family may confer Ca-dependence on the phosphorylation of G protein-coupled membrane receptors.
The linear dependence of the prolongation factor on the aqueous concentration of Ca-recoverin (Fig. 7B) is consistent with the following model. Assume that when Ca-recoverin binds to the kinase, it completely inhibits kinase activity and that the fraction of free kinase, Kfree/Ktot, varies with the concentration of Ca-recoverin in the outer segment, [Ca2R]os, according to:
 |
where K3 is the affinity of kinase for Ca-recoverin. If the time constant for recovery of the bright flash response varies inversely with Kfree, the prolongation factor will be
 |
We attribute the 12-fold higher activity of myristoylated Ca-recoverin (Fig. 7B) to membrane binding, which will increase its concentration in the truncated outer segment. Because the protein cores of the myristoylated and unmyristoylated forms have virtually identical structures in the Ca-bound state (32), it is likely that they have the same affinity for the kinase. If there is negligible membrane binding of the unacylated form, the total concentrations of the two forms in the outer segment are:
 |
 |
where the prime denotes the myristoylated form. Assuming that the kinase is inhibited equally by membrane-bound and aqueous Ca-recoverin, the 12-fold higher activity of the myristoylated form implies that
 |
The partition coefficient K2 that specifies the ratio of aqueous and membrane-bound concentrations of myristoylated Ca-recoverin,
 |
then has a value of 0.09. This value is similar to that expected from measurements of the membrane binding of myristoylated Ca-recoverin by Zozulya and Stryer (7), who found a half-saturating membrane concentration M equivalent to 220 μM rhodopsin. Using this number, the value of K2 expected is given by K2= dMN/D, in which D is the areal density of rhodopsin in disc membranes, d is the thickness of the aqueous interdiscal space, and N is Avogadro’s number. Taking D as 2 × 1012 cm−2, and d as 15 × 10−7 cm gives K2= 0.10. The partitioning of acylated Ca-recoverin into membranes will stabilize the Ca-recoverin complex and lead to a higher effective Ca affinity in the intact rod (7, 11).
The Ca-dependence of response prolongation by myristoylated recoverin in the truncated rod (Fig. 6) agrees well with that measured for the binding of Ca to myristoylated recoverin in the absence of membranes (3), as expected for the following reason. At equilibrium, the aqueous concentrations of Ca-free and Ca-bound recoverin in the truncated outer segment equal those in the dialyzing solution. The concentration of myristoylated Ca-recoverin in the outer segment will vary linearly with that in the aqueous phase according to
 |
so that the concentration of myristoylated recoverin in the outer segment will follow the Ca-dependence for the binding of Ca to myristoylated recoverin in solution, assuming that the membrane is not saturated with Ca-recoverin. The response prolongation, which varies linearly with the concentration of Ca-recoverin, will then have the form of the Ca-dependence of Ca binding to myristoylated recoverin in solution and a magnitude proportional to the recoverin concentration.
The affinity of myristoylated Ca-recoverin for kinase, K3, was 48 μM, because the prolongation factor was six at 20 μM aqueous Ca-recoverin (Fig. 7B), for which the total concentration in the outer segment would be 240 μM. Biochemical estimates of the affinity of myristoylated recoverin and S-modulin for their respective rhodopsin kinases range from 0.8 to 3.5 μM (10, 11, 33, 34). The relatively low affinity measured here may reflect a species mismatch between recombinant bovine recoverin and the salamander kinase.
The calcium dependence of the action of acylated recoverin in the intact cell may be estimated from the equilibria for the binding of myristoylated recoverin to calcium, membranes, and kinase:
 |
 |
 |
According to this scheme the concentration of free Ca at which one-half of the kinase is inhibited, Ca0.5, is given by
 |
Estimating the free recoverin concentration in the cell R′ as 20 μM, and taking K1 as (17 μM)2 (3), K2 as 0.09, and K3 as 48 μM gives Ca0.5 as 7.6 μM Ca. This is probably an upper limit because the affinity of native recoverin for kinase is likely to be higher. The extent of kinase inhibition by Ca-recoverin at dark levels of calcium will depend critically on the concentration of recoverin (11), which also may be higher than the estimate used here. Thus, in the intact cell, the Ca dependence of the effect of recoverin should shift toward the dark Ca concentration, which is estimated as roughly 0.5 μM (18, 35–38).
In the presence of recoverin, a sudden drop in intracellular Ca concentration accelerated the recovery of a flash response within <1 s. Thus, in the intact rod, inhibition of rhodopsin kinase by Ca-recoverin should be rapidly reversible. If a sufficient fall in Ca precedes Rh* phosphorylation, the shutoff of Rh* could accelerate during the flash response. Indeed, Matthews (39) has reported that a Ca-dependent reduction of PDE activation occurs during the bright flash response in an intact cell.
Background light reduces the gain of the light-activated cGMP cascade by lowering the intracellular Ca concentration (reviewed in ref. 40). The gain reduction results partly from a Ca-dependence of the coupling between Rh* and light-dependent PDE activity (29, 39, 41–43). At this locus, the effective amplification decreases as much as 7-fold between darkness and bright background light (43). Recoverin may be involved in mediating this effect. We have found that, in the truncated outer segment, recoverin prolongs the lifetime of Rh* at high Ca. Consistent with such an effect in the intact cell, Matthews (39) has found that the amplification between Rh* and PDE is sensitive to Ca for only ≈0.5 s after a flash, an interval much shorter than the lifetime of light-triggered PDE activity (39, 41, 44) and comparable to that in which Rh* phosphorylation is thought to occur (15, 45).
Recoverin may not be the only Ca-binding protein that regulates the coupling between rhodopsin and PDE, however, because in truncated outer segments the rising phase of the flash response is sensitive to Ca (29, 45); yet we found that recombinant Ca-recoverin had no effect on the rising phase. Furthermore, a soluble factor (presumably recoverin), which at high Ca delayed Rh* phosphorylation, was observed to rapidly wash out of the truncated rod (45) while the Ca-dependence of the rising phase remained. These observations suggest that another Ca-binding protein may participate with recoverin in Ca-dependent control of light-activated PDE.
Acknowledgments
We thank Dr. Daniel Ladant for the recombinant neurocalcin, Dr. James Ames for fluorescence measurements of free Ca levels, Dr. Anne Baldwin for assistance with expression of recoverin, and Dr. King-Wai Yau for helpful comments on the manuscript. Supported by National Institutes of Health Grants EY01543, EY02005, NS07158, and GM24032 and grants from Human Frontiers in Science and the Alcon Research Institute.
ABBREVIATIONS
- Ca
Ca2+
- PDE
phosphodiesterase
- Rh*
photoexcited rhodopsin
References
- 1.Dizhoor A M, Ray S, Kumar S, Niemi G, Spencer M, Brolley D, Walsh K A, Philipov P P, Hurley J B, Stryer L. Science. 1991;251:915–918. doi: 10.1126/science.1672047. [DOI] [PubMed] [Google Scholar]
- 2.Ames J B, Tanaka T, Stryer L, Ikura M. Curr Opin Struct Biol. 1996;6:432–438. doi: 10.1016/s0959-440x(96)80106-0. [DOI] [PubMed] [Google Scholar]
- 3.Ames J B, Porumb T, Tanaka T, Ikura M, Stryer L. J Biol Chem. 1995;270:4526–4533. doi: 10.1074/jbc.270.9.4526. [DOI] [PubMed] [Google Scholar]
- 4.Dizhoor A M, Ericsson L H, Johnson R S, Kumar S, Olshevskaya E, Zozulya S, Neubert T A, Stryer L, Hurley J B, Walsh K A. J Biol Chem. 1992;267:16033–16036. [PubMed] [Google Scholar]
- 5.Johnson R S, Ohguro H, Palczewski K, Hurley J B, Walsh K A, Neubert T A. J Biol Chem. 1994;269:21067–21071. [PubMed] [Google Scholar]
- 6.Tanaka T, Ames J B, Harvey T S, Stryer L, Ikura M. Nature (London) 1995;376:444–447. doi: 10.1038/376444a0. [DOI] [PubMed] [Google Scholar]
- 7.Zozulya S, Stryer L. Proc Natl Acad Sci USA. 1992;89:11569–11573. doi: 10.1073/pnas.89.23.11569. [DOI] [PMC free article] [PubMed] [Google Scholar]
- 8.Dizhoor A M, Chen C K, Olshevskaya E, Sinelnikova V V, Phillipov P, Hurley J B. Science. 1993;259:829–832. doi: 10.1126/science.8430337. [DOI] [PubMed] [Google Scholar]
- 9.Kawamura S, Hisatomi O, Kayada S, Tokunaga F, Kuo C H. J Biol Chem. 1993;268:14579–14582. [PubMed] [Google Scholar]
- 10.Chen C K, Inglese J, Lefkowitz R J, Hurley J B. J Biol Chem. 1995;270:18060–18066. doi: 10.1074/jbc.270.30.18060. [DOI] [PubMed] [Google Scholar]
- 11.Klenchin V A, Calvert P D, Bownds M D. J Biol Chem. 1995;270:16147–16152. doi: 10.1074/jbc.270.27.16147. [DOI] [PubMed] [Google Scholar]
- 12.Liebman P A, Pugh E N., Jr Nature (London) 1980;287:734–736. doi: 10.1038/287734a0. [DOI] [PubMed] [Google Scholar]
- 13.Sitaramayya A, Liebman P A. J Biol Chem. 1983;258:12106–12109. [PubMed] [Google Scholar]
- 14.Nakatani K, Yau K W. J Physiol (London) 1988;395:731–753. doi: 10.1113/jphysiol.1988.sp016943. [DOI] [PMC free article] [PubMed] [Google Scholar]
- 15.Chen J, Makino C L, Peachey N S, Baylor D A, Simon M I. Science. 1995;267:374–377. doi: 10.1126/science.7824934. [DOI] [PubMed] [Google Scholar]
- 16.Yau K W, Nakatani K. Nature (London) 1985;313:579–582. doi: 10.1038/313579a0. [DOI] [PubMed] [Google Scholar]
- 17.McNaughton P A, Cervetto L, Nunn B J. Nature (London) 1986;322:261–263. doi: 10.1038/322261a0. [DOI] [PubMed] [Google Scholar]
- 18.Lagnado L, Cervetto L, McNaughton P A. J Physiol (London) 1992;455:111–142. doi: 10.1113/jphysiol.1992.sp019293. [DOI] [PMC free article] [PubMed] [Google Scholar]
- 19.Kawamura S, Murakami M. Nature (London) 1991;349:420–423. doi: 10.1038/349420a0. [DOI] [PubMed] [Google Scholar]
- 20.Kawamura S. Nature (London) 1993;362:855–857. doi: 10.1038/362855a0. [DOI] [PubMed] [Google Scholar]
- 21.Gray-Keller M P, Polans A S, Palczewski K, Detwiler P B. Neuron. 1993;10:523–531. doi: 10.1016/0896-6273(93)90339-s. [DOI] [PubMed] [Google Scholar]
- 22.Hodgkin A L, McNaughton P A, Nunn B J. J Physiol (London) 1985;358:447–468. doi: 10.1113/jphysiol.1985.sp015561. [DOI] [PMC free article] [PubMed] [Google Scholar]
- 23.McNaughton P A. Cell Calcium. 1995;18:275–284. doi: 10.1016/0143-4160(95)90024-1. [DOI] [PubMed] [Google Scholar]
- 24.Tsien R, Pozzan T. Methods Enzymol. 1989;172:230–262. doi: 10.1016/s0076-6879(89)72017-6. [DOI] [PubMed] [Google Scholar]
- 25.Brooks S P, Storey K B. Anal Biochem. 1992;201:119–126. doi: 10.1016/0003-2697(92)90183-8. [DOI] [PubMed] [Google Scholar]
- 26.Ray S, Zozulya S, Niemi G A, Flaherty K M, Brolley D, Dizhoor A M, McKay D B, Hurley J, Stryer L. Proc Natl Acad Sci USA. 1992;89:5705–5709. doi: 10.1073/pnas.89.13.5705. [DOI] [PMC free article] [PubMed] [Google Scholar]
- 27.Zozulya S, Ladant D, Stryer L. Methods Enzymol. 1995;250:383–393. doi: 10.1016/0076-6879(95)50086-3. [DOI] [PubMed] [Google Scholar]
- 28.Lambrecht H G, Koch K W. EMBO J. 1991;10:793–798. doi: 10.1002/j.1460-2075.1991.tb08011.x. [DOI] [PMC free article] [PubMed] [Google Scholar]
- 29.Lagnado L, Baylor D A. Nature (London) 1994;367:273–277. doi: 10.1038/367273a0. [DOI] [PubMed] [Google Scholar]
- 30.Okazaki K, Watanabe M, Ando Y, Hagiwara M, Terasawa M, Hidaka H. Biochem Biophys Res Commun. 1992;185:147–153. doi: 10.1016/s0006-291x(05)80968-4. [DOI] [PubMed] [Google Scholar]
- 31.Hidaka H, Okazaki K. Neurosci Res. 1993;16:73–77. doi: 10.1016/0168-0102(93)90074-z. [DOI] [PubMed] [Google Scholar]
- 32.Ames J B, Tanaka T, Ikura M, Stryer L. J Biol Chem. 1995;270:30909–30913. doi: 10.1074/jbc.270.52.30909. [DOI] [PubMed] [Google Scholar]
- 33.Calvert P D, Klenchin V A, Bownds M D. J Biol Chem. 1995;270:24127–24129. doi: 10.1074/jbc.270.41.24127. [DOI] [PubMed] [Google Scholar]
- 34.Senin I I, Zargarov A A, Alekseev A M, Gorodovikova E N, Lipkin V M, Philippov P P. FEBS Lett. 1995;376:87–90. doi: 10.1016/0014-5793(95)01187-2. [DOI] [PubMed] [Google Scholar]
- 35.Ratto G M, Payne R, Owen W G, Tsien R Y. J Neurosci. 1988;8:3240–3246. doi: 10.1523/JNEUROSCI.08-09-03240.1988. [DOI] [PMC free article] [PubMed] [Google Scholar]
- 36.Korenbrot J I, Miller D L. Vision Res. 1989;29:939–948. doi: 10.1016/0042-6989(89)90108-9. [DOI] [PubMed] [Google Scholar]
- 37.Gray-Keller M P, Detwiler P B. Neuron. 1994;13:849–861. doi: 10.1016/0896-6273(94)90251-8. [DOI] [PubMed] [Google Scholar]
- 38.Sampath A P, Matthews H R, Cornwall M C, Fain G L. J Gen Physiol. 1998;111:53–64. doi: 10.1085/jgp.111.1.53. [DOI] [PMC free article] [PubMed] [Google Scholar]
- 39.Matthews H R. J Gen Physiol. 1997;109:141–146. doi: 10.1085/jgp.109.2.141. [DOI] [PMC free article] [PubMed] [Google Scholar]
- 40.Koutalos Y, Yau K W. Trends Neurosci. 1996;19:73–81. doi: 10.1016/0166-2236(96)89624-x. [DOI] [PubMed] [Google Scholar]
- 41.Pepperberg D R, Cornwall M C, Kahlert M, Hofmann K P, Jin J, Jones G J, Ripps H. Visual Neurosci. 1992;8:9–18. doi: 10.1017/s0952523800006441. [DOI] [PubMed] [Google Scholar]
- 42.Koutalos Y, Nakatani K, Yau K W. J Gen Physiol. 1995;106:891–921. doi: 10.1085/jgp.106.5.891. [DOI] [PMC free article] [PubMed] [Google Scholar]
- 43.Matthews H R. J Physiol (London) 1996;490:1–15. doi: 10.1113/jphysiol.1996.sp021123. [DOI] [PMC free article] [PubMed] [Google Scholar]
- 44.Lyubarsky A, Nikonov S, Pugh E N., Jr J Gen Physiol. 1996;107:19–34. doi: 10.1085/jgp.107.1.19. [DOI] [PMC free article] [PubMed] [Google Scholar]
- 45.Sagoo M S, Lagnado L. Nature (London) 1997;389:392–395. doi: 10.1038/38750. [DOI] [PubMed] [Google Scholar]


