Abstract
Rumen biohydrogenation of dietary α-linolenic acid gives rise in ruminants to accumulation of fatty acid intermediates, some of which may be transferred into milk. Rumelenic acid [cis-9 trans-11 cis-15 C18:3 (RLnA)] has recently been characterized, but other C18:3 minor isomers are still unknown. The objective of this work was to identify a new isomer of octatridecenoic acid present in milk fat from ewes fed different sources of α-linolenic acid. Structural characterization of this fatty acid was achieved by GC-MS. Analysis of dimethyloxazoline and picolinyl ester derivatives allowed for location of the double bond positions. Covalent adduct chemical ionization tandem mass spectrometry confirmed the positional structure 9-11-15, identical to RLnA, and helped to establish double bond geometry (cis-trans-trans). This new C18:3 isomer could be formed by isomerization of cis-15 bond of RLnA and subsequently converted by hydrogenation to trans-11 trans-15 C18:2, an octadecadienoic acid also detected in this study.
Keywords: fatty acid, α-linolenic acid, conjugated linoleic acid, ewe, biohydrogenation intermediate, vaccenic acid, gas chromatography, mass spectrometry
Rumen biohydrogenation of dietary PUFAs generates a wide array of isomeric unsaturated FAs that are absorbed, some of which may be metabolized and further deposited into tissues or transferred into milk. The main pathway for the biohydrogenation of α-linolenic acid (cis-9 cis-12 cis-15 C18:3) in ruminants involves an initial isomerization to a conjugated triene (cis-9 trans-11 cis-15 C18:3) named rumelenic acid (RLnA) followed by hydrogenation of double bonds at carbons 9, 15, and 11 to yield trans-11 cis-15 C18:2, trans-11 C18:1 (vaccenic acid), and C18:0 (1). Structural characterization of RLnA was recently confirmed by GC-MS after synthesis of both its picolinyl ester and dimethyloxazoline (DMOX) derivative (2), and different studies confirmed that minute amounts of α-linolenic acid biohydrogenation intermediates are present in milk fat (3, 4). However, molecular structure of other minor intermediates also produced from dietary PUFA biohydrogenation and after transferred to milk fat still remains unclear.
Although analysis of picolinyl esters or DMOX derivatives by electron impact GC-MS have demonstrated to be useful for identifying double bond positions in PUFA, this approach does not supply a reliable assignment of geometrical configuration. In contrast, covalent adduct chemical ionization tandem mass spectrometry (CACI-MS/MS) serves as a powerful tool for identifying positional and geometric isomers of conjugated linoleic acid (CLA) methyl esters (5) and should prove quite useful for the analysis of conjugated diene methyl esters with longer chain length as well (6, 7). CACI-MS/MS concentrates signal in a very few diagnostic ions, which can then be plotted as indicators for the parent compound. Furthermore, this technique allowed the direct analysis of fatty acid methyl esters (FAMEs), avoiding the problems associated with the preparation of other derivatives. Comprehensive studies of FAME with unknown double bond position have rarely been undertaken because of the lack of pure isomer standards. However, results to date in ruminant fats suggest that CACI-MS/MS may provide structural information on even the most complex polyenes (8, 9).
The purpose of this study was to use various GC-MS techniques to unequivocally determine the molecular structure of a minor C18:3 conjugated isomer that is present in milk fat samples from ewes fed α-linolenic acid. Two kinds of milk fat samples were tested; one originated from a group of animals fed diets supplemented with extruded linseed, and the other was from ewes that were fed pasture-based diets. Both were chosen for their high α-linolenic acid content. Identification of double-bond positions for the unknown C18:3 isomer was achieved using DMOX and picolinyl esters by electron impact GC-MS. CACI-MS/MS of FAME confirmed the double-bond positions and helped to elucidate their geometric configuration.
MATERIALS AND METHODS
Samples
Milk originating from two different studies was utilized to determine the molecular structure of the unknown PUFA. Briefly, the first study dealt with the impact of a control diet supplemented with two levels of extruded linseed on the FA composition of milk fat from ewes. One group of sheep received a typical milking ration (control) with a forage:concentrate ratio of 60:40, and the other received a ration supplemented with 6 and 12 g per 100 g of extruded linseed in dry matter for a period of 60 days. The second experiment was conducted to investigate the effect of pasture-based feeding on the FA profile of ewe milk. Sixty ewes were randomly assigned to one of two feeding regimes and followed for 5 weeks: one group of ewes was allowed to graze only pasture, and the other was fed a total mixed ration (TMR) 20:80 forage:concentrate ratio. Fat was extracted from milk after two centrifugations. Separated lipids were stored in amber vials, blanketed with a stream of N2, and stored at −20°C until analysis. Milk fats from the two experiments were analyzed by GC with a flame ionization detector (FID). Selected samples were analyzed by GC-MS and GC-MS/MS using two different ionization modes to determine the molecular structure of the unknown FA.
Analytical methods
FAMEs were prepared by base-catalyzed methanolysis of the glycerides (KOH in methanol) according to ISO-IDF procedure (10). Analysis of FAME with GC-FID was performed on a gas-liquid chromatograph (Agilent 6890 N network system) with an autoinjector. FAME profile was determined by split injection (1:100) on a CP-Sil 88 fused silica capillary column (100 m × 0.25 mm with 0.20 μm film; Varian, Middelburg, The Netherlands) using a gradient temperature program. Initial oven temperature was 160°C. After 80 min, oven temperature was raised at 10°C min−1 to 210°C and then held for 35 min. Helium was the carrier gas, and the injector and detector were at 250°C.
The preparation of DMOX derivatives from FAME was based on the Fay and Richli (11) procedure. Briefly, the DMOX derivatization was carried out by adding 2-amino-2-methylpropanol to the FAME sample in glass vials exposed to a stream of nitrogen, sealed with Teflon-lined caps, and heating the mixture overnight at 190°C. After cooling, the reaction mixture was dissolved in dichloromethane and washed with distilled water. The dichloromethane solution was dried with Na2SO4; solvent was evaporated under a stream of nitrogen at room temperature and the solids redissolved in hexane. DMOX derivatives were separated on an Agilent GC chromatograph connected to a positive electron impact mass spectrometer (MS 5973N; Palo Alto, CA) and equipped with the same CP-Sil 88 capillary column. The filament trap current was 400 μA at 70 eV. Two microliters of the DMOX solution were injected by split injection (1:2) with a similar oven temperature program as used for FAME analysis. Synthesis of picolinyl esters from dairy fat was carried out following the one-step method proposed by Destaillats and Angers (12) and analyzed by GC-MS in the same chromatograph as described above. Two microliters of the picolinyl ester solution were also injected by split injection (1:2). Initial oven temperature was 160°C. Immediately oven temperature was raised at 5°C min−1 to 200°C and held for 10 min and then increased at 5°C min−1 to 230°C and held for 176 min.
CACI-MS/MS was performed on a Varian Star 3400CX gas chromatograph equipped with a CP-Sil 88 capillary column (100 m × 0.25 mm with 0.20 μm film; Varian, Walnut Creek, CA) and coupled to a Varian Saturn 2000 ion trap according to procedures detailed elsewhere (13, 14). Initial oven temperature was 155°C, held for 95 min, and then raised at 10°C min−1 to 225°C and held for 15 min. Acetonitrile was used as the reagent gas, and ion trap parameters were as follows: trap temperature, 150°C; manifold temperature, 45°C; transfer line temperature, 200°C; precursor isolation window, 3 m/z; emission current, 5 µA; excitation amplitude, 0.41–0.47 V. The chemical ionization storage level, corresponding to the lowest mass stored in the ion trap during ionization of reagent gas, was set to m/z 22. Other parameters were ejection amplitude, 8.0 V; maximum ionization time, 2000 µs; maximum reaction time, 120 µs; and prescan ionization time, 200 µs. The excitation storage level, representing the radio frequency storage level in the ion trap when the dissociation waveform is applied, ranged from m/z 81.9–82.3. This parameter varies with the m/z of the precursor ion and represents a lower boundary of m/z, set at least 2 mass units below the lowest anticipated mass fragment. In CACI-MS/MS, the product of self-reaction of acetonitrile, (1-methyleneimino)-1-ethenylium (CH = =N+=CH2, m/z 54), reacts with double bonds to yield an adduct of mass [M+54]+, where M is the mass of the parent analyte. Isolation and collisional activation of the [M+54]+ yields fragments indicative of double-bond position. Prompt dissociation in covalent adduct chemical ionization mass spectrometry (CACI-MS) also yields ions indicative of general structure.
Individual CLA isomers were identified by comparison to standard mixtures distributed by Nu-Chek Prep (Elysian, MN), and cis-9 trans-11 cis-15 C18:3 standard was a generous gift from Dr. Paul Angers, Université Laval, Canada. CACI-MS/MS analysis of unknown 11-15 C18:2 spectra was compared with that for a C18:2 methyl ester mixture containing cis-9 cis-12 C18:2 (10% w/w), cis-9 trans-12 C18:2 (20% w/w), trans-9 cis-12 C18:2 (20% w/w), and trans-9 trans-12 C18:2 (50% w/w) (Sigma-Aldrich, St. Louis, MO).
RESULTS AND DISCUSSION
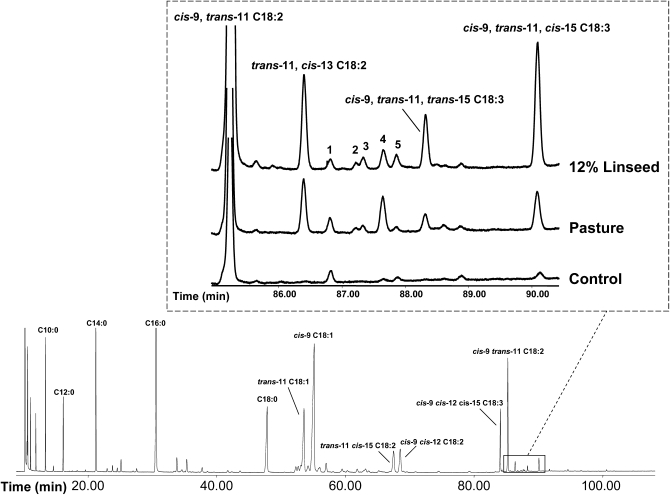
Figure 1 shows GC-FID chromatograms for milk fat FAME from ewes fed different α-linolenic acid sources. The most intense peak in the magnified area of Fig. 1 includes cis-9, trans-11 C18:2 [rumenic acid (RA); retention time (tR) = 85.3 min], quantitatively the most relevant CLA isomer in ruminant milk fat. After RA, other minor CLA isomers eluted. Assignment of the molecular structure of those minor compounds was undertaken by different GC-MS techniques. Results from the current research confirm the accumulation of various CLA isomers consistent with a high supplementation of α-linolenic acid in diet. Intake of this PUFA leads to an enhanced production of trans-11 cis-13 (tR = 86.4 min), trans-11 trans-13 (tR = 87.6 min), and trans-9 trans-11 C18:2 (tR = 87.9 min) (Fig. 1; Table 1). Elevated levels of these FA have already been reported in the milk fat of ewes fed rations supplemented with linseed (15, 16). Increases in both trans-trans and trans-cis 11-13 CLA would be consistent with the rising of these compounds in duodenal flow and milk fat in response to dietary linseed oil in dairy cows (17–19), and they were associated with α-linolenic acid ingestion. They could probably be formed by isomerization of trans-11 cis-15 C18:2 or hydrogenation of RLnA following pathways still unknown.
Fig. 1.
Gas chromatogram with FID of milk fat FAMEs from ewes fed a diet supplemented with 12% linseed. Expanded area shows partial gas chromatograms of the conjugated linoleic acid and RLnA region of the sample below (12% linseed) as well as FAME from ewe milk fat fed a diet based on pasture (Pasture) and an α-linolenic acid nonenriched diet (Control). Peak numbering: 1, C21:0; 2, trans-13 trans-15 C18:2; 3, trans-12 trans-14 C18:2; 4, trans-11 trans-13 C18:2; 5, trans-9 trans-11 C18:2.
TABLE 1.
Fatty acids profile (g/100 g of total fatty acid methyl esters) of milk fat from ewes fed diets without (control) and with extruded linseed supplementation (12% linseed in dry matter)
| FATTY ACID | Control | 12% Linseed |
|---|---|---|
| Saturated | ||
| C4:0 | 5.16 | 3.76 |
| C6:0 | 3.34 | 1.80 |
| C8:0 | 2.79 | 1.31 |
| C10:0 | 7.28 | 3.30 |
| C12:0 | 3.43 | 2.23 |
| C14:0 | 8.48 | 7.09 |
| C15:0 iso | 0.24 | 0.19 |
| C15:0 anteiso | 0.37 | 0.31 |
| C15:0 | 0.76 | 0.61 |
| C16:0 iso | 0.23 | 0.21 |
| C16:0 | 25.09 | 16.74 |
| C17:0 iso + trans-9 C16:1 | 0.49 | 1.01 |
| C17:0 anteiso + cis-9 C16:1 | 0.86 | 0.91 |
| C17:0 | 0.52 | 0.40 |
| C18:0 | 12.27 | 7.97 |
| C20:0 | 0.26 | 0.22 |
| Other saturated | 0.57 | 0.57 |
| Monounsaturated | ||
| C10:1 | 0.20 | 0.17 |
| cis-9 C14:1 | 0.08 | 0.19 |
| cis-9 C15:1 | 0.09 | 0.06 |
| cis-7 C16:1 | 0.24 | 0.26 |
| cis-9 C17:1 | 0.14 | 0.13 |
| trans (6+7+8) C18:1 | 0.49 | 0.65 |
| trans-9 C18:1 | 0.40 | 0.67 |
| trans-10 C18:1 | 0.69 | 0.72 |
| trans-11 C18:1 | 2.90 | 8.07 |
| trans-12 C18:1 | 0.60 | 0.86 |
| cis-9 C18:1 | 15.89 | 20.57 |
| cis-11 C18:1 | 0.28 | 0.42 |
| trans-15 C18:1 | 0.21 | 0.32 |
| trans-16 + cis-14 C18:1 | 0.33 | 0.52 |
| cis-15 C18:1 | 0.04 | 0.22 |
| Other monounsaturated | 0.57 | 1.21 |
| Nonconjugated C18:2 | ||
| trans-11 trans-15 C18:2 | 0.06 | 0.33 |
| trans-11 cis-15 C18:2 | 0.03 | 2.77 |
| cis-9 cis-12 C18:2 | 2.48 | 2.89 |
| Other nonconjugated C18:2 | 0.39 | 1.25 |
| Conjugated C18:2 | ||
| cis-9 trans-11 C18:2 | 0.92 | 4.68 |
| trans-11 cis-13 C18:2 | 0.01 | 0.39 |
| trans-13 trans-15 C18:2 | – | 0.02 |
| trans-12 trans-14 C18:2 | – | 0.05 |
| trans-11 trans-13 C18:2 | 0.01 | 0.08 |
| trans-9 trans-11 C18:2 | 0.02 | 0.05 |
| C18:3 | ||
| cis-6 cis-9 cis-12 C18:3 | 0.03 | 0.02 |
| cis-9 cis-12 cis-15 C18:3 | 0.25 | 2.57 |
| cis-9 trans-11 trans-15 C18:3 | 0.01 | 0.21 |
| cis-9 trans-11 cis-15 C18:3 | 0.03 | 0.52 |
| Other PUFAs | 0.42 | 0.44 |
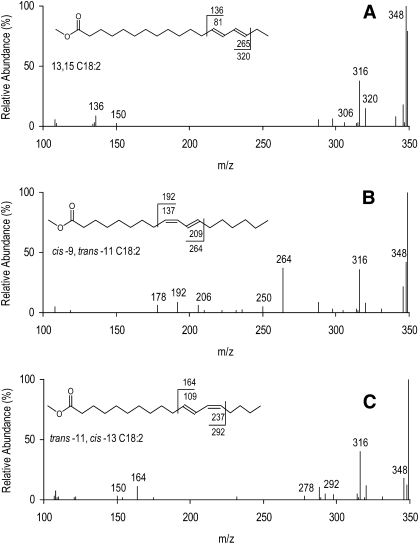
Figure 1 of pasture and 12% linseed diet partial chromatograms shows that a small peak with a shoulder eluting after C21:0 (tR = 86.8 min). It is composed of two C18:2 FAME, trans-12 trans-14 C18:2 (tR = 87.3 min), and an unknown CLA isomer (tR = 87.2 min). The location and geometry of the double bonds for trans-12 trans-14 C18:2 were identified by CACI-MS/MS, and retention time was used to confirm geometric configuration. Figure 2A presents CACI-MS/MS spectra of the unknown CLA (tR = 87.2 min); reference spectra of cis-9 trans-11 C18:2 and trans-11 cis-13 C18:2 are provided for illustration of fragmentation patterns about a conjugated double bond (Fig. 2B, C). The unknown CLA exhibits two major diagnostic ions corresponding to m/z 136 and 320 assigned previously to 13,15 C18:2 (5). The geometrical configuration of the double bonds can be assigned based on the elution order of CLA isomers by GC as trans-13 trans-15. This assignment is also consistent with previous results obtained from silver ion HPLC (Ag+-HPLC), indicating a trans-trans geometrical configuration. Ag+-HPLC chromatograms of milk fat FAME samples exhibited a peak eluting before and very close to trans-12 trans-14 C18:2 with a UV spectrum similar to CLA (data not shown). Such Ag+-HPLC peak could be assigned to trans-13 trans-15 C18:2. To our knowledge, this would be the first report of the presence in milk fat of this FA, previously characterized by Fritsche et al. (20) in synthetic CLA mixtures and recently reported in ruminal fluid by Shingfield et al. (21).
Fig. 2.
CACI-MS/MS for a 13-15 conjugated linoleic acid methyl ester (A; precursor ion, m/z = 348) from ovine milk fat showing the diagnostic ions ω (m/z = 136) and α (m/z = 320). Reference spectra from ovine milk fat are provided and include cis-9 trans-11 C18:2 (B) and trans-11 cis-13 C18:2 (C). B reveals diagnostic ions at m/z 192 (ω ion) and 264 (α ion) (precursor ion, m/z = 348). C reveals diagnostic ions at m/z 164 (ω ion) and 292 (α ion) (precursor ion, m/z = 348). Values associated with the FAME structure represent fragmentation with and without (1-methylenimino)-1-ethenylium adduct. Values ± 14 m/z units from the diagnostic ions represent alternative fragmentation patterns about the double bonds and are characteristic for identifying diagnostic ions.
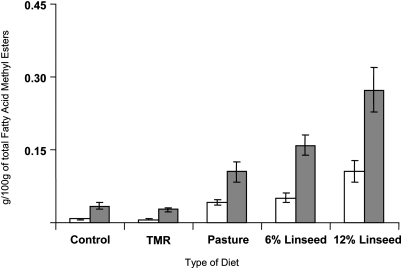
Eluting just after the CLA area (tR = 85.3–87.9 min), and earlier than RLnA (tR = 90.1 min), an unknown compound eluted with tR = 88.3 min (Fig. 1). This FA was ∼0.05% of total FA in 6% linseed supplementation and pasture diet samples, reaching values up to 0.21% in milk fat from diets supplemented with 12% linseed. Figure 3 shows an increase in the milk fat RLnA followed a similar trend for the unknown compound eluting at 88.3 min. Regression analysis of RLnA and the unknown C18:3 FA concentrations from both trials (144 samples in total) provided evidence for a strong relationship between both compounds (R2 = 0.94). Levels of both FA were negligible in TMR and control samples, but they increased as consequence of the presence of a source of α-linolenic acid on diet (pasture or linseed) (Figs. 1 and 3; Table 1). Similarly, an elevation in the RLnA levels up to 0.18% by diet supplementation with high amounts of extruded linseed was reported in cow milk fat (3). Plourde et al. (4) also detected remarkable amounts of RLnA in dairy samples from bovine fed a high pasture. However, those authors did not report the presence of other C18:3 isomers in milk fats.
Fig. 3.
Mean values of cis-9 trans-11 cis-15 C18:3 (gray color) and cis-9 trans-11 trans-15 C18:3 (white color) in the milk fat of ewes fed diets supplemented with 0 (Control), 6 (6% Linseed), and 12% of linseed (12% Linseed), a TMR and a pasture-based diet (Pasture).
Mass spectra obtained after GC by conventional electron impact MS of FAME exhibited a molecular ion of m/z 292, supporting a C18:3 structure for the unknown compound (tR = 88.3 min) and discarding a C18:2 moiety. However, spectra of FAME, the usual derivatives used in GC FA analysis, lack sufficient information to further characterize the structure.
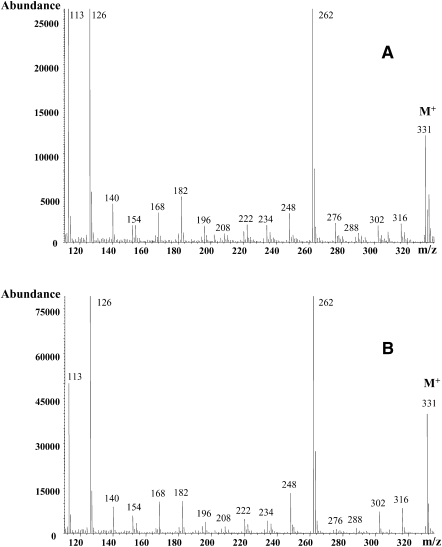
DMOX derivative mass spectrum of the unknown C18:3 peak indicated a molecular ion at m/z 331, confirming the octadecatrienoic acid structure (Fig. 4A). The strong ion at m/z 262 obtained with this derivative supports the location of the 11-15 double bond system; such ion fragment is usually observed from bis-methylene interrupted FA, resulting in the facilitated formation of two stabilized allylic radical fragments (11, 22). The presence of the m/z 262 intense ion in the unknown C18:3 (Fig. 4A) coincides with the spectrum of the peak of RLnA (Fig. 4B). In previous studies (4, 23), a prominent m/z 262 ion has also been found in RLnA DMOX mass spectra. The mass spectrum of the picolinyl ester derivative of the unknown C18:3 compound (data not shown) presented a prominent ion at m/z 300, which would support a 11-15 double-bond system too. Furthermore, both C18:3 spectra (RLnA and unknown C18:3 FA) resembled each other and were similar to the RLnA picolinyl ester spectrum reported by Destaillats et al. (2). Thus, electron impact MS of the unknown C18:3 compound indicates a similarity to RLnA.
Fig. 4.
Electron impact ionization mass spectra of 4,4-dimethyloxazoline derivatives of cis-9 trans-11 trans-15 C18:3 (A) and cis-9 trans-11 cis-15 C18:3 (B) isomers in milk fat samples from ewes fed a diet supplemented with 12% linseed in dry matter.
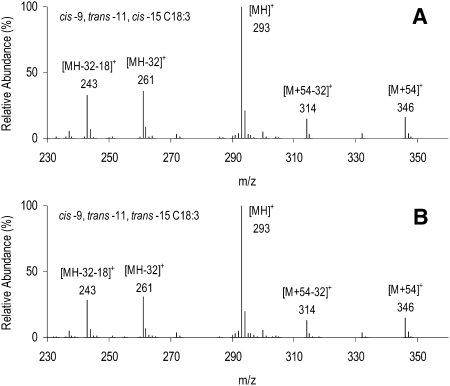
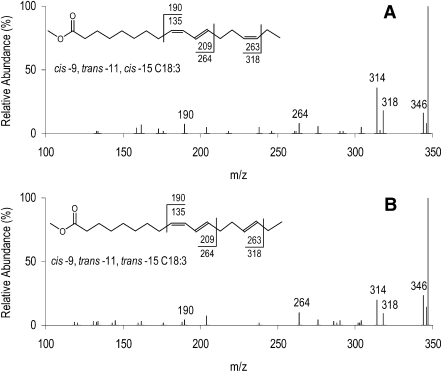
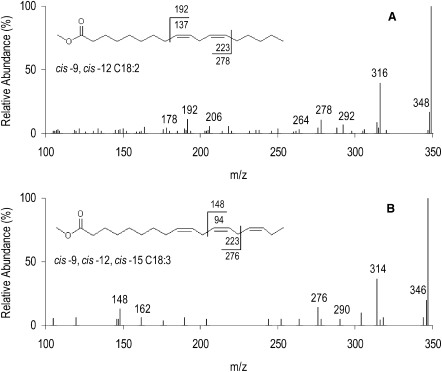
The unknown C18:3 FAME accounting for up to 0.21% (Table 1) of total FA in milk fat is assigned to the structure cis-9 trans-11 trans-15 C18:3, a geometric isomer of cis-9 trans-11 cis-15 C18:3. This identification is based on several lines of evidence, including CACI-MS spectra, the [M+54]+/[M+54-32]+ ratio, CACI-MS/MS spectra, and GC retention time. The ratio of [M+54]+/[M+54-32]+ in CACI-MS arises by loss of methanol from the M+54 adduct, and the ratio is indicative of double-bond conjugation (5, 14). CACI-MS spectra of RLnA and the unknown C18:3 peak are presented in Fig. 5. CACI-MS analysis of RLnA yielded a spectrum characteristic of a C18:3 FAME, with a [M+54]+/[M+54-32]+ ratio of 1.23 typical of partially conjugated FA. The CACI-MS spectrum of the unknown C18:3 peak yielded similar ions with respect to mass and intensity, and the ratio of [M+54]+/[M+54-32]+ ratio was 1.17, also consistent with assignment as a partially conjugated C18:3 FAME (14). Figure 6 presents the CACI-MS/MS spectra for RLnA and the unknown C18:3 peak. The three predominant diagnostic ions, m/z 190, 264, and 318, are evidence for the presence of double bonds at carbon numbers 9, 11, and 15. For comparison, spectra of nonconjugated C18:2 and C18:3 FAME with double bonds located at carbon numbers 9, 12, and 15 are presented as Fig. 7A and B. The ratio of diagnostic ions (264:190) for the unknown C18:3 peak is consistent with the cis-9 trans-11 configuration of RA, where intensity for the α diagnostic ion (m/z 264) is greater than intensity for the ω diagnostic ion (m/z 192) (Fig. 2B). The lower relative intensity of the m/z 264 ion for RLnA, compared with RA and the unknown C18:3 peak, results from the cis configuration at carbon number 15 (5). For the unknown C18:3 peak, the lower intensity of the m/z 318 ion, compared with RLnA, and the relative elution order of the unknown C18:3 peak indicate a trans double-bond configuration located at carbon number 15. These results are uniquely consistent with a structure for the unknown C18:3 peak as cis-9 trans-11 trans-15 C18:3.
Fig. 5.
Covalent adduct chemical ionization mass spectra of RLnA (cis-9 trans-11 cis-15 C18:3; A) and cis-9 trans-11 trans-15 C18:3 (B) FAMEs from milk fat of ewes fed a diet supplemented with 12% linseed in dry matter and revealing five diagnostic ions at m/z 243 ([MH-32-18]+), 261 ([MH-32]+), 293 ([MH]+), 314 ([M+54-32]+), and 346 ([M+54]+). Molecular ion is represented as M.
Fig. 6.
CACI-MS/MS of RLnA (cis-9 trans-11 cis-15 C18:3; A) and cis-9 trans-11 trans-15 C18:3 (B) FAMEs from milk fat of ewes fed a diet supplemented with 12% linseed in dry matter and revealing three diagnostic ions at m/z 190, 264, and 318 (precursor ion m/z = 348). Values associated with the FAME structure represent fragmentation with and without (1-methylenimino)-1-ethenylium adduct. Values ± 14 m/z units from the diagnostic ions represent alternative fragmentation patterns about the double bonds and are characteristic for identifying diagnostic ions.
Fig. 7.
CACI-MS/MS of C18:2n-6 (A) and C18:3n-3 (B) FAME from milk fat of ewes fed a diet supplemented with 12% linseed in dry matter. A reveals characteristic diagnostic ions at m/z 192 and 278 (precursor ion m/z = 348). B reveals characteristic diagnostic ions at m/z 148 and 276. Values associated with the FAME structure represent fragmentation with and without (1-methylenimino)-1-ethenylium adduct. Values ± 14 m/z units from the diagnostic ions represent alternative fragmentation patterns about the double bonds and are characteristic for identifying diagnostic ions.
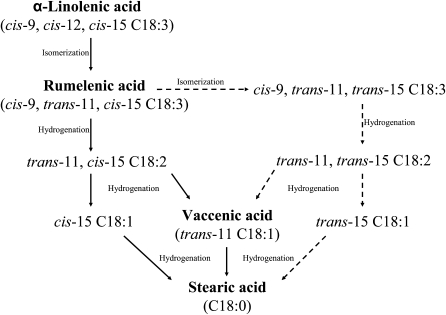
The presence of cis-9 trans-11 trans-15 C18:3 in dairy products or ruminal fluid has not previously been reported. The classic pathway of α-linolenic biohydrogenation postulated by Wilde and Dawson (1) and the results of more recent research (9, 24) do not mention a putative pathway of formation of this partially conjugated PUFA. In view of the fact that the quantity of the newly identified C18:3 isomer increased in parallel with RLnA in ewes fed a diet supplemented with α-linolenic acid (Fig. 3), a plausible pathway for formation of the newly identified C18:3 isomer would be by isomerization of the cis-15 double bond in RLnA (Fig. 8). Subsequently, cis-9 trans-11 trans-15 C18:3 could be hydrogenated to trans-11 trans-15 C18:2 and trans-15 C18:1 through the same enzymatic pathway used to convert RLnA to trans-11 cis-15 C18:2 and cis-15 C18:1.
Fig. 8.
Ruminal biohydrogenation pathways of α-linolenic acid (cis-9 cis-12 cis-15 C18:3). Solid lines represent the major metabolic pathway (1), whereas the dotted arrows represent putative biohydrogenation pathways, including the unknown intermediates detected in this study.
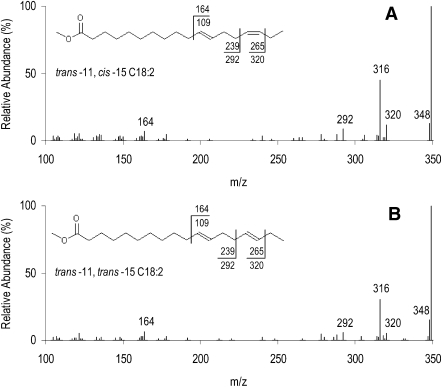
A detailed study by GC-FID of the chromatographic region comprising nonconjugated C18:2 isomers (from 61.8 to 69.0 min) revealed the presence of trans-11 cis-15 C18:2 (tR = 67.5 min) and another unknown C18:2 peak eluting 6 min before (tR = 61.8 min) with α-linolenic acid-enriched diets. Figure 9 presents spectra for the CACI-MS/MS analysis of both FA. The two spectra have similar patterns of fragmentation, including two diagnostic ions at m/z 164 and 320 and a third ion (m/z 292) representing fragmentation between the two double bonds. These spectra demonstrate that the unknown C18:2 peak is also an 11-15 C18:2 FAME. Additional analyses and comparisons with a C18:2 mixed isomer standard did not successfully yield diagnostic ions and ion ratios enabling geometric assignment of this nonconjugated C18:2 FAME based on CACI-MS/MS spectra alone. Previous reports, however, have identified in ruminal lipid (21) and milk fat (25) of lactating cows a FAME corresponding to trans-11 trans-15 C18:2. Although a cis-trans geometrical configuration should not be completely discarded the difference of the retention times between the unknown 11-15 C18:2 (tR = 61.8 min) and trans-11 cis-15 C18:2 (tR = 67.5 min) lead us to conclude that the unknown C18:2 FAME is trans-11 trans-15 C18:2. Thus, in this study, the presence of trans-11 trans-15 C18:2 in milk fat of ewes fed high levels of α-linoleic acid would be consistent with the biohydrogenation of cis-9 trans-11 trans-15 C18:3 and further supports its novel assignment. Next steps in the biohydrogenation of trans-11 trans-15 C18:2 could potentially lead to the formation of vaccenic acid, trans-15 C18:1, and thereafter to stearic acid (Fig. 8).
Fig. 9.
CACI-MS/MS of trans-11 cis-15 C18:2 (A) and trans-11 trans-15 C18:2 (B) methyl esters from milk fat of ewes fed a diet supplemented with 12% linseed in dry matter and revealing three characteristic diagnostic ions at m/z 164, 292, and 320. Values associated with FAME structure represent fragmentation with and without (1-methylenimino)-1-ethenylium adduct.
In this study, the amounts of cis-9 trans-11 trans-15 C18:3 present in the milk samples appear negligible in comparison with the content of major milk FA (Fig. 1; Table 1). However, most of the C18 conjugated FA found in dairy fat are present at <0.25%, and their bioactivities may be potent. For instance, trans-10 cis-12 C18:2 at <0.2% in milk fat is sufficient to induce milk fat depression (26, 27). Other CLA isomers found in similar percentages in milk fat, trans-9 cis-11 C18:2 for instance, also influence milk fat synthesis in lactating cows (28). Concerning the conjugated C18:3 FA, information in the literature remains very limited. The physiological role of this family of FAs is still unknown, but potential health benefits or adverse effects of some of these C18:3 isomers are plausible (29, 30). Additionally, a more comprehensive knowledge of the molecular structure of these minor compounds would help to clarify the ruminal biohydrogenation pathways of PUFA and lipid metabolism in ruminants.
In conclusion, two different MS approaches in conjunction with GC were used for the complete structural identification of cis-9 trans-11 trans-15 C18:3, a new partially conjugated octadecatrienoic acid detected in milk fat from ewes fed diets enriched in α-linolenic acid. Electron impact GC-MS of DMOX derivatives and picolinyl esters provided information for double-bond positions in the molecule, whereas CACI-MS/MS confirmed such structure and provided some evidence for geometrical configuration. The presence of trans-11 trans-15 C18:2 is evidence for a putative alternative biohydrogenation pathway. However, more studies will be needed to link the presence of this C18:3 isomer to the biohydrogenation pathways of α-linolenic acid and its intermediates in ruminants.
Acknowledgments
The authors thank Gonzalo Hervás from the Instituto de Ganadería de Montaña (León, Spain), Alex Bach from the Institut de Recerca i Tecnologia Agroalimentàries (Barcelona, Spain), and Alfonso García and Juan Carlos Rodríguez (Lodyn S.L., Ciudad Real, Spain) for supplying ewe milk samples. The authors also thank Peter Lawrence (Cornell University) for insightful discussions.
Footnotes
Abbreviations:
- Ag+-HPLC
- silver ion high performance liquid chromatography
- CLA
- conjugated linoleic acid
- CACI-MS
- covalent adduct chemical ionization mass spectrometry
- CACI-MS/MS
- covalent adduct chemical ionization tandem mass spectrometry
- DMOX
- dimethyloxazoline
- FAME
- fatty acid methyl esters
- FID
- flame ionization detector
- RA
- rumenic acid, cis-9 trans-11 C18:2
- RLnA
- rumelenic acid, cis-9 trans-11 cis-15 C18:3
- TMR
- total mixed ration
- tR
- retention time
This work was supported by the Ministerio de Ciencia e Innovación (Projects AGL2008-04805-CO2-01 and Consolider CSD2007-063), the Comunidad Autónoma de Madrid (Project S-505/AGR-0153), and by National Institutes of Health Grant GM-071534. C. Tyburczy was supported by National Institutes of Health Grant DK07158. Its contents are solely the responsibility of the authors and do not necessarily represent the official views of the National Institutes of Health.
REFERENCES
- 1.Wilde P. F., Dawson R. M. 1966. The biohydrogenation of α-linolenic acid and oleic acid by rumen microorganisms. Biochem. J. 98: 469–475 [DOI] [PMC free article] [PubMed] [Google Scholar]
- 2.Destaillats F., Trottier J. P., Galvez J. M. G., Angers P. 2005. Analysis of α-linolenic acid biohydrogenation intermediates in milk fat with emphasis on conjugated linoleic acid. J. Dairy Sci. 88: 3231–3239 [DOI] [PubMed] [Google Scholar]
- 3.Akraim F., Nicot M.C., Juaneda P., Enjalbert F. 2007. Conjugated linolenic acid (CLnA), conjugated linoleic acid (CLA) and other biohydrogenation intermediates in plasma and milk fat of cows fed raw or extruded linseed. Animal. 1: 835–843 [DOI] [PubMed] [Google Scholar]
- 4.Plourde M., Destaillats F., Chouinard P. Y., Angers P. 2007. Conjugated α-linolenic acid isomers in bovine milk and muscle. J. Dairy Sci. 90: 5269–5275 [DOI] [PubMed] [Google Scholar]
- 5.Michaud A. L., Yurawecz M. P., Delmonte P., Corl B. A., Bauman D. E., Brenna J. T. 2003. Identification and characterization of conjugated fatty acid methyl esters of mixed double bond geometry by acetonitrile chemical ionization tandem mass spectrometry. Anal. Chem. 75: 4925–4930 [DOI] [PubMed] [Google Scholar]
- 6.Brenna J. T.2006. Structural analysis of unsaturated fatty acid methyl ester isomers with acetonitrile covalent-adduct chemical ionization (CACI) tandem mass spectrometry. Lipid Analysis and Lipidomics. Mossoba M. M., Kramer J. K. G., Brenna J. T., McDonald R. E. AOCS Press, Champaign, IL: 157–172 [Google Scholar]
- 7.Michaud A. L., Brenna J. T. 2006. Structural characterization of conjugated linoleic acid methyl esters with acetonitrile chemical ionization tandem mass spectrometry. Advances in Conjugated Linoleic Acid, Vol. 3. Yurawecz M. P., Kramer J. K. G., Gudmundsen O., Pariza M. W., Banni S., AOCS Press, Champaign, IL: 119–140 [Google Scholar]
- 8.Alves S. P., Bessa R. J. B. 2007. Identification of cis-12 cis-15 octadecadienoic acid and other minor polyenoic fatty acids in ruminant fat. Eur. J. Lipid Sci. Technol. 109: 879–883 [Google Scholar]
- 9.Bessa R. J. B., Alves S. P., Jerónimo E., Alfaia C. A., Prates J. A. M., Santos-Silva J. 2007. Effect of lipid supplements on ruminal biohydrogenation intermediates and muscle fatty acids in lambs. Eur. J. Lipid Sci. Technol. 109: 868–878 [Google Scholar]
- 10.ISO-IDF (2002). Milk fat-preparation of fatty acid methyl esters. International Standard ISO 15884-IDF 182:2002 [Google Scholar]
- 11.Fay L., Richli U. 1991. Location of double bonds in polyunsaturated fatty acids by gas chromatography-mass spectrometry after 4,4-dimethyloxazoline derivatization. J. Chromatogr. 541: 89–98 [Google Scholar]
- 12.Destaillats F., Angers P. 2005. One-step methodology for the synthesis of FA picolinyl esters from intact lipids. J. Am. Oil Chem. Soc. 79: 253–256 [Google Scholar]
- 13.Van Pelt C. K., Brenna J. T. 1999. Acetonitrile chemical ionization tandem mass spectrometry to locate double bonds in polyunsaturated fatty acid methyl esters. Anal. Chem. 71: 1981–1989 [DOI] [PubMed] [Google Scholar]
- 14.Lawrence P., Brenna J. T. 2006. Acetonitrile covalent adduct chemical ionization mass spectrometry for double bond localization in non-methylene-interrupted polyene fatty acid methyl esters. Anal. Chem. 78: 1312–1317 [DOI] [PubMed] [Google Scholar]
- 15.Luna P., Fontecha J., Juárez M., de la Fuente M. A. 2005. Changes in the milk and cheese fat composition of ewes fed commercial supplements containing linseed with special reference to the CLA content and isomer composition. Lipids. 40: 445–454 [DOI] [PubMed] [Google Scholar]
- 16.Luna P., Bach A., Juárez M., de la Fuente M. A. 2008. Influence of diets rich in flax seed and sunflower oil on the fatty acid composition of ewes' milk fat especially on the content of conjugated linoleic acid, n-3 and n-6 fatty acids. Int. Dairy J. 18: 99–107 [Google Scholar]
- 17.Loor J. J., Ueda K., Ferlay A., Chilliard Y., Doreau M. 2004. Biohydrogenation, duodenal flow, and intestinal digestibility of trans fatty acids and conjugated linoleic acids in response to dietary forage:concentrate ratio and linseed oil in dairy cows. J. Dairy Sci. 87: 2472–2485 [DOI] [PubMed] [Google Scholar]
- 18.Loor J. J., Ferlay A., Ollier A., Ueda K., Doreau M., Chilliard Y. 2005. High-concentrate diets and polyunsaturated oils alter trans and conjugated isomers in bovine rumen, blood, and milk. J. Dairy Sci. 88: 3986–3999 [DOI] [PubMed] [Google Scholar]
- 19.Loor J. J., Ferlay A., Ollier A., Ueda K., Doreau M., Chilliard Y. 2005. Relationship among trans and conjugated fatty acids and bovine milk fat yield due to dietary concentrate and linseed oil. J. Dairy Sci. 88: 726–740 [DOI] [PubMed] [Google Scholar]
- 20.Fritsche J., Yurawecz M. P., Pawlosky R., Flanagan V. P., Steinhart H., Ku Y. 2001. Spectroscopic characterization of unusual conjugated linoleic acid (CLA) isomers. J. Sep. Sci. 24: 59–61 [Google Scholar]
- 21.Shingfield K. J., Ahvenjärvi S., Toivonen V., Vanhatalo P., Huhtanen P., Griinari J. M. 2008. Effect of incremental levels of sunflower-seed oil in the diet on ruminal lipid metabolism in lactating cows. Br. J. Nutr. 99: 971–983 [DOI] [PubMed] [Google Scholar]
- 22.Christie W. W.1998. Gas chromatography-mass spectrometry methods for structural analysis of fatty acids. Lipids. 33: 343–353 [DOI] [PubMed] [Google Scholar]
- 23.Winkler K., Steinhart H. 2001. Identification of conjugated isomers of linolenic acid and arachidonic acid in cheese. J. Sep. Sci. 24: 663–668 [Google Scholar]
- 24.Chilliard Y., Glasser F., Ferlay A., Bernard L., Rouel J., Doreau M. 2007. Diet, rumen biohydrogenation and nutritional quality of cow and goat milk fat. Eur. J. Lipid Sci. Technol. 109: 828–855 [Google Scholar]
- 25.Shingfield K. J., Reynolds C. K., Hervás G., Griinari J. M., Grandison A. S., Beever D. E. 2006. Examination of the persistency of milk fatty acid composition responses to fish oil and sunflower oil in the diet of dairy cows. J. Dairy Sci. 89: 714–732 [DOI] [PubMed] [Google Scholar]
- 26.De Veth M. J., Griinari J. M., Pfeiffer A. M., Bauman D. E. 2004. Effect of CLA on milk fat synthesis in dairy cows: comparison of inhibition by methyl esters and free fatty acids, and relationships among studies. Lipids. 39: 365–372 [DOI] [PubMed] [Google Scholar]
- 27.Lock A. L., Rovai M., Gipson T. A., de Veth M. J., Bauman D. E. 2008. A conjugated linoleic acid supplement containing trans-10 cis-12 conjugated linoleic acid reduces milk fat synthesis in lactating goats. J. Dairy Sci. 91: 3291–3299 [DOI] [PubMed] [Google Scholar]
- 28.Perfield J. W., II, Lock A. L., Griinari J. M., Sæbø A., Delmonte P., Dwyer D. A., Bauman D. E. 2007. Trans-9 cis-11 conjugated linoleic acid reduces milk fat synthesis in lactating dairy cows. J. Dairy Sci. 90: 2211–2218 [DOI] [PubMed] [Google Scholar]
- 29.Koba K., Belury M. A., Sugano M. 2007. Potential health benefits of conjugated trienoic acids. Lipid Technol. 19: 200–203 [Google Scholar]
- 30.Plourde M., Ledoux M., Grégoire S., Portois S., Fontaine J. J., Carpentier Y. A., Angers P., Chardigny J. M., Sébédio J. L. 2007. Adverse effects of conjugated alpha-linolenic acids (CLnA) on lipoprotein profile on experimental atherosclerosis in hamsters. Anim. 1: 905–910 [DOI] [PubMed] [Google Scholar]


