Abstract
The abundance of Na transport proteins in the luminal membrane of the rat kidney was assessed using in situ biotinylation and immunoblotting. When animals were fed an Na-deficient diet for 1 wk, the amounts of epithelial Na channel (ENaC) β-subunit (β-ENaC) and γ-subunit (γ-ENaC) and Na-Cl cotransporter (NCC) protein in the surface fraction increased relative to controls by 1.9-, 3.5-, and 1.5-fold, respectively. The amounts of the luminal Na/H exchanger (NHE3) and the luminal Na-K-2Cl cotransporter (NKCC2) did not change significantly. The increases in ENaC subunits were mimicked by administration of aldosterone for 1 wk, but the increase in NCC was not. When the animals were fed a high-Na (5% NaCl) diet for 1 wk, the surface expression of β-ENaC increased by 50%, whereas that of the other membrane proteins did not change, relative to controls. The biochemical parameter most strongly affected by dietary Na was the abundance of the 65-kDa cleaved form of γ-ENaC at the surface. This increased by 8.5-fold with Na depletion and decreased by 40% with Na loading. The overall 14-fold change reflected regulation of the total abundance of the subunit as well as the fraction of the subunit protein in the cleaved form. We conclude that cleavage of γ-ENaC and its expression at the apical surface play a major role in the regulation of renal Na reabsorption.
Keywords: epithelial sodium channel, sodium-hydrogen exchanger isoform 3, sodium-potassium-chloride cotransporter, sodium-chloride cotransporter, sodium-deficient diet, sodium-rich diet
low dietary salt intake dramatically increases the activity of the epithelial Na channel (ENaC) in many mammalian Na-reabsorbing epithelia, including renal collecting duct and connecting tubule, colon, and urinary bladder (6). The effects are largely attributable to increased levels of circulating mineralocorticoid (19). Single-channel measurements suggest that the upregulation of the rat cortical collecting duct could be largely accounted for by an increase in the number of conducting channels (13). An increase in the abundance of the proteins (ENaC) comprising this channel contributes to, but probably does not fully explain, this regulation (1, 11, 12). Using biotinylation of the intact kidney with a membrane-impermeant reagent, we recently developed a technique to assess the expression of ENaC protein at the surface of renal cells (2). The results indicate that increased surface density of the channels could account for a significant part of the physiological response.
Changes in the abundance of other Na transporters in more proximal segments of the kidney have also been examined (12). The abundance of the thiazide-sensitive Na-Cl cotransporter (NCC) can be increased in response to Na depletion or mineralocorticoid administration (9). However, the regulation of this is complex, and the amount of NCC protein may also be decreased in response to chronically elevated mineralocorticoids (20). In addition, the density of these transporters at the apical surface is not known, and their contributions to Na conservation under these conditions are unclear.
In the present study, we explore the effects of decreasing or increasing dietary Na intake on the surface expression of Na channels and the three major renal Na transporters: the apical Na-H exchanger NHE3, the apical triple (Na-K-2Cl) cotransporter NKCC2, and NCC.
METHODS
Animals.
All procedures using animals were approved by the Institutional Animal Care and Use Committee of Weill-Cornell Medical College. Sprague-Dawley rats (250–300 g) of either sex (Charles River Laboratories, Kingston, NY) raised free of viral infections were used for all experiments. For 6–8 days, animals were fed an Na-deficient rat diet (MP Biomedicals, Solon, OH) or matched diets containing 1% (control) or 5% (high Na) NaCl. In some animals fed the 1% NaCl diet, osmotic minipumps (model 2002, Alza, Palo Alto, CA) were implanted subcutaneously for 6–7 days to increase levels of circulating aldosterone. Aldosterone was dissolved in polyethylene glycol 300 at 2 mg/ml to give a calculated infusion rate of 1 μg/h.
Biotinylation procedure.
The biotinylation procedure has been described in detail previously (2). Briefly, rats were anesthetized with thiobutabarbital sodium (100 mg/kg ip; Inactin, Sigma Chemical, St. Louis, MO), the abdominal cavity was opened, and the entire animal was placed on an ice block. A steady stream of ice-cold PBS kept the abdomen at <7°C. The kidneys were perfused through the aorta by gravity at a rate of ∼10 ml/min with ice-cold solution: for 10–15 min with PBS, for 20–25 min with biotinylation solution [PBS with 4.5 mM KCl (pH 8.0) and 0.5 mg/ml sulfosuccinimidyl-2-(biotinamido) ethyl-1,3-dithiopropionate (sulfo-NHS-biotin, Pierce, Rockford, IL)], and then for 30 min with biotin-quenching solution [PBS in which 25 mM Tris·HCl (pH 8.0) replaced 25 mM NaCl].
The kidneys were minced and processed with a tight-fitting Dounce homogenizer in ice-cold lysis buffer containing 250 mM sucrose, 10 mM triethanolamine (pH 7.4), and the protease inhibitors leupeptin (1 μg/ml) and PMSF (0.1 mg/ml). The homogenate was centrifuged for 10 min at 1,000 g and the supernatant for 6 h at 18,000 g to sediment a total membrane fraction. Aliquots of this fraction containing 3 mg of protein were solubilized in 0.5 ml of buffer containing 150 mM NaCl, 5 mM EDTA, 50 mM Tris·HCl (pH 7.4), and 3% Triton X-100, added to 0.8 ml of a 50% suspension of NeutrAvidin beads (Pierce) at 3.8 mg protein/ml bead suspension, and gently rocked overnight at 4°C. The beads were washed three times with wash buffer [150 mM NaCl, 5 mM EDTA, 50 mM Tris·HCl (pH 7.4), and 1% Triton X-100], twice with high-salt wash buffer [500 mM NaCl, 5 mM EDTA, 50 mM Tris·HCl (pH 7.4), and 0.1% Triton X-100], and twice with no-salt wash buffer (10 mM Tris·HCl, pH 7.4). The supernatant was decanted, and protein bound to the beads was eluted in 60 μl of 4× Laemmli sample buffer plus 25 μl of 0.5 M DTT for 15 min at 90°C. Eluate (10–25 μl) was loaded onto 4–12% Bis-Tris gels for separation by SDS-PAGE.
Antibodies.
Polyclonal antibodies against the α-, β-, and γ-subunits of the rat ENaC were described previously (1, 11). Antisera were purified using peptide-linked agarose bead affinity columns (Sulfolink kit, Pierce). Other antibodies raised against NCC, NKCC2, and NHE3 were purchased from Chemicon International (Millipore, Billerica, MA).
Protein in the membrane fractions was measured by the bicinchoninic acid method (BCA kit, Pierce). Equal amounts of protein (40–50 μg/sample) were solubilized at 70°C for 10 min in Laemmli sample buffer and resolved on 4–12% Bis-Tris gels (Invitrogen, Carlsbad, CA) by SDS-PAGE. For immunoblotting, the proteins were transferred electrophoretically from unstained gels to polyvinylidene difluoride membranes. The membranes were blocked with BSA and then incubated overnight at 4°C with primary antibodies at 1:500 or 1:1,000 dilution for α-, β-, or γ-ENaC subunits and 1:2,000 dilution for NHE3, NKCC2, and NCC. Bound antibodies were detected using anti-rabbit IgG conjugated with alkaline phosphatase and detected with a chemiluminescence substrate (Western Breeze, Invitrogen) on autoradiography film (Denville Scientific, Metuchen, NJ). Band densities were quantitated using a Quantity One densitometer and acquisition system (Bio-Rad Laboratories, Hercules, CA).
Statistical analysis.
To compare expression of proteins, we compared background-subtracted optical densities of individual bands on the same film and used the Student's t-test. P < 0.05 was used to assess statistical significance. Means ± SE are plotted for ratios of the band densities.
RESULTS
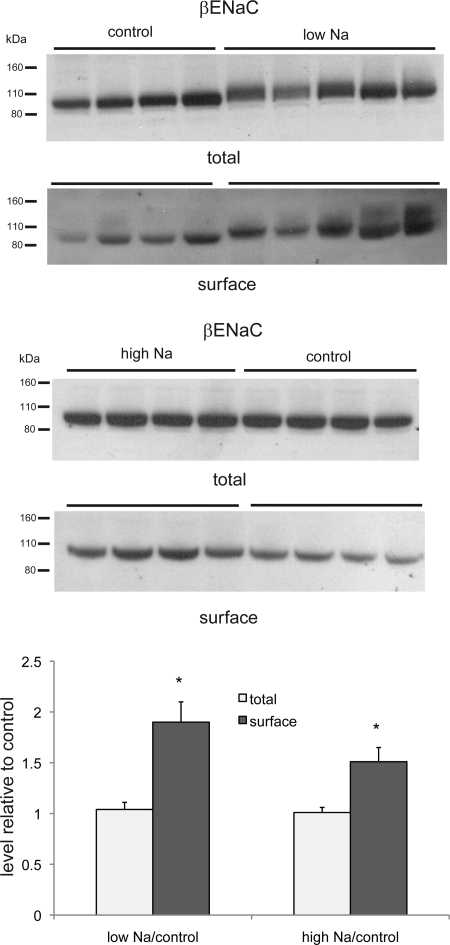
As shown in Fig. 1, we used the biotinylation approach to assess the surface expression of β-ENaC. With a low-Na diet, the total amount of protein increased modestly, whereas the amount in the NeutrAvidin eluate, i.e., the putative surface fraction, increased by about twofold, in good agreement with previous findings (2). The effect of a high-Na diet was more surprising. Here, the amount of β-ENaC in the surface fraction also increased, by ∼50% relative to controls (Fig. 1). There was no significant change in β-ENaC in the total membrane fraction of kidneys from the Na-loaded animals.
Fig. 1.
Epithelial Na channel (ENaC) β-subunit (β-ENaC) protein in total and surface membrane fractions of the kidney of rats fed control-, low-, or high-Na diet. Each lane represents a different animal. Lanes were loaded with 60 μg of total membrane protein or NeutrAvidin eluate from 600 μg of total membrane protein. Densities of bands were normalized to those of control samples. *P < 0.05 (experimental > control).
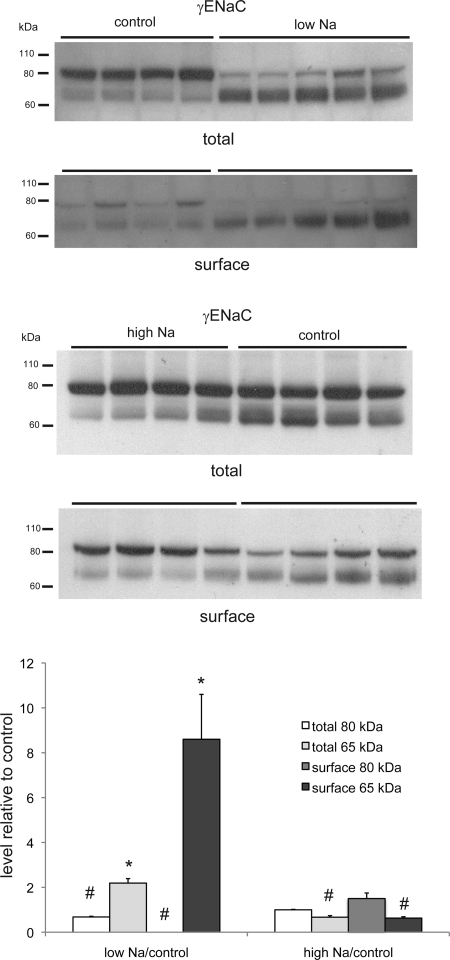
The analysis of the γ-ENaC surface expression was more complex, since this subunit is found in a full-length (85-kDa) and a cleaved (65-kDa) form (Fig. 2). In the case of the low-Na diet, the full-length form was virtually absent from the surface fraction; under normal- and high-Na conditions, there was appreciable expression of the full-length form. In agreement with previous results (2), Na depletion increased the total amount of γ-ENaC at the surface, as well as the fraction in the cleaved form. The high-Na diet had little effect on the overall surface expression but decreased the fraction in the cleaved form.
Fig. 2.
γ-ENaC protein in total and surface membrane fractions of the kidney of rats fed control-, low-, or high-Na diet. Each lane represents a different animal. Lanes were loaded with 75 μg (low-Na vs. control) or 60 μg (high-Na vs. control) of total membrane protein or NeutrAvidin eluate from 600 μg of total membrane protein. Densities of bands were normalized to those of control samples. *P < 0.05 (experimental > control). #P < 0.05 (experimental < control).
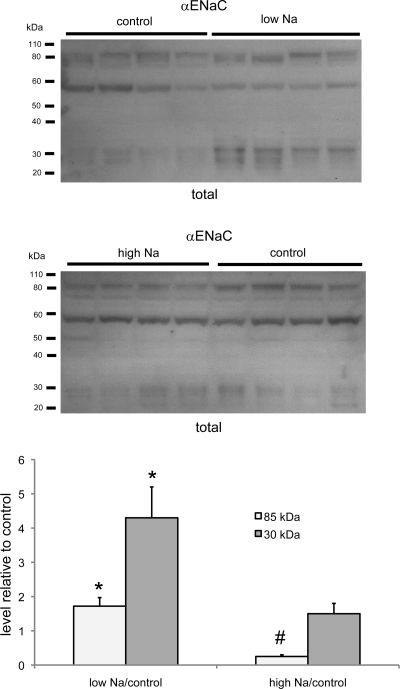
As shown in Fig. 3, α-ENaC in total membrane fractions consists of full-length (85-kDa) and putative cleaved (25- to 30-kDa) forms. The total amounts of both forms in the total membrane fraction increased with Na depletion, as previously described (1). With Na loading, there was a significant decrease in the 85-kDa form, but not the smaller forms. A third ∼60-kDa protein was also detected by the antibody but was not affected by dietary Na intake. We do not know whether it is related to ENaC. As discussed previously (2), the biotinylation technique could not be used to assess the surface expression of α-ENaC.
Fig. 3.
α-ENaC protein in total membrane fraction of the kidney of rats fed control-, low-, or high-Na diet. Each lane represents a different animal. Lanes were loaded with 50 μg of total membrane protein. Densities of bands were normalized to those of control samples. *P < 0.05 (experimental > control). #P < 0.05 (experimental < control).
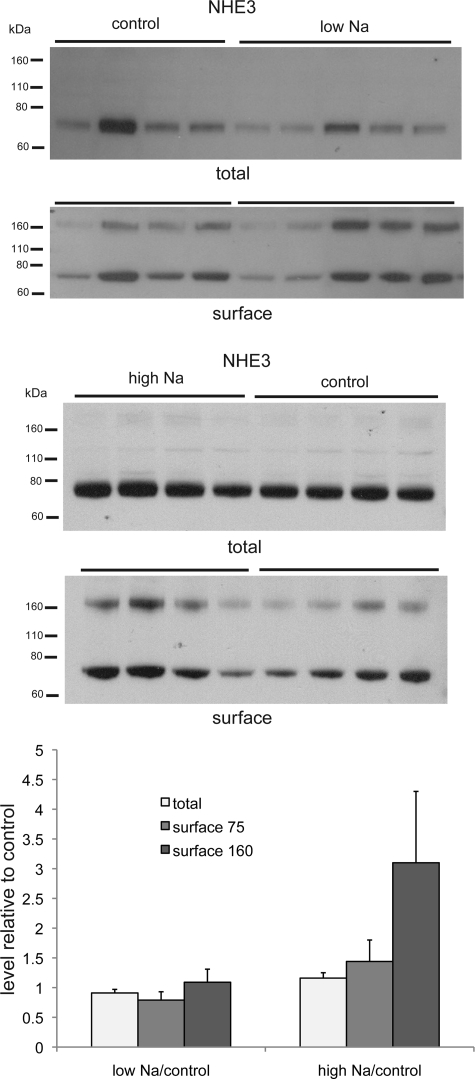
The antibody directed against NHE3 in the luminal membranes of the proximal tubule and the thick ascending limb of Henle detects a single prominent band at 70 kDa in the total membrane fraction (Fig. 4). In the NeutrAvidin eluates, a second ∼160- to 170-kDa band, possibly a dimer of the protein, is evident. Although there was a surprising degree of variability in the amount of the protein from one animal to another, there was no consistent change in the amounts of the 70-kDa form in the total membranes or the large or the small form in the surface fraction.
Fig. 4.
Apical Na-H exchanger (NHE3) protein in total and surface membrane fractions of the kidney of rats fed control-, low-, or high-Na diet. Each lane represents a different animal. Lanes were loaded with 35 μg (low-Na vs. control) or 40 μg (high Na vs. control) of total membrane protein or NeutrAvidin eluate from 500 μg of total membrane protein. Densities of bands were normalized to those of control samples. Differences were not statistically significant.
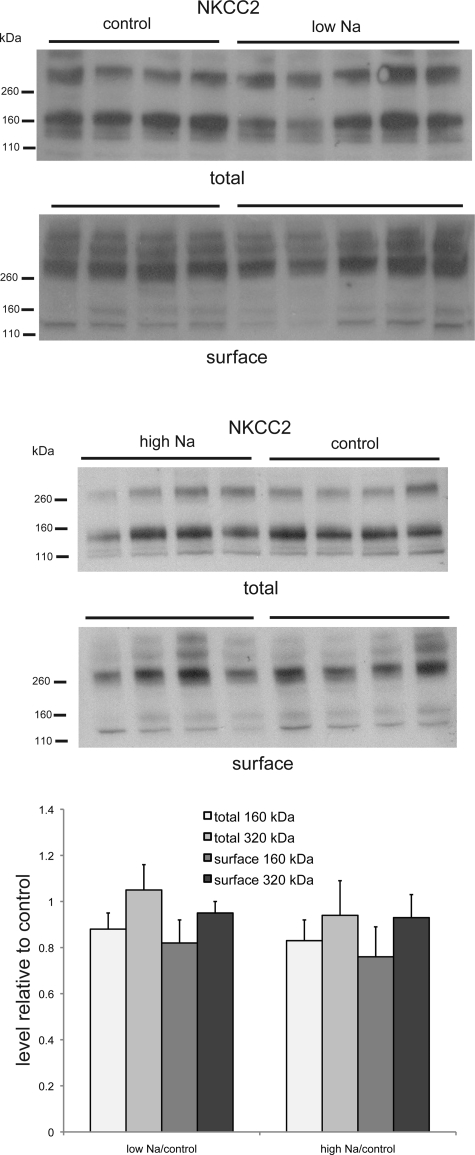
A similar pattern was observed for the loop diuretic-sensitive luminal form of the triple cotransporter NKCC2 (Fig. 5). In the total membrane fraction, the predominant form of the protein migrates at 160 kDa, consistent with the predicted size of the monomer. However, a larger protein of approximately twice the size is also observed. In the surface membrane fraction, this is the predominant form of the protein, and little of the putative monomer is detected. Neither salt deprivation nor salt loading has a consistent effect on the total or surface expression of NKCC2.
Fig. 5.
Na-K-2Cl cotransporter (NKCC2) protein in total and surface membrane fractions of the kidney of rats fed control-, low-, or high-Na diet. Each lane represents a different animal. Lanes were loaded with 35 μg (low-Na vs. control) or 40 μg (high Na vs. control) of total membrane protein or NeutrAvidin eluate from 500 μg of total membrane protein. Densities of bands were normalized to those of control samples. Differences were not statistically significant.
The thiazide-sensitive NCC protein was also present in the monomeric form migrating at 150 kDa as well as a larger, possibly dimeric, form of about twice the size (Fig. 6). In the surface fraction, almost all the protein was in the larger form. Although there was no significant effect of a low-Na diet on the overall abundance of NCC, in the surface fraction there was a modest but consistent increase. With the high-Na diet, no effect on NCC in either fraction was evident.
Fig. 6.
Na-Cl cotransporter (NCC) protein in total and surface membrane fractions of the kidney of rats fed control-, low-, or high-Na diet or treated with aldosterone. Each lane represents a different animal. Lanes were loaded with 35 μg (low-Na vs. control), 40 μg (high-Na vs. control), or 50 μg (aldosterone vs. control) of total membrane protein or NeutrAvidin eluate from 600 μg (low-Na vs. control) or 500 μg (high-Na vs. control, aldosterone vs. control) of total membrane protein. Densities of bands were normalized to those of control samples. *P < 0.05 (experimental > control).
Most, but not all, effects of a low-Na diet on ENaC activity (13), ENaC protein (1, 11), and ENaC surface expression (2) are reproduced by infusion of the animals with aldosterone. In the case of NCC, we observed no effect of aldosterone treatment on the abundance of the protein in the surface fraction (Fig. 6). Therefore, the effect of Na depletion on this transporter may be aldosterone independent.
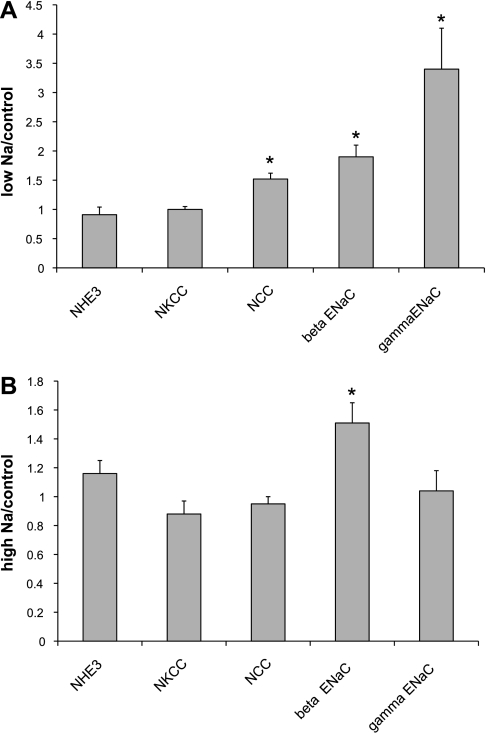
The effects of Na depletion and Na loading on surface expression are summarized in Fig. 7. With Na depletion, we find increases in β-ENaC, γ-ENaC, and NCC. With Na loading, we see a paradoxical increase in β-ENaC.
Fig. 7.
Quantitation of effects of diet on apical Na transport proteins. Densities of immunoblots of surface fractions isolated from kidneys of rats fed low-Na diet (A) or high-Na diet (B) were normalized to values from control animals. For γ-ENaC, densities in 80- and 65-kDa forms were summed. For transporters, upper and lower band densities were summed. Values are means ± SE for ≥4 animals under each condition.
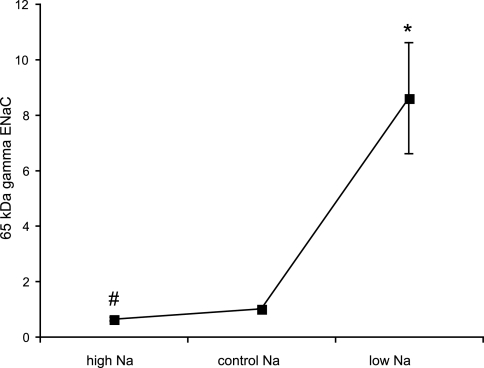
The largest biochemical change with respect to dietary Na intake that we have measured is in the abundance of the cleaved form of γ-ENaC in the surface membrane fraction (Fig. 8). Overall, we find a 14-fold change in the abundance that is more pronounced between the control and Na-depleted animals (8.5-fold) than between the Na-loaded and control animals (1.7-fold). The overall change is roughly equally distributed between an increase in the total surface abundance of γ-ENaC and in the fraction of the protein at the surface that is in the cleaved form.
Fig. 8.
Effect of dietary Na on abundance of 65-kDa form of γ-ENaC in surface fractions. Densities were normalized to those obtained from animals fed control diet, which were set to 1.0. Values are means ± SE for ≥4 animals under each condition. *P < 0.05 (experimental > control). #P < 0.05 (experimental < control).
DISCUSSION
ENaC surface expression.
The increases in the surface expression of β- and γ-ENaC with Na depletion confirm a previous report using the biotinylation approach (2). In both studies, the amount of β-ENaC at the surface approximately doubled, whereas the amount of total γ-ENaC increased somewhat more, by three- to fourfold. The technique could not be used to assess the surface expression of α-ENaC; the full-length form of the subunit could not be detected in the biotinylated fraction, whereas the 25- to 30-kDa cleaved form, which is recognized by our antibody, exhibited nonspecific binding to the NeutrAvidin beads.
In animals fed a high-Na diet, we observed a paradoxical increase in β-ENaC at the surface. The physiological significance of this effect is unclear. However, since total surface γ-ENaC did not change, the observation does support the idea that the trafficking of the two subunits can be dissociated. This notion has been raised previously on the basis of measurements of subunit lifetimes in A6 cells (21).
Surface expression of Na transporters.
We found no consistent effect of dietary Na on the overall amount of NCC protein. Previous studies documented increases (9) and decreases (20) in the expression of this transporter under conditions of elevated mineralocorticoid status; clearly, the regulation of this protein is complex. We did find, however, an increase in the amount of NCC at the surface of the cells with Na depletion, suggesting that trafficking of the transporter can be upregulated to help conserve Na. This effect was somewhat smaller than that observed for the ENaC subunits. It was not reproduced by treatment with aldosterone, suggesting that it is independent of mineralocorticoids, although it is possible that variability among animals and a small sample size may have obscured a small effect of the steroid. We did not see a change in surface NCC with Na loading. Sandberg et al. (16) and Yang et al. (22) reported decreased total amounts of this protein with a high-Na diet, as well as an apparent redistribution from surface to intracellular membranes. It is possible that the discrepancy arises from the longer period of Na loading (3 wk vs. 1 wk) in those studies compared with ours.
We did not see consistent changes with dietary Na manipulation in the total pool of the exchanger NHE3 or the cotransporter NKCC2. This finding is in agreement with previous studies (12, 22). We also found no consistent change in the surface expression of these transporters. Previously, a redistribution of NHE3 was detected with a high-Na diet (22). However, this movement was thought to involve translocation of the protein from the tips to the base of the brush border of the proximal tubule. This may not have altered the accessibility of the protein to biotinylation, so it is not surprising that our method did not detect a difference. These findings do not rule out a role of these transporters in maintaining Na balance. They do suggest that if there is such a role, it does not involve large changes in surface expression. However, we cannot rule out labile changes that might be lost during the time required for preparing the kidneys for the biotinylation procedure (∼30 min).
Cleaved γ-ENaC at the surface.
The largest biochemical change in the surface fraction of the renal cells was in the amount of the cleaved form of γ-ENaC. This is probably a key parameter, since cleavage of this subunit has been correlated with activation of the channels (10, 15). The 14-fold increase in the abundance of the 65-kDa form comprised a ∼3.5-fold increase in the total amount of γ-ENaC at the surface and a ∼4-fold increase in the percentage of the subunit in the cleaved form. The increase in overall expression occurs mainly in the transition from control-Na to low-Na diets. Although the amounts of the 65-kDa fragment increased with low Na and decreased with high Na in the diet, reciprocal changes were seen in the 80-kDa, presumably full-length, form of the protein. Thus the percentage of the subunit in the cleaved form increases with the low-Na diet and decreases with the high-Na diet. This strongly suggests that the cleavage process is regulated. These data do not tell us whether this regulation takes place within the cell by a furin-like enzyme (8) or at the surface of the cell by a CAP-like enzyme (18) or a soluble protease (7, 14, 17).
The cleaved form of γ-ENaC is the only biochemical parameter that comes close to mimicking the very large increase in Na channel activity observed with decreasing dietary Na intake (5, 13). The correlation with activity is not perfect, however, because nearly all the increase in activity is observed after salt intake is decreased from control- to low-Na levels, although there is a significant change in the γ-ENaC surface expression after salt intake is increased. To put it another way, we see the 65-kDa ENaC protein in the membrane under control-Na conditions, but no channel activity. This dissociation could indicate that another process is required for activation. However, it is also possible that channel activity is lost when the kidneys are removed from the animals and tubules are isolated for electrophysiological assays. The finding that rats fed a control diet respond to amiloride with natriuresis (3, 4) implies that at least some channels are active in vivo under these conditions. The changes in the 65-kDa γ-ENaC subunit may therefore accurately reflect modulation of channel activity in the intact animal.
GRANT
This study was supported by National Institute of Diabetes and Digestive and Kidney Diseases Grant DK-59659.
REFERENCES
- 1.Ergonul Z, Frindt G, Palmer LG. Regulation of maturation and processing of ENaC subunits in the rat kidney. Am J Physiol Renal Physiol 291: F683–F693, 2006 [DOI] [PubMed] [Google Scholar]
- 2.Frindt G, Ergonul Z, Palmer LG. Surface expression of epithelial Na channel protein in rat kidney. J Gen Physiol 131: 617–627, 2008 [DOI] [PMC free article] [PubMed] [Google Scholar]
- 3.Frindt G, McNair T, Dahlmann A, Jacobs-Palmer E, Palmer LG. Epithelial Na channels and the short-term renal response to salt deprivation. Am J Physiol Renal Physiol 283: F717–F726, 2002 [DOI] [PubMed] [Google Scholar]
- 4.Frindt G, Palmer LG. K+ secretion in rat kidney: Na+ channel-dependent and -independent mechanisms. Am J Physiol Renal Physiol 297: F389–F396, 2009 [DOI] [PMC free article] [PubMed] [Google Scholar]
- 5.Frindt G, Palmer LG. Na channels in the rat connecting tubule. Am J Physiol Renal Physiol 286: F669–F674, 2004 [DOI] [PubMed] [Google Scholar]
- 6.Garty H, Palmer LG. Epithelial Na+ channels: function, structure, regulation. Physiol Rev 77: 359–396, 1997 [DOI] [PubMed] [Google Scholar]
- 7.Harris M, Firsov D, Vuagniaux G, Stutts MJ, Rossier BC. A novel neutrophil elastase inhibitor prevents elastase activation and surface cleavage of the epithelial sodium channel expressed in Xenopus laevis oocytes. J Biol Chem 282: 58–64, 2007 [DOI] [PubMed] [Google Scholar]
- 8.Hughey RP, Bruns JB, Kinlough CL, Harkleroad KL, Tong Q, Carattino MD, Johnson JP, Stockand JD, Kleyman TR. Epithelial sodium channels are activated by furin-dependent proteolysis. J Biol Chem 279: 18111–18114, 2004 [DOI] [PubMed] [Google Scholar]
- 9.Kim GH, Masilamani S, Turner R, Mitchell C, Wade JB, Knepper MA. The thiazide-sensitive Na-Cl cotransporter is an aldosterone-induced protein. Proc Natl Acad Sci USA 95: 14552–14557, 1998 [DOI] [PMC free article] [PubMed] [Google Scholar]
- 10.Kleyman TR, Carattino MD, Hughey RP. ENaC at the cutting edge: regulation of epithelial sodium channels by proteases. J Biol Chem 284: 20447–20451, 2009 [DOI] [PMC free article] [PubMed] [Google Scholar]
- 11.Masilamani S, Kim GH, Mitchell C, Wade JB, Knepper MA. Aldosterone-mediated regulation of ENaC α-, β-, and γ-subunit proteins in rat kidney. J Clin Invest 104: R19–R23, 1999 [DOI] [PMC free article] [PubMed] [Google Scholar]
- 12.Masilamani S, Wang X, Kim GH, Brooks H, Nielsen J, Nielsen S, Nakamura K, Stokes JB, Knepper MA. Time course of renal Na-K-ATPase, NHE3, NKCC2, NCC, and ENaC abundance changes with dietary NaCl restriction. Am J Physiol Renal Physiol 283: F648–F657, 2002 [DOI] [PubMed] [Google Scholar]
- 13.Pácha J, Frindt G, Antonian L, Silver R, Palmer LG. Regulation of Na channels of the rat cortical collecting tubule by aldosterone. J Gen Physiol 102: 25–42, 1993 [DOI] [PMC free article] [PubMed] [Google Scholar]
- 14.Passero CJ, Mueller GM, Rondon-Berrios H, Tofovic SP, Hughey RP, Kleyman TR. Plasmin activates epithelial Na+ channels by cleaving the γ-subunit. J Biol Chem 283: 36586–36591, 2008 [DOI] [PMC free article] [PubMed] [Google Scholar]
- 15.Rossier BC, Stutts MJ. Activation of the epithelial sodium channel (ENaC) by serine proteases. Annu Rev Physiol 71: 361–379, 2009 [DOI] [PubMed] [Google Scholar]
- 16.Sandberg MB, Maunsbach AB, McDonough AA. Redistribution of distal tubule Na+-Cl− cotransporter (NCC) in response to a high-salt diet. Am J Physiol Renal Physiol 291: F503–F508, 2006 [DOI] [PubMed] [Google Scholar]
- 17.Svenningsen P, Bistrup C, Friis UG, Bertog M, Haerteis S, Krueger B, Stubbe J, Jensen ON, Thiesson HC, Uhrenholt TR, Jespersen B, Jensen BL, Korbmacher C, Skott O. Plasmin in nephrotic urine activates the epithelial sodium channel. J Am Soc Nephrol 20: 299–310, 2009 [DOI] [PMC free article] [PubMed] [Google Scholar]
- 18.Vallet V, Chraibi A, Gaeggeler HP, Horisberger JD, Rossier BC. An epithelial serine protease activates the amiloride-sensitive sodium channel. Nature 389: 607–610, 1997 [DOI] [PubMed] [Google Scholar]
- 19.Verrey F, Hummler E, Schild L, Rossier B. Control of sodium transport by aldosterone. In: The Kidney: Physiology and Pathophysiology, edited by Seldin DW, Giebisch G. Philadelphia: Lippincott Williams and Wilkins, 2000, p. 1441–1471 [Google Scholar]
- 20.Wang XY, Masilamani S, Nielsen J, Kwon TH, Brooks HL, Nielsen S, Knepper MA. The renal thiazide-sensitive Na-Cl cotransporter as mediator of the aldosterone-escape phenomenon. J Clin Invest 108: 215–222, 2001 [DOI] [PMC free article] [PubMed] [Google Scholar]
- 21.Weisz OA, Wang JM, Edinger RS, Johnson JP. Non-coordinate regulation of endogenous epithelial sodium channel (ENaC) subunit expression at the apical membrane of A6 cells in response to various transporting conditions. J Biol Chem 275: 39886–39893, 2000 [DOI] [PubMed] [Google Scholar]
- 22.Yang LE, Sandberg MB, Can AD, Pihakaski-Maunsbach K, McDonough AA. Effects of dietary salt on renal Na+ transporter subcellular distribution, abundance, and phosphorylation status. Am J Physiol Renal Physiol 295: F1003–F1016, 2008 [DOI] [PMC free article] [PubMed] [Google Scholar]


