Abstract
L-type voltage-dependent Ca2+ channels (VDCCs) are essential for numerous processes in the cardiovascular and nervous systems. Alternative splicing modulates proteomic composition of Cav1.2 to generate functional variation between channel isoforms. Here, we describe expression and function of Cav1.2 channels containing alternatively spliced exon 9* in cerebral artery myocytes. RT-PCR showed expression of Cav1.2 splice variants both containing (α1C9/9*/10) and lacking (α1C9/10) exon 9* in intact rabbit and human cerebral arteries. With the use of laser capture microdissection and RT-PCR, expression of mRNA for both α1C9/9*/10 and α1C9/10 was demonstrated in isolated cerebral artery myocytes. Quantitative real-time PCR revealed significantly greater α1C9/9*/10 expression relative to α1C9/10 in intact rabbit cerebral arteries compared with cardiac tissue and cerebral cortex. To demonstrate a functional role for α1C9/9*/10, smooth muscle of intact cerebral arteries was treated with antisense oligonucleotides targeting α1C9/9*/10 (α1C9/9*/10-AS) or exon 9 (α1C-AS), expressed in all Cav1.2 splice variants, by reversible permeabilization and organ cultured for 1–4 days. Treatment with α1C9/9*/10-AS reduced maximal constriction induced by elevated extracellular K+ ([K+]o) by ∼75% compared with α1C9/9*/10-sense-treated arteries. Maximal constriction in response to the Ca2+ ionophore ionomycin and [K+]o EC50 values were not altered by antisense treatment. Decreases in maximal [K+]o-induced constriction were similar between α1C9/9*/10-AS and α1C-AS groups (22.7 ± 9% and 25.6 ± 4% constriction, respectively). We conclude that although cerebral artery myocytes express both α1C9/9*/10 and α1C9/10 VDCC splice variants, α1C9/9*/10 is functionally dominant in the control of cerebral artery diameter.
Keywords: vascular smooth muscle, calcium channels, cerebral blood flow
l-type voltage-dependent Ca2+ channels (VDCCs) play a crucial role in the physiological processes of numerous cell types. In the resistance circulation, arterial constriction is dependent upon membrane potential depolarization and Ca2+ entry via Cav1.2 channels in vascular smooth muscle (15, 21). An increase in global cytosolic Ca2+ leads to Ca2+/calmodulin-dependent activation of myosin light chain kinase, myosin light chain phosphorylation, increased actin-myosin interaction, smooth muscle contraction, and decreased vessel diameter. This mechanism is essential for proper regulation of organ perfusion and systemic blood pressure.
VDCCs are multimeric protein complexes composed of an α1-pore-forming subunit associated with β- and α2δ- auxiliary subunits (5, 8, 24). L-type VDCC currents are distinguished by high activation potentials, slow inactivation of barium currents, and selective inhibition by dihydropyridines (DHPs), phenylalkylamines, and benzothiazepines (5). The Cav1.2 gene CACNA1C consists of 55 exons, 19 of which are subject to extensive alternative splicing with 40 splice variations found at 12 loci (34). cDNA library screening studies have allowed the identification of the cardiac and smooth muscle Cav1.2 isoforms, differing in composition at four alternative splice sites (2, 22, 28, 31). The purported smooth muscle splice combination consists of exons 1/8/ +9*/32, whereas the cardiac form consists of exons 1a/8a/ −9*/31. Smooth muscle L-type channels are reported to activate at more hyperpolarized (∼15 mV) membrane potentials (14, 30) and display greater DHP sensitivity than analogous channels in the heart (35). A previous study suggests that the presence of exon 8 rather than 8a to form transmembrane segment 6 of domain I in smooth muscle channels contributes to differences in DHP inhibition (36). Other work has shown that the inclusion of the 25 amino acid insertion exon 9* in the intracellular linker region between homologous domains I and II affects channel gating properties resulting in a hyperpolarizing shift in activation potential and current-voltage relationship (26). The electrophysiological alteration imposed by the addition of exon 9* to the channel protein structure suggests that expression of exon 9* may be a critically important mechanism for the fine-tuning of channel function such that smooth muscle VDCCs activate at physiologically relevant membrane potentials. Although such a role for Cav1.2 channels expressing exon 9* would be suitable for proper vascular function, the physiological significance of this splice variant in the regulation of blood vessel diameter has not been directly investigated.
Here, the objective was to determine the role of the exon 9* Cav1.2 splice variant in constriction of resistance size cerebral arteries. Consistent with previous findings by others (3, 13, 26), we provide evidence for exon 9* expression in cerebral arteries and further show a significantly higher ratio of exon 9* mRNA relative to total Cav1.2 mRNA in cerebral arteries compared with cerebral cortex and cardiac tissue. RT-PCR performed on cDNA obtained from myocytes isolated by laser-capture microdissection found expression of both splice variants in cerebral artery smooth muscle. Antisense oligodeoxynucleotides were used to selectively suppress α1C9/9*/10 in cerebral artery smooth muscle to examine the functional role for this splice variant in cerebral artery constriction. Our findings indicate that despite heterogeneous mRNA expression of both α1C9/9*/10 and α1C9/10 isoforms by cerebral artery myocytes, α1C9/9*/10 channels play a dominant role in constriction of these vessels.
METHODS
Animals.
New Zealand White rabbits (males, 3.0–3.5 kg) were used in this study. All experiments were conducted in accordance with the Guidelines for the Care and Use of Laboratory Animals [National Institutes of Health (NIH) Publication 85-23, Revised 1996] and followed protocols approved by the Institutional Animal Use and Care Committee of the University of Vermont. Animals were euthanized under deep pentobarbital anesthesia (150 mg/kg iv) by exsanguination and decapitation. Posterior cerebral and cerebellar arteries were dissected in ice-cold physiological saline solution (PSS) of the following composition (in mM): 118.5 NaCl, 4.7 KCl, 24 NaHCO3, 1.18 KH2PO4, 2.25 CaCl2, 1.2 MgCl2, 0.023 EDTA, and 11 glucose, aerated with 5% CO2-20% O2-75% N2 (bath pH, 7.4). Cerebral artery myocytes (40–60 cells/sample) were collected from enzymatically dissociated freshly isolated posterior cerebral arteries (23, 37) using a PALM Laser Capture Microdissection system (Zeiss, Bernried, Germany). Human cerebral arteries, removed as a necessary part of a required procedure, were obtained from two consenting surgical patients. Patients were not receiving calcium channel blockers or other antihypertensive agents at the time of surgery. The University of Vermont has an approved assurance of compliance on file with the Department of Health and Human Services covering this activity (Assurance identification number: FWA723; IRB identification number 0485).
RT-PCR.
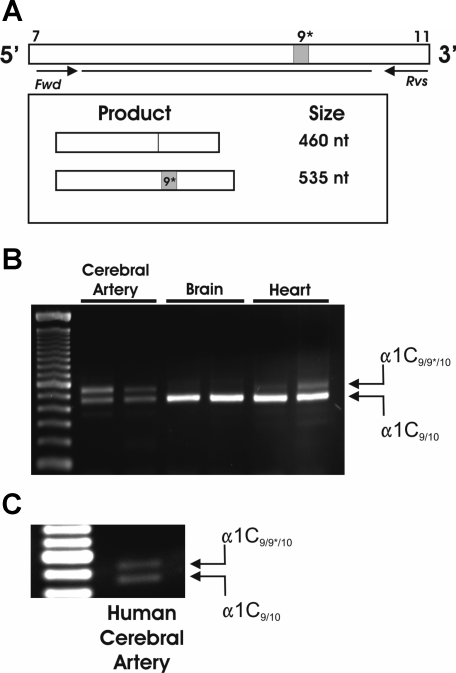
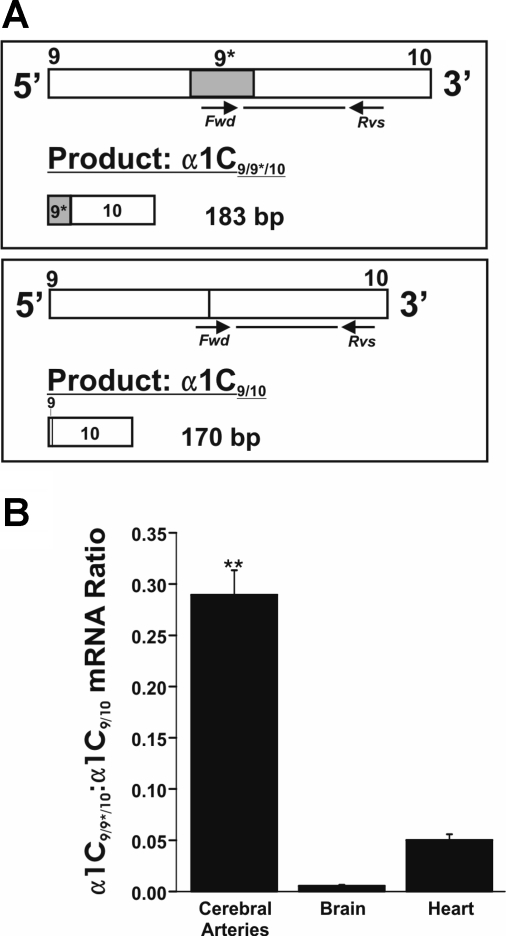
Total RNA was extracted using RNA STAT-60 total RNA/mRNA isolation reagent (Tel-test, Friendswood, TX) (4). Total RNA was reverse transcribed to cDNA using SuperScript First-Strand synthesis system (Invitrogen, Carlsbad, CA). Semi-quantitative PCR was performed using primers detecting the region spanning exons 7–11 of Cav1.2 (Genbank accession No. X55763; Fig. 1A) of the following sequences: forward 5′-TGCTTTCGCCATGTTGACG-3′ and reverse 5′-GAATTTCGACTTGGAGATCCGG-3′. Amplification was performed with Taq PCR core kit (Qiagen) using the following protocol: 94°C for 3 min; 35 cycles of 94°C for 1 min; 55°C for 1 min; 72°C for 1 min; and final extension at 72°C for 10 min. PCR products were separated by electrophoresis using 2% agarose gel. Quantitative real-time PCR was performed using primers detecting exons 9*-10 (α1C9/9*/10, forward 5′-CTTGCATGCCCAGAAGAAAG-3′ and reverse 5′-TAGCGGCTGAATTTCGACTT-3′), exons 9–10 (α1C9/9*/10, forward 5′-CCCGAAACATGAGCATGC-3′ and reverse 5′-GCACTTTCTCCTGCAGAACC-3′) by using a sense primer specific for the boundary of exons 9/10 of Cav1.2 (Fig. 2A), and 18S (18S, forward 5′-AGTCGCCGTGCCTACCAT-3′ and reverse 5′-GCCTGCTGCCTTCCTTG-3′). Amplification was performed with SYBR Green JumpStart Taq ReadyMix (Sigma, St. Louis, MO) using a real-time PCR system (Applied Biosystems, Carlsbad, CA). Quantification was performed using standard curves constructed by amplification of serially diluted plasmids containing target genes.
Fig. 1.
Cerebral arteries express α1C9/9*/10. A: PCR primer design for the detection of α1C9/9*/10 and α1C9/10. Amplification of transcripts containing exon 9* results in 535 nucleotide (nt) product, whereas amplification of transcripts excluding exon 9* results in 460 nt product. B: representative gel demonstrating 2 bands corresponding to both α1C9/9*/10 and α1C9/10 present in whole cerebral arteries (n = 7); α1C9/10 band is most prominent in brain (n = 5) and heart tissue (n = 8). C: resulting RT-PCR gel using cDNA obtained from whole cerebral arteries from human (n = 2) demonstrates presence of 2 bands corresponding to α1C9/9*/10 and α1C9/10. Fwd, forward; Rvs, reverse.
Fig. 2.
Quantitative real-time PCR (qPCR) shows high expression of α1C9/9*/10 in cerebral arteries. A: PCR primer sets for the specific detection of α1C9/9*/10 and α1C9/10. α1C9/9*/10-specific (left) forward primer recognizes sequence specific to exon 9*. α1C9/10 (right) forward primer recognizes sequence of boundary between exons 9 and 10. Sequence analysis of PCR products confirmed specificity of primers for target sequences. B: summary qPCR data for cerebral arteries, brain (cortex), and heart (left ventricle). The ratio of α1C9/9*/10 to α1C9/10 mRNA was significantly greater in cerebral arteries relative to brain and heart (0.289 ± 0.024; n = 7 compared with 0.006 ± 0.001; n = 4 and 0.050 ± 0.006; n = 8, respectively). **P < 0.01 vs. brain and heart.
Cerebral artery myocyte samples were screened for cell-specific markers using the following primer sets: smooth muscle myosin heavy chain (SM-MHC; forward 5′-CACCACACATCTACGCCATC-3′ and reverse 5′-TGATGCTCGTGTCCTTCTTG-3′), endothelin 1 (ET-1; forward 5′-AAAGGCAAAGACTGCTCCAA-3′ and reverse 5′-GCACTCCTTGGTCTCTCCTG-3′), fibroblast specific protein 1 (FSP-1; forward 5′-GGGGTGACAAGTTCAAGCTC-3′ and reverse 5′-CTGGAAGTCCACCTCGTTGT-3′), and growth associated protein-43 (GAP43; forward 5′-AGCCAAGGAGGAGCCTAAAC-3′ and reverse 5′-TCAGGCATGTTCTTGGTCAG-3′). Nested PCR was performed using primers for exons 7–11 (above) of Cav1.2 for first-round amplification (35 cycles) and using the following nested PCR primers for 35 cycles of amplification of 1:100 dilution of first-round products: forward 5′-CGTGCTGTACTGGGTCAATG-3′ and reverse 5′-CAGCCACGTTTTCAGTGTTG-3′.
Immunostaining of isolated cerebral artery myocytes.
Dissociated cell suspensions were fixed with 4% formalin and plated on Superfrost Plus microscope slides (Fisher Scientific, Waltham, MA) with a cytocentrifuge. Cells were dried for 10 min and blocked and permeabilized in 3% milk/0.1% Triton X-100 phosphate-buffered saline (PBS) for 20 min. Cells were rinsed with PBS for 30 min and incubated (4°C/overnight) in PBS containing mouse monoclonal antibody raised against rabbit SM-MHC (1:125 dilution; Abcam, Cambridge, MA) or monoclonal antibody against α-smooth muscle actin conjugated to Cy3 (1:200; Sigma). Cells were then rinsed in PBS, and slides treated with anti-SM-MHC were incubated in anti-mouse IgG conjugated to Cy3 (1:500; Jackson ImmunoResearch Laboratories, West Grove, PA). Images were taken (×40) using a Zeiss LSM 510 Meta confocal microscope.
Use of antisense oligonucleotides.
For suppression of α1C9/9*/10, antisense oligonucleotides (Operon Biotechnologies, Huntsville, AL) were designed to target a sequence specific to the coding region of exon 9* of Cav1.2 mRNA transcripts: α1C9/9*/10-antisense (AS), 5′-A*A*G*C*CCGCTGGAGTGC*C*T*C*T-3′. To suppress the total population of Cav1.2 channels, antisense oligodeoxynucleotides were designed to target exon 9, which is not alternatively spliced and is expressed in all Cav1.2 transcripts: α1C-AS, 5′-C*T*C*T*TCCAGCTGCTGCTTC*T*C*C*C-3′. Control sense oligonucleotides of the following sequences were designed: α1C9/9*/10-sense, 5′-A*G*A*G*GCGCTCCAGCGG*G*C*T*T-3′ and α1C-sense, 5′-G*G*G*A*GAAGCAGCAGCTGGA*A*G*A*G-3′. The first and last four bases of each oligonucleotide were phosphorothioated to prevent degradation by cellular nucleases (designated by *). All oligonucleotides were reconstituted with nuclease-free water at a concentration of 10 mM.
Reversible permeabilization and organ culture of cerebral arteries.
The introduction of oligonucleotides into smooth muscle of intact cerebral arteries was achieved by a reversible permeabilization procedure (9, 25). Arterial segments were first incubated at 4°C for 30 min in the following solution (in mM): 120 KCl, 2 MgCl2, 10 EGTA, 5 NaATP, and 20 N-tris-(hydroxymethyl)methyl-2-aminoethanesulfonic acid (pH 6.8). Arteries were then incubated in a similar solution containing oligonucleotide (10 μM) for 90 min at 4°C and then in a solution containing elevated MgCl2 (10 mM). Permeabilization of arteries was reversed by incubating arteries for 30 min at room temperature in physiological solution containing the following (in mM): 140 NaCl, 5 KCl, 10 MgCl2, 5.6 glucose, and 2 3-(N-morpholino)propanesulfonic acid (pH 7.1). [Ca2+] was next gradually increased in this solution from nominally Ca2+-free to 0.01, 0.1, and 1.8 mM over a period of 45 min. Following reversible permeabilization, arterial segments were organ cultured by placing the arteries in serum-free DMEM-F12 culture media (Invitrogen, Carlsbad, CA) and incubating at 37°C and 5% CO2 for 1 to 4 days (18, 27).
Diameter measurements in isolated arteries.
Freshly isolated and cultured cerebral artery segments were cannulated on glass micropipettes mounted in a 5-ml myograph chamber (University of Vermont Instrumentation and Model Facility) as described previously (18, 19, 27). Following cannulation, arteries were pressurized at 20 mmHg and continuously superfused with aerated PSS at 37° C and pH 7.4 for 30 min to allow equilibration. Arterial diameter was measured with video edge detection equipment and recorded using data acquisition software (Dataq Instruments, Akron, OH). Arteries were exposed to PSS containing elevated [K+], made by isoosmotic replacement of NaCl with KCl. Arterial constriction was expressed using the following equation: %Constriction = [1 −(D − Dmin/Dmax − Dmin)] × 100, where Dmax is the maximum diameter obtained in Ca2+-free PSS containing diltiazem (100 μM) and forskolin (1 μM) and Dmin is the minimum diameter obtained with the Ca2+ ionophore ionomycin (10 μM) at the end of each experiment. Ionomycin-induced constrictions (Table 1) are presented as a percentage of maximum diameter (Dmax). Arteries not achieving >70% constriction in response to ionomycin were not used for analysis. Half-maximal effective concentration (EC50) was determined from each [K+]o concentration-response experiment.
Table 1.
Diameter values for [K+]o concentration-response experiments
| RP | α1C9/9*/10-Sense | α1C9/9*/10- Antisense | |
|---|---|---|---|
| Day 1 | |||
| Diameter, μm | |||
| 6 mM [K+]o | 170±27.8 | 186±18.7 | 182±21.8 |
| 80 mM [K+]o | 62±16.1 | 66±9.2 | 63±7.6 |
| Ionomycin | 37±13.1 | 37±7.5 | 29±2.6 |
| Ionomycin induced | 81±4.6 | 80±3.1 | 85±2.7 |
| Constriction, % of maximum diameter | |||
| [K+]o EC50 | 35±3.5 | 34±1.2 | 34±2.3 |
| Day 2 | |||
| Diameter, μm | |||
| 6 mM [K+]o | 194±28.2 | 217±34.7 | 165±25.5 |
| 80 mM [K+]o | 85±11.7 | 87±23.0 | 87±12.5 |
| Ionomycin | 53±9.7 | 49±16.4 | 31±5.6 |
| Ionomycin induced | 72±5.2 | 80±3.7 | 83±2.7 |
| Constriction, % of maximum diameter | |||
| [K+]o EC50 | 32±7.4 | 31±1.3 | 33±2.0 |
| Day 3 | |||
| Diameter, μm | |||
| 6 mM [K+]o | 201±20.4 | 216±50.7 | 194±13.0 |
| 80 mM [K+]o | 81±10.3 | 89±14.3 | 149±13.0* |
| Ionomycin | 42±11.4 | 51±15.5 | 45±8.9 |
| Ionomycin induced | 80±4.1 | 86±3.4 | 81±3.4 |
| Constriction, % of maximum diameter | |||
| [K+]o EC50 | 31±3.0 | 30±2.1 | 32±3.0 |
| Day 4 | |||
| Diameter, μm | |||
| 6 mM [K+]o | 230±25.5 | 205±42.0 | 188±4.6 |
| 80 mM [K+]o | 78±12.1 | 89±14.3 | 155±20.3* |
| Ionomycin | 37±12.7 | 51±15.5 | 50±15.3 |
| Ionomycin induced | 85±4.9 | 75±6.9 | 73±3.0 |
| Constriction, % of maximum diameter | |||
| [K+]o EC50 | 33±2.3 | 31±2.3 | 30±2.8 |
Values are means ± SE. Diameter values are shown for α1C9/9*/10-antisense, α1C9/9*/10-sense, and reversible permeabilization control (RP) arteries in physiological saline solution of 6 mM extracellular K+ ([K+]o), 80 mM [K+]o, and 120 mM [K+]o containing 10 μM ionomycin (ionomycin group) for all time points tested. Ionomycin constriction, expressed as percent decrease from maximum diameter, and EC50 values, calculated from [K+]o concentration-response curves, are also shown.
P < 0.05 vs. α1C9/9*/10-sense and RP groups.
Statistical analysis.
Values are presented as means ± SE. One-way ANOVA followed by Tukey multiple comparison test was used in the comparison of multiple groups. Student's t-test was used in the comparison of two groups. Statistical significance was considered at the level of P < 0.05 (*) or P < 0.01 (**).
RESULTS
Cerebral arteries demonstrate enhanced expression of α1C9/9*/10 compared with brain and heart.
Previous work has shown selective expression of α1C9/9*/10 splice variants by smooth muscle-containing tissues. However, mRNA expression of both α1C splice variants including (α1C9/9*/10) and excluding (α1C9/10) exon 9* has been reported in aorta (3, 13, 26). Therefore, our first objective was to investigate whether small diameter (100–250 μm) cerebral arteries express mRNA for both α1C9/9*/10 and α1C9/10. To detect expression of α1C9/9*/10, we designed PCR primers to generate products consisting of exons 7–11 of α1C (Fig. 1A) such that a shift in product size would result if the 75 nucleotide (nt) insertion for exon 9* was expressed. RT-PCR analysis resulted in two distinct bands from rabbit cerebral arteries (Fig. 1B; n = 7). Sequence analysis confirmed the lower band of 460 nt represents α1C9/10, whereas the upper band of 535 nt represents α1C9/9*/10. Human cerebral arteries were also analyzed and found to express both α1C9/9*/10 and α1C9/10 similar to arteries from rabbit (Fig. 1C). In contrast, cardiac tissue (left ventricle; n = 8) and brain tissue (cerebral cortex; n = 5) were found to express one dominant product corresponding to α1C9/10 (Fig. 1B).
Quantitative real-time PCR was used to evaluate relative expression levels of α1C9/9*/10 in these tissues. We hypothesized the fraction of mRNA for Cav1.2 expressing exon 9* is greater in cerebral arteries than cardiac and brain tissue. α1C9/9*/10 and α1C9/10 expression was measured separately by using either a PCR primer specific for exon 9* sequence (α1C9/9*/10 specific) or a primer specific for the boundary of exons 9 and 10 (α1C9/10 specific; Fig. 2A). α1C9/9*/10 and α1C9/10 expression was normalized to 18S ribosomal RNA levels. This approach allows quantification of the α1C9/9*/10-to-α1C9/10 mRNA ratio, which is representative of α1C9/9*/10 relative to overall Cav1.2 expression considering that α1C9/9*/10 and α1C9/10 are mutually exclusive splice variants. We found that cerebral arteries express significantly higher relative levels of α1C9/9*/10 compared with brain and heart tissues (Fig. 2B; ∼52-fold and ∼6-fold difference, respectively). Together, these results demonstrate mRNA for both α1C9/9*/10 and α1C9/10 splice variants in cerebral arteries and enhanced relative expression of α1C9/9*/10 in cerebral arteries compared with brain and heart.
Isolated cerebral artery myocytes express both α1C9/9*/10 and α1C9/10 splice variants.
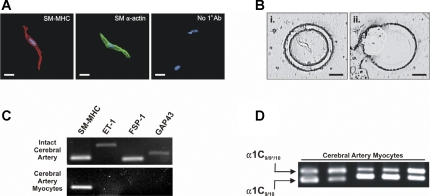
We next chose to clarify whether cerebral artery myocytes express mRNA for both splice variants or whether α1C9/10 detection was due to the presence of non-smooth muscle cell types within the vascular wall, such as fibroblasts or perivascular neurons, which are reported to express Cav1.2 (10, 13, 17, 32). Live freshly isolated cerebral artery myocytes (∼40–60 cells) were collected by laser capture microdissection for RT-PCR analysis (Fig. 3B). These elongated spindle-shaped cells showed strong immunofluorescent staining for SM-MHC or smooth muscle-α-actin, markers commonly used to identify smooth muscle (Fig. 3A) (1, 11). RT-PCR was used to examine expression of specific cell markers: SM-MHC (smooth muscle), ET-1 (endothelium) (38), FSP-1 (fibroblast) (33), and GAP43 (neuron) (39) in mRNA isolated from both intact arteries and isolated myocytes. The above cell markers all amplified using intact cerebral artery mRNA (Fig. 3C), consistent with the presence of multiple cell types in intact vessels. However, only the smooth muscle marker SM-MHC was expressed in freshly isolated myocytes, confirming purity of our samples. Nested PCR for exons 7–11 of Cav1.2 demonstrated two bands corresponding to α1C9/9*/10 and α1C9/10 in isolated cerebral artery myocytes, similar to the intact tissue (Fig. 3B). These data demonstrate heterogeneous mRNA for both α1C9/9*/10 and α1C9/10 in isolated smooth muscle from cerebral arteries.
Fig. 3.
Cerebral artery myocytes express both α1C9/9*/10 and α1C9/10 splice variants. A: immunostaining of isolated cerebral artery myocytes. Red: smooth muscle (SM) myosin heavy chain (SM-MHC); green: SM-α-actin (color changed from red to green to distinguish from SM-MHC); blue: 4,6-diamidino-2-phenylindole nuclear stain. Scale bars represent 10 μm. A lack of staining was observed for SM-MHC or SM-α-actin by cells incubated without primary antibody (No 1° Ab; right). B: microdissection of isolated cerebral artery myocytes. Live myocytes plated on PALM Duplex dish (Ziess) were identified by cell morphology and the surrounding dish membrane was cut. Myocytes were then catapulted onto PALM Adhesivecap collection tubes (Ziess) for mRNA extraction. Scale bars represent 25 μm. C: representative gel showing the presence of cell markers: SM-MHC (smooth muscle), endothelin-1 (ET-1; endothelium), fibroblast specific protein-1 (FSP-1; fibroblast), and growth associated protein-43 (GAP43; neuronal). All markers are amplified using cDNA from whole cerebral arteries. cDNA from cerebral artery myocytes samples collected by laser capture microdissection demonstrate amplification of SM-MHC, whereas other markers were not detected. D: results of nested PCR performed on cDNA from isolated cerebral artery myocytes. First round of amplification (35 cycles) was performed using primers for exons 7–11 of Cav1.2 (see Fig. 1A). Second round of amplification (35 cycles) was done using nested primers (see methods) and 1:100 dilution of first-round PCR products. Final products represent expression of α1C9/9*/10 (top band) and α1C9/10 (lower band; n = 5).
α1C9/9*/10 plays critical role in depolarization-induced constriction of cerebral arteries.
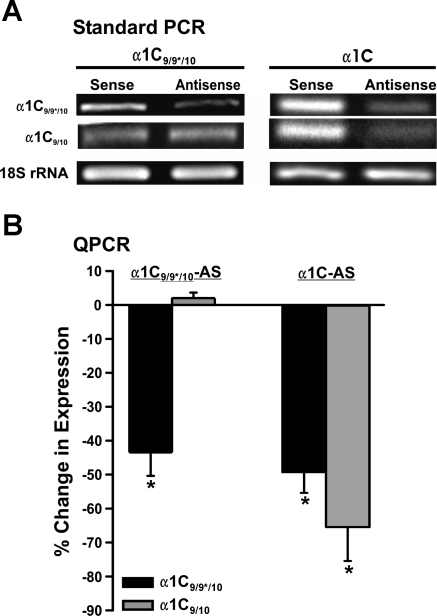
High expression levels of α1C9/9*/10 in cerebral artery myocytes suggest this splice variant may have an important role in vascular function. We therefore tested the hypothesis that α1C9/9*/10 splice variants are an important regulator of cerebral artery diameter. Two antisense oligonucleotide sequences were designed to examine the functional role of α1C9/9*/10. First, α1C9/9*/10-AS targeting a sequence specific for exon 9* was used for selective suppression of the α1C9/9*/10 variant. Second, α1C-AS targeting a sequence specific for exon 9, which is constitutively expressed in all L-type VDCC splice variants, was used for nonselective suppression of all Cav1.2 isoforms. Four days following treatment, standard RT-PCR and quanitative real-time PCR demonstrated a significant reduction (43 ± 6.9%) in α1C9/9*/10 expression following treatment with α1C9/9*/10-AS compared with α1C9/9*/10-sense-treated arteries (Fig. 4, A and B). However, suppression of α1C9/10 was not observed following treatment with α1C9/9*/10-AS. In contrast with the effect of α1C9/9*/10-AS, arteries treated with α1C-AS exhibited a significant reduction in expression for both α1C9/9*/10 and α1C9/10 splice variants (Fig. 4, A and B).
Fig. 4.
Selective suppression of Cav1.2 splice variants following antisense treatment and organ culture for 4 days. A: RT-PCR was performed on cDNA from arteries treated with α1C9/9*/10-antisense (AS), α1C-AS, and corresponding sense oligonucleotides. Band intensity corresponding to α1C9/9*/10 was reduced in α1C9/9*/10-AS-treated artery samples following 4 days in organ culture compared with sense-treated arteries (left; n = 4). Lower band, corresponding to α1C9/10, was similar between 2 groups. RT-PCR gel demonstrating reduction in both α1C9/9*/10 and α1C9/10 band intensity following treatment with α1C-AS and organ culture for 4 days (right; n = 4) is shown. Total RNA used was similar as shown by endogenous control 18S ribosomal RNA. B: quantification of changes in mRNA levels using qPCR in antisense-treated arteries compared with sense-treated arteries from same animal. *P < 0.05 (α1C9/9*/10-AS/S, n = 4; α1C-AS/S, n = 4).
To examine the effect of suppressing α1C9/9*/10 on arterial constriction, luminal diameter measurements were performed while increasing external K+ ([K+]o) in the bath solution over a range of concentrations from 6 to 120 mM following a period of 1 to 4 days in organ culture. The relationship between extracellular [K+]o and membrane potential at [K+]o > 16 mM closely follows that which is predicted by the Nernst equation (16, 21).
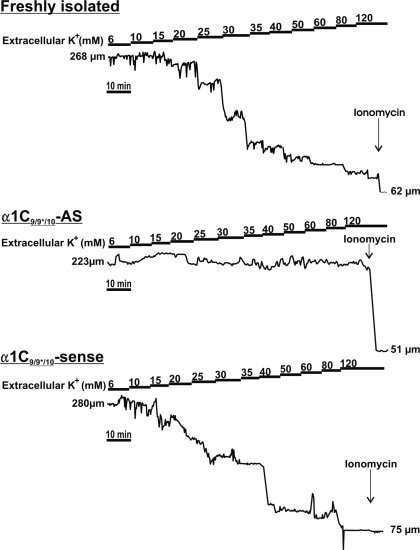
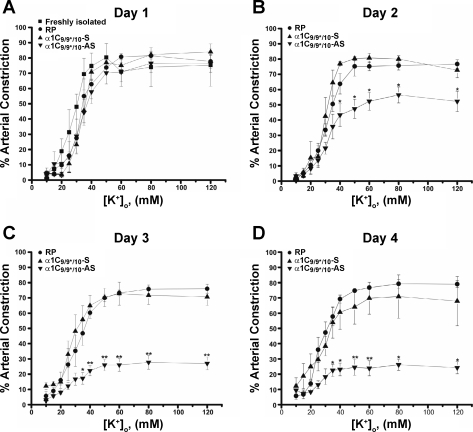
Stepwise increases in [K+]o caused graded arterial constriction of control freshly isolated vessels (Figs. 5 and 6). α1C9/9*/10-AS, α1C9/9*/10-sense, and RP only groups all responded similarly to freshly isolated vessels following 1 day in culture (Fig. 6). However, K+-induced constrictions, expressed as a percentage of maximum constriction caused by ionomycin (see methods), were significantly reduced in α1C9/9*/10-AS arteries compared with control α1C9/9*/10-sense-treated and RP arteries after 2 days. For example, α1C9/9*/10-AS-treated vessels exhibited 52 ± 5.9% constriction in response to 60 mM K+ on day 2 compared with 80 ± 2.1% and 75 ± 2.9% constriction in α1C9/9*/10-sense-treated and RP vessels, respectively. Further reductions were observed in α1C9/9*/10-AS-treated arteries on day 3 (e.g., 26 ± 4.1% in [K+]o = 60 mM) and day 4 (e.g., 23 ± 4.9% in [K+]o = 60 mM) of organ culture (Fig. 6). α1C9/9*/10-sense-treated and RP arteries constricted to a similar degree as freshly isolated vessels at all time points tested (Figs. 5 and 6). Mean diameters of arteries exposed to these treatments are shown in Table 1. No significant differences in EC50 values for K+ were observed between groups (Table 1). Diameter values and maximal constriction to ionomycin were similar between groups at all time points tested (Table 1). Fully dilated arterial diameter, obtained in Ca2+-free PSS containing diltiazem and forskolin, was not significantly different between groups (α1C9/9*/10-AS: 201 ± 13 μm, n = 17; sense: 214 ± 16 μm, n = 17; and RP: 199 ± 13 μm, n = 16). Taken together, these data demonstrate an important role for α1C9/9*/10 in the regulation of cerebral artery constriction.
Fig. 5.
Representative arterial diameter traces demonstrating important functional role for α1C9/9*/10 in arterial constriction. All arteries were cannulated, pressurized to 20 mmHg, and perfused with physiological saline solution (PSS) for 30 min before stepwise increases in extracellular K+ ([K+]o). Control freshly isolated and sense-treated (day 4) arteries responded to increases in [K+]o by graded constriction. α1C9/9*/10-AS-treated (day 4) arteries exhibited a marked reduction in [K+]o-induced constriction. Ionomycin (10 μM) was applied at the end of each experiment.
Fig. 6.
Time course for α1C9/9*/10-AS effect. A (day 1): α1C9/9*/10-AS, α1C9/9*/10-sense-treated (α1C9/9*/10-S), and RP arteries exhibit constriction similar to freshly isolated cerebral arteries (day 0). B–D (days 2–4): α1C9/9*/10-AS arteries exhibit significantly reduced arterial constriction in response to increased [K+]o with constrictions nearly abolished following 4 days in organ culture compared with α1C9/9*/10-sense and RP arteries organ cultured for the same period of time. No significant differences were observed in arterial constriction between α1C9/9*/10-sense-treated artery groups (days 1–4; n = 4 to 5) and freshly isolated arteries (day 0; n = 5). *P < 0.05; **P < 0.01.
α1C9/9*/10 is the functionally dominant splice variant in cerebral arterial constriction.
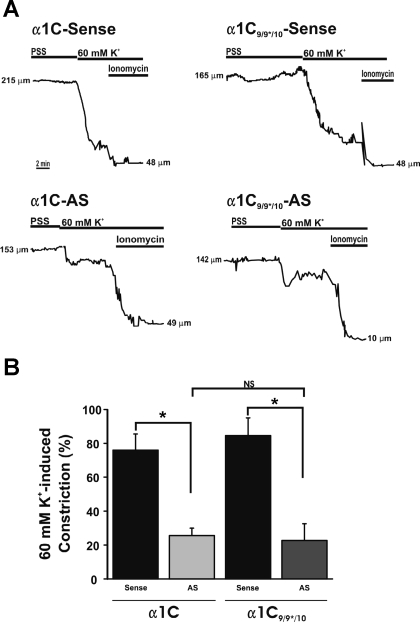
Our data imply that although cerebral artery myocytes express both α1C9/9*/10 and α1C9/10, α1C9/9*/10 plays a major role in cerebral artery constriction. To examine the role of α1C9/10 in cerebral artery constriction, we compared the effect of suppressing α1C9/9*/10 with suppressing all Cav1.2 splice variants (both α1C9/9*/10 and α1C9/10) using α1C-AS. Arteries treated with α1C-AS exhibited diminished constriction to 60 mM [K+]o that was similar to that observed in arteries treated with α1C9/9*/10-AS (Fig. 7; α1C9/9*/10-AS: 23.5 ± 3.6%, n = 6; and α1C-AS: 25.6 ± 4.3%, n = 5), suggesting that suppression of all Cav1.2 splice variants had no greater effect on constriction to 60 mM [K+]o than selectively suppressing α1C9/9*/10. These data suggest that the isoform containing exon 9* is the functionally dominant Cav1.2 splice variant in cerebral artery constriction.
Fig. 7.
α1C9/9*/10 plays a dominant role in cerebral artery constriction. A: representative diameter traces showing response to 60 mM [K+]o followed by application of 10 μM ionomycin. B: summary of 60 mM [K+]o for AS-treated arteries. All constrictions were normalized to minimum diameter obtained in ionomycin and maximum diameter obtained in Ca2+-free PSS with diltiazem (100 μM) and forskolin (1 μM). After 4 days in organ culture following oligonucleotide treatment, arteries treated with α1C-AS exhibited similar response to 60 mM [K+]o as arteries treated with α1C9/9*/10-AS. α1C9/9*/10-AS and α1C-AS groups were significantly decreased compared with corresponding sense-treated groups. No significant difference (NS) was observed between α1C9/9*/10-AS and α1C-AS groups (*P < 0.05; α1C9/9*/10-sense, n = 4; α1C9/9*/10-AS, n = 6; α1C-sense, n = 5; α1C-AS, n = 5).
DISCUSSION
Here we demonstrate that cerebral artery myocytes express Cav1.2 splice variants both containing (α1C9/9*/10) and lacking (α1C9/10) exon 9* and that α1C9/9*/10 plays a dominant role in cerebral artery constriction. The following observations are consistent with this novel finding: 1) cerebral arteries have a significantly higher ratio of α1C9/9*/10 to α1C9/10 mRNA compared with cerebral cortex or cardiac tissue; 2) RT-PCR performed on cDNA from isolated cerebral artery myocytes confirmed expression of both α1C9/9*/10 and α1C9/10 in smooth muscle; 3) selective suppression of the α1C9/9*/10 splice variant caused a marked reduction in K+-induced arterial constriction; and 4) suppression of all Cav1.2 splice variants caused no further reduction in K+-induced arterial constriction. In addition, we found a similar expression profile of α1C9/9*/10 and α1C9/10 splice variants in cerebral arteries from humans.
This work expands our understanding of the molecular composition of smooth muscle VDCCs responsible for the control of arterial diameter and blood flow. Unlike cardiac myocytes, vascular smooth muscle operates in a state of tonic contraction responding to modest changes in membrane potential caused, for example, by changes in intravascular pressure, neurotransmitter release, circulating catacholamines, and endothelial influences. Thus L-type VDCCs expressed by vascular smooth muscle respond to small voltage changes at relatively negative membrane potentials compared with more depolarized membrane potentials reached during action potentials in cardiac myocytes or neurons. Recent studies using cell expression systems have found expression of the 25 amino acid insertion exon 9* causes a 9-mV hyperpolarizing shift in L-type VDCC V0.5, act (6, 26). This hyperpolarizing shift in the activation of this splice variant would be well-suited to the range of vascular smooth membrane potential in vivo (−45 to −35 mV) (29). We now report that exon 9*-containing L-type VDCCs are the dominant Cav1.2 splice variant contributing to cerebral artery constriction. To our knowledge, this is the first study directly demonstrating a physiological role for a single Cav1.2 splice variant.
We have observed that whole arterial tissue containing smooth muscle, endothelial, fibroblast and perivascular neural cells expresses both α1C9/9*/10 and α1C9/10 splice variants. Although endothelial cells are known to lack expression of VDCCs (13), Cav1.2 expression by fibroblasts and neurons is well documented (10, 17, 32). To further explore the composition of Cav1.2 splice variants in vascular smooth muscle, we performed PCR on mRNA obtained from freshly isolated vascular myocytes using laser capture microdissection. This approach demonstrated mRNA for both α1C9/9*/10 and α1C9/10 isoforms in a pure population of native vascular smooth muscle. When compared with vascular tissue, we found a relatively low level of α1C9/9*/10 mRNA in heart and cerebral cortex tissue, providing additional support that exon 9* is selectively expressed by smooth muscle. It is possible that apparent differences in the stoichiometry of α1C9/9*/10 and α1C9/10 splice variants may reflect discrepancies in total levels of Cav1.2 expressed between tissues. However, an earlier study by Graf et al. (13) demonstrated that the ratio of +9* to −9* Cav1.2 is not well correlated with expression levels of total Cav1.2. For example, it was shown that human cardiac ventricle and aorta express similar levels of total Cav1.2, although the +9*-to-−9* ratio is greater in aorta. Increased α1C9/9*/10-to-−α1C9/10 mRNA ratio observed in vascular smooth muscle is, therefore, unlikely to be due to differential expression of total Cav1.2 levels compared with brain and heart.
The use of antisense oligonucleotides to specifically suppress 9*-containing Cav1.2 channels revealed a substantial decrease in K+-induced constriction, supporting a functional role for this splice variant in vascular physiology. In fact, antisense oligonucleotides targeting a region common to all Cav1.2 splice variants (exon 9) caused no greater decrease in contractility than suppression of only α1C9/9*/10. These data suggest exon 9*-containing Cav1.2 channels play a dominant role in regulating smooth muscle contraction. It should be noted that this conclusion is based on the assumptions that both antisense oligonucleotides used in this study suppress translation of their target with similar efficiency and that functional effects are not due to nonspecific suppression of total Cav1.2 levels. Consistent with these assumptions, we observed a maximal response using both antisense oligonucleotides at day 4 with no greater suppression occurring after 5 days of treatment (data not shown). Furthermore, the EC50 for [K+]o was not altered by α1C9/9*/10-AS, consistent with a functional population of Cav1.2 channels with a uniform V0.5, act. With the consideration of the loss of endothelial function following prolonged organ culture of arteries (20), it is possible that compensatory changes in Cav1.2 splice variant expression may occur. However, we have found using RT-PCR that the ratio of α1C9/9*/10 to α1C9/10 does not change following up to 4 days in culture (data not shown). Future studies are needed to address whether α1C9/9*/10 also plays a dominant role in vasoconstriction to endogenous compounds and physiological increases in intravascular pressure.
The unique location of exon 9* within the structure of the α1-subunit may also play a role in post-translational regulation of VDCCs in vascular smooth muscle. Interestingly, the site of α1/β-subunit interaction, known as the α interaction domain, is found 18 amino acids upstream of exon 9* within the I-II intracellular linker region of the α1C-protein. It has previously been shown that functional interaction between the α1- and β-subunit is required for correct targeting of the channel to the plasma membrane (12). It remains possible that α1-subunits expressing exon 9* may differentially bind specific Cavβ-isoforms compared with α1-subunits lacking the insertion, leading to favored trafficking of α1C9/9*/10 to the membrane and a dominant functional role for this splice variant. Further research is needed to elucidate whether the presence of exon 9* alters the binding of β subunit subtypes or splice isoforms. It should be noted that smooth muscle-selective alternatively spliced exons other than exon 9* could be preferentially expressed in 9*-containing channels and may also contribute to functional distinction of vascular smooth muscle VDCCs. For example, it has recently been shown that inclusion of exon 1c in full-length cloned Cav1.2 channels can lead to a hyperpolarizing shift in V0.5,act in HEK293 cells, similar to inclusion of exon 9*(7).
In summary, this study suggests that the exon 9*-containing Cav1.2 splice variant controls cerebral artery myocyte Ca2+ influx, arterial diameter, and cerebral blood flow. We propose that α1C9/9*/10 may represent a novel target for therapeutics against vascular pathologies associated with increased Ca2+ influx in vascular smooth muscle leading to enhanced arterial constriction. Future genetic or pharmacological strategies targeting smooth muscle-selective Cav1.2 splice variants could provide a valuable means of modulating vascular tone while avoiding widespread effects on VDCC isoforms in cardiac or nervous systems.
GRANTS
This work was supported by the Totman Medical Research Trust Fund, the Peter Martin Brain Aneurysm Endowment, NIH Grants P20-RR-16435 and R01-HL-078983, and a American Heart Association predoctoral fellowship award (0815736D).
ACKNOWLEDGMENTS
We thank Drs. Joseph Brayden, Masayo Koide, Ping Liao, Victor May, Mark Nelson, Tuck Wah Soong, and Margaret Vizzard, and Kristin Schutz, Marilyn Wadsworth, Theresa Wellman, and Thomm Buttolph, Colby Cantu, and Edward Zelazny for helpful comments and assistance on this study. We also acknowledge the University of Vermont Neuroscience COBRE Molecular Biology and Microscopy Imaging Center core facilities.
REFERENCES
- 1.Barillot W, Treguer K, Faucheux C, Fedou S, Theze N, Thiebaud P. Induction and modulation of smooth muscle differentiation in Xenopus embryonic cells. Dev Dyn 237: 3373–3386, 2008 [DOI] [PubMed] [Google Scholar]
- 2.Biel M, Ruth P, Bosse E, Hullin R, Stuhmer W, Flockerzi V, Hofmann F. Primary structure and functional expression of a high voltage activated calcium channel from rabbit lung. FEBS Lett 269: 409–412, 1990 [DOI] [PubMed] [Google Scholar]
- 3.Bielefeldt K. Molecular diversity of voltage-sensitive calcium channels in smooth muscle cells. J Lab Clin Med 133: 469–477, 1999 [DOI] [PubMed] [Google Scholar]
- 4.Braas KM, May V. Pituitary adenylate cyclase-activating polypeptides directly stimulate sympathetic neuron neuropeptide Y release through PAC (1) receptor isoform activation of specific intracellular signaling pathways. J Biol Chem 274: 27702–27710, 1999 [DOI] [PubMed] [Google Scholar]
- 5.Catterall WA. Structure and regulation of voltage-gated Ca2+ channels. Annu Rev Cell Dev Biol 16: 521–555, 2000 [DOI] [PubMed] [Google Scholar]
- 6.Cheng X, Liu J, Asuncion-Chin M, Blaskova E, Bannister JP, Dopico AM, Jaggar JH. A novel CaV1.2 N terminus expressed in smooth muscle cells of resistance size arteries modifies channel regulation by auxiliary subunits. J Biol Chem 282: 29211–29221, 2007 [DOI] [PMC free article] [PubMed] [Google Scholar]
- 7.Cheng X, Pachuau J, Blaskova E, Asuncion-Chin M, Liu J, Dopico AM, Jaggar JH. Alternative splicing of CaV1.2 channel exons in smooth muscle cells of resistance-size arteries generates currents with unique electrophysiological properties. Am J Physiol Heart Circ Physiol 297: H680–HH688, 2009 [DOI] [PMC free article] [PubMed] [Google Scholar]
- 8.Dolphin AC. Beta subunits of voltage-gated calcium channels. J Bioenerg Biomembr 35: 599–620, 2003 [DOI] [PubMed] [Google Scholar]
- 9.Earley S, Straub SV, Brayden JE. Protein kinase C regulates vascular myogenic tone through activation of TRPM4. Am J Physiol Heart Circ Physiol 292: H2613–H2622, 2007 [DOI] [PubMed] [Google Scholar]
- 10.Ertel EA, Campbell KP, Harpold MM, Hofmann F, Mori Y, Perez-Reyes E, Schwartz A, Snutch TP, Tanabe T, Birnbaumer L, Tsien RW, Catterall WA. Nomenclature of voltage-gated calcium channels. Neuron 25: 533–535, 2000 [DOI] [PubMed] [Google Scholar]
- 11.Gan Q, Yoshida T, Li J, Owens GK. Smooth muscle cells and myofibroblasts use distinct transcriptional mechanisms for smooth muscle alpha-actin expression. Circ Res 101: 883–892, 2007 [DOI] [PubMed] [Google Scholar]
- 12.Gao T, Chien AJ, Hosey MM. Complexes of the alpha1C and beta subunits generate the necessary signal for membrane targeting of class C L-type calcium channels. J Biol Chem 274: 2137–2144, 1999 [DOI] [PubMed] [Google Scholar]
- 13.Graf EM, Bock M, Heubach JF, Zahanich I, Boxberger S, Richter W, Schultz JH, Ravens U. Tissue distribution of a human Cav1.2 alpha1-subunit splice variant with a 75 bp insertion. Cell Calcium 38: 11–21, 2005 [DOI] [PubMed] [Google Scholar]
- 14.Hadley RW, Lederer WJ. Properties of L-type calcium channel gating current in isolated guinea pig ventricular myocytes. J Gen Physiol 98: 265–285, 1991 [DOI] [PMC free article] [PubMed] [Google Scholar]
- 15.Harder DR. Pressure-dependent membrane depolarization in cat middle cerebral artery. Circ Res 55: 197–202, 1984 [DOI] [PubMed] [Google Scholar]
- 16.Hirst GD, van Helden DF. Ionic basis of the resting potential of submucosal arterioles in the ileum of the guinea-pig. J Physiol 333: 53–67, 1982 [DOI] [PMC free article] [PubMed] [Google Scholar]
- 17.Hofmann F, Biel M, Flockerzi V. Molecular basis for Ca2+ channel diversity. Annu Rev Neurosci 17: 399–418, 1994 [DOI] [PubMed] [Google Scholar]
- 18.Ishiguro M, Puryear CB, Bisson E, Saundry CM, Nathan DJ, Russell SR, Tranmer BI, Wellman GC. Enhanced myogenic tone in cerebral arteries from a rabbit model of subarachnoid hemorrhage. Am J Physiol Heart Circ Physiol 283: H2217–H2225, 2002 [DOI] [PubMed] [Google Scholar]
- 19.Ishiguro M, Wellman TL, Honda A, Russell SR, Tranmer BI, Wellman GC. Emergence of a R-type Ca2+ channel (CaV 2.3) contributes to cerebral artery constriction after subarachnoid hemorrhage. Circ Res 96: 419–426, 2005 [DOI] [PubMed] [Google Scholar]
- 20.Kleppisch T, Winter B, Nelson MT. ATP-sensitive potassium channels in cultured arterial segments. Am J Physiol Heart Circ Physiol 271: H2462–H2468, 1996 [DOI] [PubMed] [Google Scholar]
- 21.Knot HJ, Nelson MT. Regulation of arterial diameter and wall [Ca2+] in cerebral arteries of rat by membrane potential and intravascular pressure. J Physiol 508: 199–209, 1998 [DOI] [PMC free article] [PubMed] [Google Scholar]
- 22.Koch WJ, Ellinor PT, Schwartz A. cDNA cloning of a dihydropyridine-sensitive calcium channel from rat aorta. Evidence for the existence of alternatively spliced forms. J Biol Chem 265: 17786–17791, 1990 [PubMed] [Google Scholar]
- 23.Koide M, Penar PL, Tranmer BI, Wellman GC. Heparin-binding EGF-like growth factor mediates oxyhemoglobin-induced suppression of voltage-dependent potassium channels in rabbit cerebral artery myocytes. Am J Physiol Heart Circ Physiol 293: H1750–H1759, 2007 [DOI] [PubMed] [Google Scholar]
- 24.Lacerda AE, Kim HS, Ruth P, Perez-Reyes E, Flockerzi V, Hofmann F, Birnbaumer L, Brown AM. Normalization of current kinetics by interaction between the alpha 1 and beta subunits of the skeletal muscle dihydropyridine-sensitive Ca2+ channel. Nature 352: 527–530, 1991 [DOI] [PubMed] [Google Scholar]
- 25.Lesh RE, Somlyo AP, Owens GK, Somlyo AV. Reversible permeabilization: a novel technique for the intracellular introduction of antisense oligodeoxynucleotides into intact smooth muscle. Circ Res 77: 220–230, 1995 [DOI] [PubMed] [Google Scholar]
- 26.Liao P, Yu D, Lu S, Tang Z, Liang MC, Zeng S, Lin W, Soong TW. Smooth muscle-selective alternatively spliced exon generates functional variation in Cav1.2 calcium channels. J Biol Chem 279: 50329–50335, 2004 [DOI] [PubMed] [Google Scholar]
- 27.Link TE, Murakami K, Beem-Miller M, Tranmer BI, Wellman GC. Oxyhemoglobin-induced expression of R-type Ca2+ channels in cerebral arteries. Stroke 39: 2122–2128, 2008 [DOI] [PMC free article] [PubMed] [Google Scholar]
- 28.Mikami A, Imoto K, Tanabe T, Niidome T, Mori Y, Takeshima H, Narumiya S, Numa S. Primary structure and functional expression of the cardiac dihydropyridine-sensitive calcium channel. Nature 340: 230–233, 1989 [DOI] [PubMed] [Google Scholar]
- 29.Neild TO, Keef K. Measurements of the membrane potential of arterial smooth muscle in anesthetized animals and its relationship to changes in artery diameter. Microvasc Res 30: 19–28, 1985 [DOI] [PubMed] [Google Scholar]
- 30.Nelson MT, Standen NB, Brayden JE, Worley JF., 3rd Noradrenaline contracts arteries by activating voltage-dependent calcium channels. Nature 336: 382–385, 1988 [DOI] [PubMed] [Google Scholar]
- 31.Rhee SW, Stimers JR, Wang W, Pang L. Vascular smooth muscle-specific knockdown of the noncardiac form of the L-type calcium channel by microRNA-based short hairpin RNA as a potential antihypertensive therapy. J Pharmacol Exp Ther 329: 775–782, 2009 [DOI] [PMC free article] [PubMed] [Google Scholar]
- 32.Soldatov NM. Molecular diversity of L-type Ca2+ channel transcripts in human fibroblasts. Proc Natl Acad Sci USA 89: 4628–4632, 1992 [DOI] [PMC free article] [PubMed] [Google Scholar]
- 33.Strutz F, Okada H, Lo CW, Danoff T, Carone RL, Tomaszewski JE, Neilson EG. Identification and characterization of a fibroblast marker: FSP1. J Cell Biol 130: 393–405, 1995 [DOI] [PMC free article] [PubMed] [Google Scholar]
- 34.Tang ZZ, Liang MC, Lu S, Yu D, Yu CY, Yue DT, Soong TW. Transcript scanning reveals novel and extensive splice variations in human L-type voltage-gated calcium channel, Cav1.2 alpha1 subunit. J Biol Chem 279: 44335–44343, 2004 [DOI] [PubMed] [Google Scholar]
- 35.Triggle DJ. Calcium-channel drugs: structure-function relationships and selectivity of action. J Cardiovasc Pharmacol 18, Suppl 10: S1–S6, 1991 [PubMed] [Google Scholar]
- 36.Welling A, Ludwig A, Zimmer S, Klugbauer N, Flockerzi V, Hofmann F. Alternatively spliced IS6 segments of the alpha 1C gene determine the tissue-specific dihydropyridine sensitivity of cardiac and vascular smooth muscle L-type Ca2+ channels. Circ Res 81: 526–532, 1997 [DOI] [PubMed] [Google Scholar]
- 37.Wellman GC, Nathan DJ, Saundry CM, Perez G, Bonev AD, Penar PL, Tranmer BI, Nelson MT. Ca2+ sparks and their function in human cerebral arteries. Stroke 33: 802–808, 2002 [DOI] [PubMed] [Google Scholar]
- 38.Wu BN, Luykenaar KD, Brayden JE, Giles WR, Corteling RL, Wiehler WB, Welsh DG. Hyposmotic challenge inhibits inward rectifying K+ channels in cerebral arterial smooth muscle cells. Am J Physiol Heart Circ Physiol 292: H1085–H1094, 2007 [DOI] [PubMed] [Google Scholar]
- 39.Zuber MX, Goodman DW, Karns LR, Fishman MC. The neuronal growth-associated protein GAP-43 induces filopodia in non-neuronal cells. Science 244: 1193–1195, 1989 [DOI] [PubMed] [Google Scholar]


