Abstract
Thrombospondin-1 is a trimeric, modular calcium-binding glycoprotein. The subunit is composed of an N-terminal module; oligomerization domain; stalk modules including a von Willebrand factor type C module, three properdin or thrombospondin type 1 repeat (TSR) modules, and two thrombospondin-type EGF-like modules; and a C-terminal signature domain comprising single copies of the epidermal growth factor (EGF)-like, wire, and lectin-like modules. Conformational changes in the signature domain influence ligand binding to the N-terminal modules. Interactions have been demonstrated among the modules of the signature domain and the thrombospondin-type EGF-like modules. We have extended this analysis to the rest of the stalk modules. Differential scanning calorimetry revealed interactions between the most C-terminal TSR module and the EGF-like modules. Calorimetry and differences in expression levels of single versus tandem modules indicated that the three TSRs interact with each other as well. No evidence of interactions between the von Willebrand factor type C and TSR modules were detected by differential scanning calorimetry, circular dichroism, or intrinsic fluorescence. These results indicate that the TSR and thrombospondin-type EGF-like stalk modules act as a unit that may relay conformational information between the N-terminal and C-terminal parts of the protein.
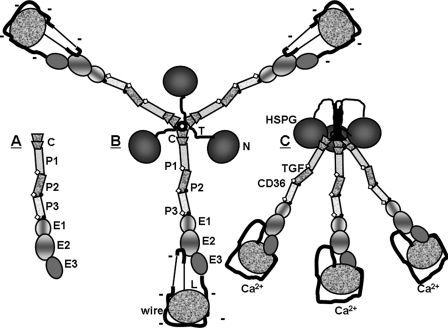
Thrombospondin-1 (TSP-1)2 is a major secreted protein of platelets that plays multiple roles after vascular injury (1, 2). TSPs are a family of multimodular, calcium-binding, extracellular glycoproteins. There are five family members in tetropods, each of which has a specific pattern of expression in embryonic and adult tissues (3). TSPs have two unique features, a signature domain comprising single copies of EGF-like, Ca2+-binding wire, and lectin-like modules and the TSP-type EGF-like module in which Cys4 and Cys5 are separated by two rather than one residue (3, 4). The family falls into two groups: A or trimeric TSPs, TSP-1 and TSP-2; and B or pentameric TSPs, TSP-3, TSP-4, and TSP-5. As depicted in Fig. 1, a subunit of the group A TSPs is composed of an N-terminal module tethered to an oligomerization domain, a von Willebrand Factor type C (vWF-C) module, three properdin or TSP type 1 repeat (TSR) modules, two TSP-type EGF-like modules, and the signature domain (3, 4). Subunits of group B TSPs lack vWF-C and TSR modules and have an extra TSP-type EGF-like module (4). Multiple interactions have been demonstrated among the modules of the signature domain of Ca2+-replete TSP-2 and TSP-5 (5, 6) and between the signature domain wire and second TSP-type EGF-like module of Ca2+-replete TSP-2 (5, 7).
FIGURE 1.
Schematics of (A) TSP-1 stalk modules studied in this paper, (B) TSP-1 in its Ca2+-depleted conformation, and (C) TSP-1 in its Ca2+-replete formation. Parts of TSP-1 in panels A and B are labeled as follows: N, N-terminal module; T, tether; C, vWF-C module; P, properdin or TSR module, E, EGF-like module; wire, Ca2+-binding repeats with 26 Ca2+-binding sites; and L, lectin-like module. The TSP-type EGF-like modules, E1 and E2, contain central shading. Sites of binding to heparin sulfate proteoglycan (HSPG), latent transforming growth factor-β (TGF), and CD36 are indicated in panel C. The schematics have been drawn based on structures described in the text. Sites of fucosylation of TSRs are indicated by open diamonds, and inter-module CPIXG sequences between P2 and P3 and between P3 and E1 are indicated with dots. As per the “Discussion,” changes in conformation and charge density of the signature domain due to gain or loss of Ca2+ are proposed to be propagated throughout trimeric TSP-1 by the stalk modules.
TSP-1 has a distinctive appearance when examined by rotary shadowing electron microscopy: three bunched globules, which are thought to be the N-terminal modules, are connected by three stalks to three larger globules thought to be the C-terminal signature domains (4). Rotary shadowing electron microscopy demonstrates a striking conformational change upon removal of Ca2+ from the C-terminal signature domain with apparent lengthening of the stalk and loss of size of the C-terminal globules (8–10). Considerations of structures of the parts of TSP-1 indicate that the vWF-C, TSR, and TSP-type EGF-like modules form the stalk in Ca2+-replete TSP-1 (4), as depicted in Fig. 1. Immunochemical studies suggest that lengthening of the stalk is due, at least in part, to unraveling of two of the 13 Ca2+-binding repeats of the wire module (11).
Removal of Ca2+ from binding sites on the C-terminal signature domain impacts binding of ligands or antibodies to the N-terminal modules of TSP-1 (12). The N700S polymorphism in TSP-1 that alters coordination of Ca2+ by the first Ca2+-binding wire repeat (13) also impacts interactions of the N-terminal modules with ligands (14). These observations indicate that TSP-1 possesses an allosteric mechanism whereby changes in the C-terminal signature domain are transmitted to the N-terminal modules. We have reported that the two TSP-type EGF-like modules and the signature domain EGF-like module interact with each other, suggesting a mechanism by which conformational changes in the signature domain can be propagated N-terminal as far as the first TSP-type EGF-like module (15). We have now explored the potential of EGF-like modules to work with TSR and vWF-C modules to transmit conformational information between the two ends of TSP-1.
MATERIALS AND METHODS
Cloning of Truncation Constructs into the p.coco Transfer Vector
The recombinant proteins, denoted by modules that were present as described in Table 1, were expressed in a baculovirus system (16–19). The constructs were planned based on comparisons of encoding exons and sequences of vWF-C, TSR, and EGF-like modules in TSP-1 to these modules in other proteins. PCR-amplified segments of cDNA were cloned into a modified pAcGP67 transfer vector, p.coco, in which cloning sites are flanked by 5′ DNA encoding a signal sequence and 3′ DNA encoding a polyhistidine tag as described (18). Production of E12 and E123 has been described previously (15).
TABLE 1.
Compositions and yields of constructs
Residues are numbered in relation to the initiating methionine. Summary of the recombinant constructs. Modules within constructs are named “C” for vWF-C module, “P” for the three properdin or TSR modules, and “E” for three EGF-like modules as in Fig. 1A. Tandem modules are numbered in order from the most N-terminal to the most C-terminal. N-terminal and C-terminal sequences of the recombinant segments are based on the sequence that begins with the initiating Met of unprocessed TSP-1. Proteins had additional residues, ADPG… at the N-terminal ends and ….ZLELVPRGSAAGHHHHHH at the C-terminal ends with the identities of Z indicated in the table. Size (Mr) was calculated based on protein sequence ignoring the contribution of carbohydrates. Extinction coefficients (EC) are calculated based on the content of Trp, Tyr, and disulfides. The yields are given as mean when two preparations were done and mean ± S.D. when three or more preparations were done.
| Constructs | Residues | N-terminal sequence | C-terminal sequence | Za | Mr | EC | Yields |
|---|---|---|---|---|---|---|---|
| g/liter−1cm−1 | mg/liter | ||||||
| C | 312–374 | LRRPPL… | …CPRCWP | P | 9.4 | 1.6 | 12.2 |
| P1 | 375–433 | SDSADD… | …CDKRFK | H | 8.8 | 1.9 | <0.1 |
| P2 | 434–490 | QDGGWS… | …KKDACP | G | 8.0 | 2.1 | <0.1 |
| P3 | 491–548 | INGGWG… | …KQDCPI | I | 8.4 | 2.0 | 4.1 ± 0.4 |
| P12 | 375–490 | SDSADD… | …KKDACP | G | 15.0 | 2.3 | 6.9 ± 0.1 |
| P23 | 434–548 | QDGGWS… | …KQDCPI | I | 14.2 | 2.4 | 6.9 ± 0.1 |
| P123 | 375–548 | SDSADD… | …KQDCPI | I | 21.1 | 2.4 | 6.5 ± 0.2 |
| CP123 | 312–548 | LRRPPL… | …KQDCPI | I | 28.3 | 2.3 | 7.8 |
| P3E1 | 491–587 | INGGWG… | …GIQCT | T | 12.3 | 2.8 | 9.5 |
| P3E123 | 491–691 | INGGWG… | …GIICGE | A | 23.8 | 1.4 | 13 ± 5.1 |
| CP123E12 | 312–645 | LRRPPL… | …NKQVCK | G | 38.6 | 2.0 | 9.8 |
a Z, variable residue in the ZLEL … C-terminal tail; Mr, molecular weight; EC, extinction coefficient.
Expression and Purification of the Recombinant Proteins
Recombinant infectious viruses were created and amplified in adherent SF9 cells. Passage three of the virus (>100 plaque-forming units/ml) was used to infect suspended High-Five cells in SF-900 II serum-free medium at 22 °C. Conditioned medium was harvested after 60–65 h and dialyzed into 10 mm MOPS, 300 mm NaCl, 2 mm CaCl2, pH 7.5. Proteins were purified from dialyzed medium as described (15) and characterized for purity in SDS-PAGE without or with prior reduction of the SDS-protein complexes. To detect proteins produced at low levels, Western blotting was performed with monoclonal antibody 2A6.21 that recognizes the linker sequence, …LELVPRGSAAG…, between the C terminus of the expressed sequence and the His tag. Protein concentration was determined by A280 nm using extinction coefficients predicted by the content of Trp, Tyr, and disulfides (Table 1) (20, 21).
Differential Scanning Calorimetry (DSC)
Proteins, >1 mg/ml, were dialyzed into 10 mm MOPS, 150 mm NaCl, pH 7.5, containing different concentrations of CaCl2. DSC was done using a Microcal VP differential scanning calorimeter from 20 to 85 °C at a rate of 60 °C/h. Samples were cooled and reheated to assess the reversibility of the denaturation process. All DSC experiments were repeated twice. Data were analyzed and fitted with Origin 7.0 (OriginLab, Northampton, MA). The reference buffer data were subtracted from the sample data. The data were normalized for sample concentration and cell volume to convert from calorie/degree to calorie/mol/degree. The baselines were created with the software baseline progress function. The curves were then deconvoluted into one, two, or more transitions using Origin 7.0. Deconvolutions were done without assumptions about peak melting temperature (Tm) and enthalpy change (ΔH) of the transition.
Far UV Circular Dichroism (CD)
Samples at concentrations between 8 and 15 μm (0.12–0.32 mg/ml) were dialyzed against 10 mm Tris, 150 mm NaCl, 2 mm CaCl2, pH 7.5. Far UV CD studies were done in a 0.1-cm path-length quartz cuvette holding a sample volume of 300 μl on an Aviv 62A DS CD spectrometer. Data were collected from 200 to 260 nm and at temperatures between 25 and 70 °C to define the denaturation profile of the proteins. The temperature was raised at 10 °C/min, and kept for 5 min at the target temperature prior to taking the spectrum. In addition to analyzing each recombinant protein alone, we mixed C and P123 (see Table 1) in equal molar concentrations. All far UV CD experiments were repeated three times.
Intrinsic Fluorescence
The samples were dialyzed against 10 mm Tris, 150 mm NaCl, 2 mm CaCl2, pH 7.5. Fluorescence emission spectra of the samples were obtained with a JY Fluoromax-3 fluorometer with excitation at 295 nm, and emission from 310 to 450 nm. Slits were 2 nm for excitation and 4 nm for emission. The thermal denaturation experiment was taken with different temperatures between 25 and 70 °C. The fluorescence spectra were normalized with protein concentration. To test the similarity further, the center mass of the spectra were analyzed in terms of the center of the spectra mass in energy using Equation 1,
 |
where vg is the average energy of the emission spectrum in reciprocal (cm−1) and Ii is the fluorescence intensity at wave number vi (22). Each fluorescence experiment was repeated three times.
RESULTS
Production of Recombinant Proteins
Recombinant proteins comprising single or tandem stalk modules of TSP-1; denoted by a 1-letter shorthand plus numbers; C, P1, P2, P3, P12, P23, P123, CP123, P3E123, P3E1, and CP123E12; were expressed with a baculovirus system (Table 1). The yields of purified recombinant constructs were variable (Table 1). P1 or P2 were detected by Western blotting of conditioned medium (data not shown). However, secretion of P1 or P2 was <0.1 mg/liter, too low for purification of workable amounts of protein. The other proteins were purified utilizing the affinity of the C-terminal poly-His sequence for immobilized nickel-nitrilotriacetic acid. The resulting proteins were >95% pure as assessed by SDS-PAGE without or with reducing agent, soluble at concentrations of >2 mg/ml in physiological saline, and amenable to the various analyses.
Studies of the Third TSR Module without or with EGF-like Modules
We previously reported interactions among the two TSP-type EGF-like modules, E1 and E2, and the EGF-like module of the signature domain, E3 (15). These interactions influenced the tertiary structure of E2 as determined by DSC, reactivity toward monoclonal antibodies specific for E2, and binding of Ca2+ to the canonical Ca2+-binding site in E2. To learn whether the interactions are part of a larger series of interactions that extend more N-terminal, we compared the third TSR, P3, by itself and in tandem with E1 (P3E1) and E123 (P3E123). All three proteins were expressed well (Table 1).
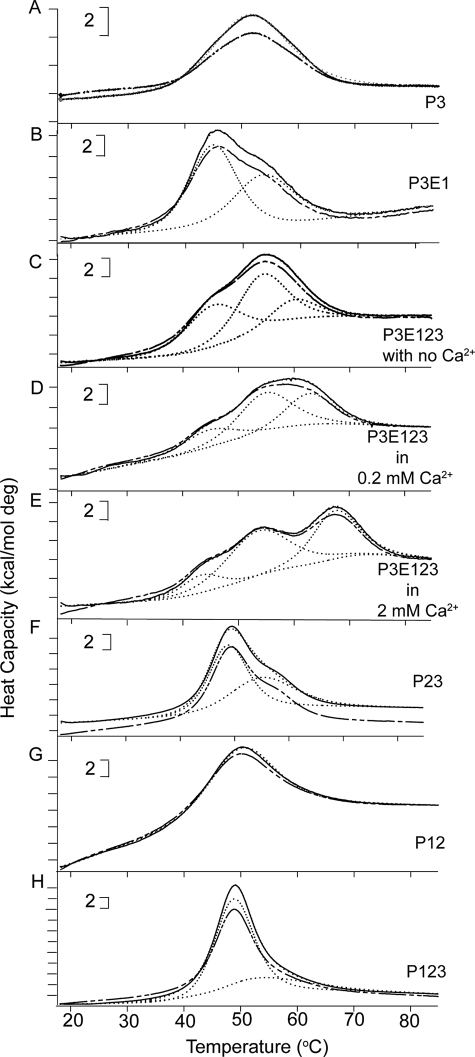
In DSC, P3 exhibited a single reversible transition with Tm of 51.2 °C (Fig. 2A). There was no change in χ2 when modeled as two transitions rather than one (not shown). The ΔH of P3, measured by integrating below the melting curve with the baseline subtracted, was 87 kcal/mol (Table 2).
FIGURE 2.
DSC of the recombinant TSR-containing constructs. Thermal melting curves of: A, P3; B, P3E1; C, P3E123 in EDTA; D, P3E123 in 0.2 mm Ca2+; E, P3E123 in 2 mm Ca2+; F, P23; G, P12; and H, P123. The temperature was raised from 20 to 85 °C at a rate of 60 °C/h. Shown are the initial curves, solid lines; repeat curves, broken lines; fitted deconvoluted curves, dotted lines; and sum of the deconvoluted curves, thin dotted lines (clearly visible only in panel F due to overlap with the initial curves in the other panels). Brackets indicate heat capacity.
TABLE 2.
Summary of DSC results
Data on deconvoluted peaks were generated by Origin 7.0. The χ2 listed were not improved by adding another transition to the analysis. The data for E123 and E12 are from Ref. 15 and included here in italics for comparison of the larger constructs with E123 or E12.
| Modules and conditions | Deconvoluted peaks |
|||
|---|---|---|---|---|
| No. of peaks | χ2 | Tm | ΔH | |
| ×10−3 | °C | kcal/mol | ||
| P3 | 1 | 12.0 | 51.2 ± 0.0 | 87 ± 0.0 |
| P3E1 | 2 | 7.5 | 44.9 ± 0.0 | 87 ± 1.1 |
| 53.7 ± 0.1 | 67 ± 1.1 | |||
| P3E123 with no Ca2+ | 3 | 2.8 | 45.7 ± 0.1 | 59 ± 0.8 |
| 54.3 ± 0.1 | 69 ± 0.0 | |||
| 59.9 ± 0.1 | 24 ± 0.8 | |||
| P3E123 in 0.2 mm Ca2+ | 3 | 6.1 | 45.0 ± 0.0 | 68 ± 0.5 |
| 54.0 ± 0.1 | 71 ± 0.0 | |||
| 60.7 ± 0.1 | 20 ± 0.5 | |||
| P3E123 in 2 mm Ca2+ | 3 | 8.7 | 43.8 ± 0.1 | 55 ± 1.0 |
| 53.9 ± 0.1 | 66 ± 1.5 | |||
| 67.4 ± 0.0 | 22 ± 0.6 | |||
| E123 with no Ca2+ | 1 | 21.8 | 58.5 ± 0.0 | 38 ± 0.3 |
| E123 in 0.2 mm Ca2+ | 1 | 25.6 | 63.2 ± 0.0 | 42 ± 0.2 |
| E123 in 2 mm Ca2+ | 1 | 26.8 | 67.0 ± 0.0 | 63 ± 0.3 |
| P23 | 2 | 2.3 | 48.9 ± 0.0 | 68 ± 0.0 |
| 54.2 ± 0.0 | 69 ± 0.0 | |||
| P12 | 1 | 2.0 | 50.3 ± 0.0 | 93 ± 0.3 |
| P123 | 2 | 9.1 | 48.8 ± 0.0 | 162 ± 3.6 |
| 54.3 ± 0.5 | 51 ± 3.8 | |||
| CP123 | 2 | 16.7 | 48.0 ± 0.0 | 161 ± 2.9 |
| 53.2 ± 0.2 | 45 ± 2.9 | |||
| CP123E12 with no Ca2+ | 3 | 38.7 | 45.3 ± 0.2 | 66 ± 0.8 |
| 50.1 ± 0.0 | 143 ± 2.6 | |||
| 53.2 ± 0.1a | 136 ± 3.8 | |||
| CP123E12 in 2 mm Ca2+ | 4 | 20.1 | 45.3 ± 0.6 | 60 ± 0.6 |
| 50.3 ± 0.1 | 180 ± 3.8 | |||
| 55.7 ± 0.4 | 36 ± 2.9 | |||
| 60.4 ± 0.6 | 53 ± 1.0 | |||
| E12 in EDTA | 1 | 5.7 | 52.0 ± 0.0 | 52 ± 0.2 |
| E12 in 2 mM Ca2+ | 1 | 10.2 | 58.3 ± 0.0 | 43 ± 0.4 |
a This transition likely is the sum of two transitions, as described in the text.
P3E1 denatured reversibly with a peak and shoulder that deconvoluted into two transitions with a Tm of 44.9 °C and ΔH of 87 kcal/mol and a Tm of 53.7 °C and ΔH of 67 kcal/mol (see Fig. 2B and Table 2). This result was unexpected inasmuch as E1 by itself has no transition up to 85 °C (15). E123 has a single reversible transition in the range of 58–68 °C depending on Ca2+ concentration and attributable to changes in E2 (15) (these transitions are described in Table 2 to allow comparisons). We therefore performed DSC on P3E123 in the absence of Ca2+, 0.2 mm Ca2+, or 2 mm Ca2+ (Fig. 2, C–E). The transitions for P3E123 were reversible in all conditions, and the curves were different in different Ca2+ concentrations. The curves deconvoluted into three transitions (Table 2), with no improvement in χ2 when fitted to four transitions. A transition at ∼45 °C was found in all three conditions with a ΔH of 55–68 kcal/mol. The second transition was at ∼54 °C with a ΔH of 66–71 kcal/mol. Thus, the E123 tandem unit, like E1 alone, interacts with P3 to form a structure that denatures with transitions at ∼45 and ∼54 °C of approximately equal ΔH. The third fitted transition varied depending on the concentration of Ca2+: 59.9 °C in the absence of Ca2+, 60.7 °C in 0.2 mm Ca2+, and 67.4 °C in 2 mm Ca2+ with a ΔH of 20–24 kcal/mol. The ΔH values of the third transition were less than the single transition found with E123 (see Table 2). Overall, the results indicate that P3 and E1 interact to form a structure that denatures at ∼45 °C, the denatured structure influences the denaturation of P3, and the denatured P3E1 pair influences the denaturation of E2 within P3E123.
Studies of Tandem TSR Modules
The interaction of P3 with E123 extends the array of interacting stalk modules N-terminal from E1 to P1 and raises questions of whether the array extends more N-terminal, beginning with the question of whether and how P2 interacts with P3. Evidence for an interaction was found in the crystal structure of the second and third TSR modules (P23) of human TSP-1, which has been solved by Tan et al. (23). Each TSR is composed of three strands: a uniquely structured N-terminal strand that interacts with a two-stranded β-sheet. The structure is stabilized by the so-called CWR-layered core structure of stacked Trp and Arg capped at either end by Cys. A proline is present in the cis configuration between P2 and P3 and interacts with residues in both modules, creating a 900-Å2 hydrophobic interface between the two modules. High-Five cells expressed P2 alone poorly (Table 1) even though P2 has been successfully produced in bacteria and refolded (24). P23, in contrast, was expressed well (Table 1). This difference in expression suggests that the folding pathway for P2 during secretion is more efficient when P2 is in tandem with P3 and is indirect evidence for interactions between P2 and P3. P23 denatured with a peak and obvious shoulder (Fig. 2F). The curve deconvoluted into two transitions, one at 48.9 °C with a ΔH of 68 kcal/mol and a second at 54.2 °C with a ΔH of 69 kcal/mol (see Fig. 2F and Table 2).
As with P2, P1 was secreted minimally by itself (Table 1). Secretion of P1 and P2 was greatly improved when the two modules were expressed in tandem (Table 1). The pair denatured as a single reversible transition at 50.3 °C with a ΔH of 93 kcal/mol (see Fig. 2G and Table 2), very similar to the denaturation of P3 alone. χ2 improved little when fitted as two transitions rather than one (1.9 × 10³ versus 2.0 × 10³). The single transition and low ΔH suggest that P12 denatures as a unit.
P123 denatured as a peak with a shoulder (Fig. 2H). Deconvolution into two and three transitions yielded χ2 of 9.1 × 10³ and 8.9 × 10³, respectively. Thus, the denaturation curve for P123 is similar to the sum of the curves for P12 and P23: a 48.8 °C transition with a ΔH of 162 kcal/mol and 54.3 °C transition with a ΔH of 51 kcal/mol (see Table 2).
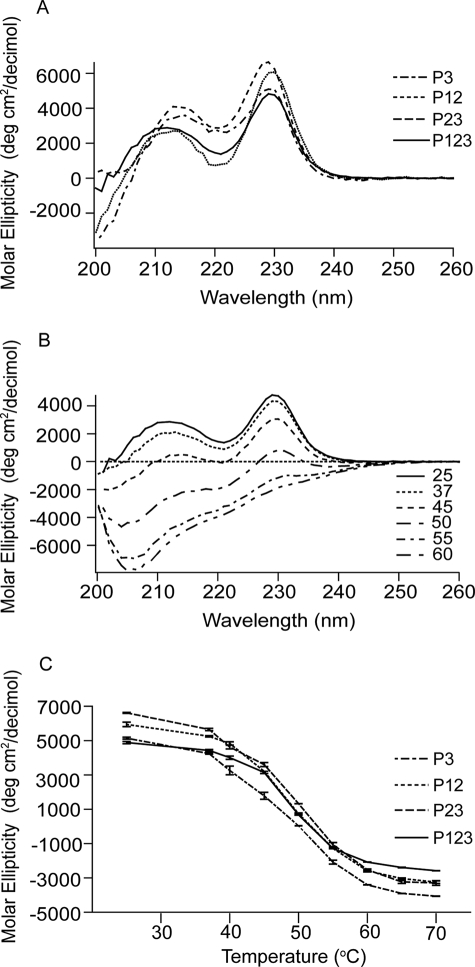
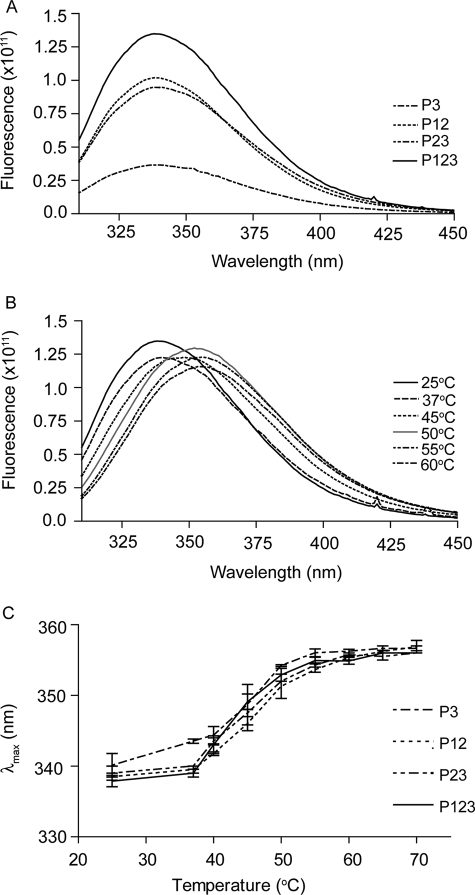
Denaturation of the TSR constructs was also assessed by far UV CD (Fig. 3) and intrinsic fluorescence (Fig. 4). In far UV CD, all constructs had a major positive peak at ∼229 nm and a minor positive peak at 211–214 nm (Fig. 3A). These patterns are similar to previously published results with baculovirally expressed P123 and P3 constructs (17), P2 refolded after expression in bacteria (24) and properdin (a protein with six TSRs) purified from human serum (25). Upon heating, both positive peaks were lost (Fig. 3B). The midpoints of the transitions were ∼50 °C (Fig. 3C). We attribute the far UV CD spectrum to the influence (26) of the three conserved tryptophans stacked in a similar environment in the CWR core structure, although we cannot rule out a contribution from the distorted N-terminal strands of the TSRs. Intrinsic fluorescence revealed emission λmax of ∼337 nm at 25 °C (Fig. 4A) that red-shifted upon heating (Fig. 4B). Such behavior is compatible with movement of the Trp from the CWR layer structure to a more hydrophilic environment. The midpoints for the change in intrinsic fluorescence was ∼49 °C (Fig. 4C), very similar to the midpoints for loss of the positive CD peaks.
FIGURE 3.
Far UV CD spectroscopy of the recombinant TSR constructs. A, far UV CD results of P123, P12, P23, and P3 at 25 °C. B, spectra of P123 at different temperatures. C, change of the major 229-nm peaks of recombinant TSRs upon heating. Error bars, mean ± S.E. of at least three experiments.
FIGURE 4.
Intrinsic fluorescence of the recombinant TSRs. A, emission spectra of the recombinant TSRs at 25 °C. The proteins, 0.25 mg/ml, were excited with 295 nm. B, emission spectrums of P123 at different temperatures. C, changes in the peak emission (λmax) upon heating for the four constructs. Error bars, mean ± S.E. of at least three experiments.
Studies of the vWF-C and TSR Modules in Tandem
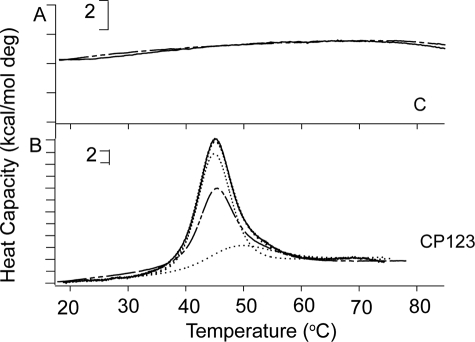
Many extracellular proteins contain vWF-C modules (27). The NMR structures of the vWF-C module from the α1 subunit of type II procollagen demonstrated two submodules with flexibility in between (28). In contrast, the N-terminal vWF-C module of cross-veinless 2 complexed to bone morphogenetic protein 2 crystallized in a single conformation (27). The N-terminal submodules in both structures have similarities to a fibronectin type I module, whereas the C-terminal submodules are less structured. The submodule structure is compatible with the lack of a clear melting transition when DSC was performed on the recombinant vWF-C module of TSP-1, as shown in Fig. 5A and described previously (16).
FIGURE 5.
DSC results of the vWF-C (C) module alone and in tandem with P123. A, C; and B, CP123. Shown are initial denaturations, solid lines; repeat denaturation, broken lines; fitted results, dotted lines; and sum of the deconvoluted curve, thin dotted line. Brackets indicate heat capacity.
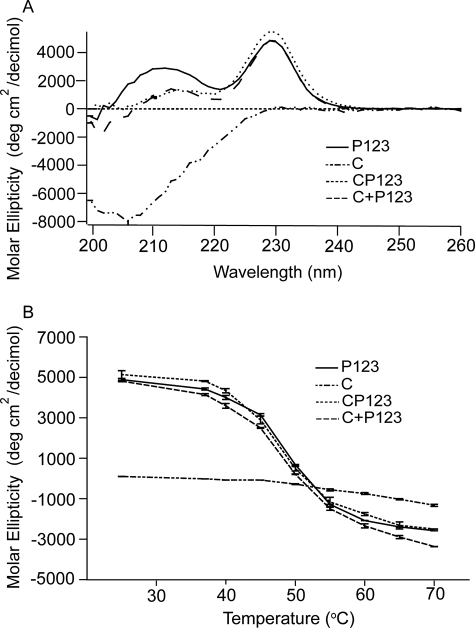
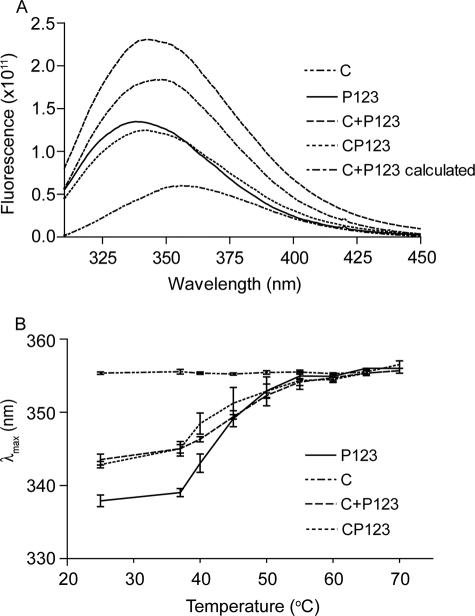
The shapes of the DSC melting curves of P123 and CP123 were reversible and almost the same (see Fig. 2H and 5B). Denaturation of CP123, like that of P123, was deconvoluted into two transitions by Origin 7.0 (see Fig. 5B and Table 2). The far UV CD spectrum of the vWF-C modules of TSP-1 (Fig. 6A) was as published previously by Misenheimer et al. (16), with a positive band at 229 nm and negative band with the minimum at 206 nm. Upon heating, the signal of C at 229 nm decreased gradually without a clear transition (16). CP123 had positive peaks at 229 and 211 nm (Fig. 6A). The spectra of CP123 and the equal molar mix of C and P123 overlapped (Fig. 6A). The signals of P123, CP123, and the mix of C + P123 at 229 nm decreased as the temperature increased with a half-maximal decrease at ∼49 °C (Fig. 6B). These results indicate that C and P123 do not interact in a way that influences the far UV CD of either part of the protein. C, CP123, P123, and the mixture of C and P123 were also analyzed by intrinsic fluorescence. At 25 °C, C had a λmax of 357 nm, P123 had a λmax at 337 nm, and CP123 or a mix of C + P123 had a λmax at 343 nm (Fig. 7A). Upon heating, the λmax of C remained at 357 nm from 25 to 70 °C. The λmax changes of CP123 and C + P123 overlapped with a half-maximal change at 49 °C (Fig. 7B). Center mass analysis is a sensitive measure of possible differences in fluorescence (22). The center mass of CP123 was 356 nm (vg = 28,050 cm−1) and C + P123 was 355 nm (vg = 28,150 cm−1). Compared with the center masses of C at 363 nm (vg = 27,520 cm−1) and P123 at 349 nm (vg = 28,640 cm−1), the center masses of CP123 and C + P123 were very similar, with contributions from both C and P123.
FIGURE 6.
Far UV CD of C, CP123, P123, and a mixture of C and P123. A, shown are the recombinant C, P123, CP123, and the mixture of C and P123 in equal molar concentrations. B, heat denaturation of the major 229-nm peak. Error bars, mean ± S.E. of at least three experiments.
FIGURE 7.
Intrinsic fluorescence of C, CP123, P123, and a mixture of C and P123. A, emission spectrum of C, P123, CP123, and an equal molar mixture of C and P123 (C + P123), 0.25 mg/ml, excited at 295 nm at 25 °C. Both CP123 and C + P123 have their λmax at 343 nm. B, shift of λmax as a function of temperature. Error bars, mean ± S.E. of at least three experiments.
DSC of the Six Stalk Modules in Tandem
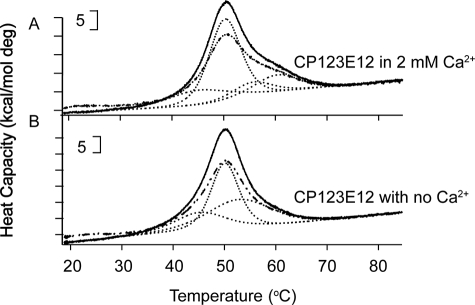
In the crystal structure of the TSP-type EGF-like modules and signature domain of TSP-2 (5), E3 is aligned about 60° from the axis of E1 and E2 and is the beginning of the complex C-terminal signature domain structure; we truncated the constructs between E2 and E3. CP123E12 melted with a broad peak with an overall maximum at ∼50.0 °C (Fig. 8). The ΔH values for denaturation of CP123E12 were 341 kcal/mol in the absence of Ca2+ and 335 kcal/mol in 2 mm Ca2+ (see Table 2). The χ2 of deconvolutions of the DSC melting curve of CP123E12 in 2 mm Ca2+ improved 15–20% when modeled as four transitions rather than three, whereas the χ2 of deconvolutions of CP123E12 in the absence of Ca2+ modeled as three and four transitions were similar. The transitions fit the transition of smaller constructs well (Table 2). Thus, the four transitions of CP123E12 in 2 mm Ca2+ can be attributed to the following: 45.3 °C, changes of the interface of P3 and E1; 50.3 °C, denaturation of P123; 55.7 °C, denaturation of P3 within the tandem modules; and 60.4 °C, denaturation of E12. The 53.2 °C fitted transition of CP123E12 in the absence of Ca2+ can be attributed to two overlapping transitions, the denaturation of P3 (∼55 °C) and the denaturation of E12 (∼52 °C).
FIGURE 8.
DSC of tandem stalk modules. A, CP123E12 in 2 mm Ca2+; and B, CP123E12 with no Ca2+. Shown are initial curves, solid lines; repeat curves, broken lines; fitted results, dotted lines; and sum of the deconvoluted curves, thin dotted lines (not clearly visible due to overlap with the initial curves). Brackets indicate heat capacity.
DISCUSSION
These studies have provided evidence for interactions among the TSR and TSP-type EGF-like stalk modules of TSP-1 and support the possibility that such interactions allow the N-terminal modules or C-terminal signature domains to respond to ligation events at the opposite end of the trimeric molecule. Our discussion is based on a model in which there are consecutive interactions among the stalk modules (4). Such “head-to-tail” interactions are thought to underlie the stiff rod-like configurations of tandem Ca2+-binding EGF-like modules of Notch (29) and TSR modules of properdin (30).
Unusual post-translational modifications of the stalk modules of the group A TSPs suggest that processing of these modules in the secretary pathway presents a substantial challenge to cells and requires special mechanisms to facilitate and monitor folding. Modifications include C-mannosylation and O-fucosylation of P1, P2, and P3 (31) and O-glucosylation of E1 (32) (these modifications were found when the recombinant proteins used in the present study were analyzed by mass spectrometry (17,31) and data not shown). In particular, modification of a Ser or Thr in the sequence between Cys1 and Cys2 of the TSR module by fucosyltransferase 2 is important for protein maturation and secretion of ADAMTS (33) and ADAMTS-like (34) proteins and presumably of subfamily A TSPs as well. In the crystal structure of P23, the fucosylated residue in P2 is close to the junction between P2 and P3 (23). The fucosylated residue in P3 is expected to be similarly close to the junction between P3 and E1. P3, which has been shown to be O-fucosylated by High-Five cells (31), was produced when expressed alone, although the yields of P3 with an adjacent module, P23 or P3E1, were somewhat greater than P3 (Table 1). This finding and the needs for P1 to be expressed in tandem with P2 and for P2 to be expressed in tandem with P1 or P3 suggest that individual TSRs fold and are fucosylated more readily when an adjacent module is present. However, further experiments are needed to evaluate possible adverse effects of the N- and C-terminal sequences introduced into the recombinant proteins by our cloning and expression strategy. These “tails” may be deleterious to folding, glycosylation, and/or secretion of P1 and P2. It is of interest that glucosylation of a Ser or Thr within a conserved sequence of certain EGF-like modules, such as is present in E1 (32), may also be needed for proper folding (35). Finally, the N-linked carbohydrate, as is introduced into the vWF-C module (16), allows quality control monitoring of correct folding by the calnexin/calreticulin, glucosidase/glucose transferase system (36).
P3 denatured in DSC, far UV CD, and intrinsic fluorescence experiments in a single transition at ∼50 °C, indicating that the three readouts report the same denaturation process. A ∼54 °C DSC transition was found for P3E1, P23, P123, and P3E123, but not for P12, E12, or E123 (see Fig. 2 and Table 2), and is therefore attributed to the denaturation of P3 within the tandem modules, i.e. an adjoining module on either side increases stability of P3. An interface between P2 and P3 was demonstrated in the crystal structure of P23 with a linking Pro interacting with both modules (23). The Pro is common in TSRs of the type found in TSP-1 (17, 30). The intermodule linking sequence between Cys6 of P2 and the first stacked Trp of P3 and between Cys6 of P3 and Cys1 of E1 are similar: …CPINGGW… and …CPIDGC…. Thus P3 may abut E1 the same way that P2 abuts P3. The connector between P1 and P2 (…CDERFKQDGGW…) is longer and would require that the P12 interface be different from P23. In DSC, P12 melted with an apparent single transition, and a Tm and ΔH that were similar to what was found with P3 alone (see Fig. 2, A and H, and Table 2). This finding suggests that the interface between P1 and P2 is more intimate than the interface between P2 and P3, such that P12 denatures as a single unit. The DSC profile of P123 was similar to the sum of the profiles of P12 and P23. Thus, DSC indicates that each of the three TSRs is sensitive to immediately surrounding modules, and changes impacting P3 can be propagated N-terminal as far as P1.
The vWF-C module is needed for efficient synthesis of trimeric TSP-1 (37). Presumably due to its submodule structure (28), no clear transitions were observed upon heating of the isolated vWF-C module to TSP-1. The vWF-C module provides at least two potential sites of flexibility, the linker between the coiled-coil oligomerization domain and the first submodule, which is specifically susceptible to cleavage by ADAMTS-1 (38), and between the two submodules. The sequence linking Cys10 of the vWF-C module to the first stacked Trp of P1 is 9 residues long and a potential third site of flexibility. In comparisons of P123 and CP123, the presence of the vWF-C module did not perturb the spectral characteristics or thermal denaturation of P123, indicating little or no interaction between the vWF-C module and P1. Thus, the vWF-C module may act as a swivel to allow more C-terminal modules of one subunit to undergo directed folding without interference from the other two subunits.
The N700S polymorphism that alters coordination of Ca2+ by the first Ca2+-binding wire repeat (13, 14) and removal of Ca2+ from binding sites on the C-terminal signature domain (12) impact binding of ligands or antibodies to the N-terminal modules of TSP-1. Introduction of Ser700 into a construct containing the TSP-type EGF-like modules and C-terminal signature domain of TSP-2 perturbed the structure of E2 (13). The evidence that P123E12 functions as a unit delineates a mechanism for transmission of structural changes N-terminal from E2. One can only speculate about the effects of the transmission (12). The distance between the N-terminal and C-terminal residues of a subunit running through the coiled-coil oligomerization domain is predicted to be 50 Å (11). The flexible tether between the C-terminal residue of the structured N-terminal module and the N-terminal residue of the oligomerization domain has been deduced to be as long as 35 residues (39), which if completely extended could have a length of 90 Å. The length discrepancy between the tether and coiled-coil suggests that it is possible for the N-terminal modules to interact with the vWF-C modules, as shown in Fig. 1C. One hypothesis, therefore, is that interactions between N-terminal and vWF-C modules are modulated by changes in conformation and charge density of the signature domains caused by gain or loss of bound Ca2+ (Fig. 1). Conversely, ligands such as the glycosaminoglycans of heparan sulfate proteoglycans that bind the N-terminal modules in a monvalent or multivalent fashion (40) may change interactions between N-terminal and vWF-C modules and perturb the conformation of signature domains. The present results also raise the possibility that perturbations of the stalk modules, e.g. binding to CD36 (41) or latent TGF-β (42) by the TSR modules, are propagated both N-terminal and C-terminal. Finally, ligation of the N-terminal modules or C-terminal signature domains may modulate binding to stalk modules. Such a scenario would explain why antibody 133 to the wire module has effects on activation of latent transforming growth factor-β (19) and why antibody 4.1 to E3 diminishes adhesion via β1-integrins to TSR modules (43).
Acknowledgments
We thank C. Britt Carlson and Darrel McCaslin for helpful discussions and Douglas S. Annis for assistance at several important junctures. DSC and CD data were obtained at the Biophysics Instrumentation Facility at the University of Wisconsin, which was established with support from National Institutes of Health Grant BIR-9512577 and National Science Foundation Grant S10RR11790.
This work was supported, in whole or in part, by National Institutes of Health Grant ROIHL054462.
- TSP-1
- thrombospondin-1
- DSC
- differential scanning calorimetry
- vWF-C
- von Willebrand factor type C
- EGF
- epidermal growth factor
- MOPS
- 4-morpholinepropanesulfonic acid
- TSR
- thrombospondin type 1 repeat.
REFERENCES
- 1.Isenberg J. S., Frazier W. A., Roberts D. D. (2008) Cell Mol. Life Sci. 65, 728–742 [DOI] [PMC free article] [PubMed] [Google Scholar]
- 2.Bonnefoy A., Moura R., Hoylaerts M. F. (2008) Cell Mol. Life Sci. 65, 713–727 [DOI] [PMC free article] [PubMed] [Google Scholar]
- 3.Lawler J. (2000) Curr. Opin. Cell Biol. 12, 634–640 [DOI] [PubMed] [Google Scholar]
- 4.Carlson C. B., Lawler J., Mosher D. F. (2008) Cell Mol. Life Sci. 65, 672–686 [DOI] [PMC free article] [PubMed] [Google Scholar]
- 5.Carlson C. B., Bernstein D. A., Annis D. S., Misenheimer T. M., Hannah B. L., Mosher D. F., Keck J. L. (2005) Nat. Struct. Mol. Biol. 12, 910–914 [DOI] [PMC free article] [PubMed] [Google Scholar]
- 6.Tan K., Duquette M., Joachimiak A., Lawler J. (2009) FASEB J. 23, 2990–2501 [DOI] [PMC free article] [PubMed] [Google Scholar]
- 7.Misenheimer T. M., Mosher D. F. (2005) J. Biol. Chem. 280, 41229–41235 [DOI] [PMC free article] [PubMed] [Google Scholar]
- 8.Coligan J. E., Slayter H. S. (1984) J. Biol. Chem. 259, 3944–3948 [PubMed] [Google Scholar]
- 9.Lawler J., Derick L. H., Connolly J. E., Chen J. H., Chao F. C. (1985) J. Biol. Chem. 260, 3762–3772 [PubMed] [Google Scholar]
- 10.Galvin N. J., Dixit V. M., O'Rourke K. M., Santoro S. A., Grant G. A., Frazier W. A. (1985) J. Cell Biol. 101, 1434–1441 [DOI] [PMC free article] [PubMed] [Google Scholar]
- 11.Annis D. S., Gunderson K. A., Mosher D. F. (2007) J. Biol. Chem. 282, 27067–27075 [DOI] [PubMed] [Google Scholar]
- 12.Calzada M. J., Kuznetsova S. A., Sipes J. M., Rodrigues R. G., Cashel J. A., Annis D. S., Mosher D. F., Roberts D. D. (2008) Matrix Biol. 27, 339–351 [DOI] [PMC free article] [PubMed] [Google Scholar]
- 13.Carlson C. B., Liu Y., Keck J. L., Mosher D. F. (2008) J. Biol. Chem. 283, 20069–20076 [DOI] [PMC free article] [PubMed] [Google Scholar]
- 14.Narizhneva N. V., Byers-Ward V. J., Quinn M. J., Zidar F. J., Plow E. F., Topol E. J., Byzova T. V. (2004) J. Biol. Chem. 279, 21651–21657 [DOI] [PMC free article] [PubMed] [Google Scholar]
- 15.Liu Y., Annis D. S., Mosher D. F. (2009) J. Biol. Chem. 284, 22206–22212 [DOI] [PMC free article] [PubMed] [Google Scholar]
- 16.Misenheimer T. M., Huwiler K. G., Annis D. S., Mosher D. F. (2000) J. Biol. Chem. 275, 40938–40945 [DOI] [PubMed] [Google Scholar]
- 17.Huwiler K. G., Vestling M. M., Annis D. S., Mosher D. F. (2002) Biochemistry 41, 14329–14339 [DOI] [PubMed] [Google Scholar]
- 18.Mosher D. F., Huwiler K. G., Misenheimer T. M., Annis D. S. (2002) Methods Cell Biol. 69, 69–81 [DOI] [PubMed] [Google Scholar]
- 19.Annis D. S., Murphy-Ullrich J. E., Mosher D. F. (2006) J. Thromb. Haemost. 4, 459–468 [DOI] [PMC free article] [PubMed] [Google Scholar]
- 20.Stoscheck C. M. (1990) Methods Enzymol. 182, 50–68 [DOI] [PubMed] [Google Scholar]
- 21.Mach H., Middaugh C. R., Lewis R. V. (1992) Anal. Biochem. 200, 74–80 [DOI] [PubMed] [Google Scholar]
- 22.Marriott G., Zechel K., Jovin T. M. (1988) Biochemistry 27, 6214–6220 [DOI] [PubMed] [Google Scholar]
- 23.Tan K., Duquette M., Liu J. H., Dong Y., Zhang R., Joachimiak A., Lawler J., Wang J. H. (2002) J. Cell Biol. 159, 373–382 [DOI] [PMC free article] [PubMed] [Google Scholar]
- 24.Roszmusz E., Patthy A., Trexler M., Patthy L. (2002) Biochem. Biophys. Res. Commun. 296, 156–160 [DOI] [PubMed] [Google Scholar]
- 25.Smith C. A., Pangburn M. K., Vogel C. W., Müller-Eberhard H. J. (1984) J. Biol. Chem. 259, 4582–4588 [PubMed] [Google Scholar]
- 26.Beychok S. (1966) Science 154, 1288–1299 [DOI] [PubMed] [Google Scholar]
- 27.Zhang J. L., Qiu L. Y., Kotzsch A., Weidauer S., Patterson L., Hammerschmidt M., Sebald W., Mueller T. D. (2008) Dev. Cell 14, 739–750 [DOI] [PubMed] [Google Scholar]
- 28.O'Leary J. M., Hamilton J. M., Deane C. M., Valeyev N. V., Sandell L. J., Downing A. K. (2004) J. Biol. Chem. 279, 53857–53866 [DOI] [PubMed] [Google Scholar]
- 29.Hambleton S., Valeyev N. V., Muranyi A., Knott V., Werner J. M., McMichael A. J., Handford P. A., Downing A. K. (2004) Structure 12, 2173–2183 [DOI] [PubMed] [Google Scholar]
- 30.Sun Z., Reid K. B., Perkins S. J. (2004) J. Mol. Biol. 343, 1327–1343 [DOI] [PubMed] [Google Scholar]
- 31.Hofsteenge J., Huwiler K. G., Macek B., Hess D., Lawler J., Mosher D. F., Peter-Katalinic J. (2001) J. Biol. Chem. 276, 6485–6498 [DOI] [PubMed] [Google Scholar]
- 32.Nishimura H., Yamashita S., Zeng Z., Walz D. A., Iwanaga S. (1992) J. Biochem. 111, 460–464 [DOI] [PubMed] [Google Scholar]
- 33.Ricketts L. M., Dlugosz M., Luther K. B., Haltiwanger R. S., Majerus E. M. (2007) J. Biol. Chem. 282, 17014–17023 [DOI] [PubMed] [Google Scholar]
- 34.Wang L. W., Dlugosz M., Somerville R. P., Raed M., Haltiwanger R. S., Apte S. S. (2007) J. Biol. Chem. 282, 17024–17031 [DOI] [PubMed] [Google Scholar]
- 35.Acar M., Jafar-Nejad H., Takeuchi H., Rajan A., Ibrani D., Rana N. A., Pan H., Haltiwanger R. S., Bellen H. J. (2008) Cell 132, 247–258 [DOI] [PMC free article] [PubMed] [Google Scholar]
- 36.Helenius A., Aebi M. (2004) Annu. Rev. Biochem. 73, 1019–1049 [DOI] [PubMed] [Google Scholar]
- 37.Lawler J., Ferro P., Duquette M. (1992) Biochemistry 31, 1173–1180 [DOI] [PubMed] [Google Scholar]
- 38.Lee N. V., Sato M., Annis D. S., Loo J. A., Wu L., Mosher D. F., Iruela-Arispe M. L. (2006) EMBO J. 25, 5270–5283 [DOI] [PMC free article] [PubMed] [Google Scholar]
- 39.Tan K., Duquette M., Liu J. H., Zhang R., Joachimiak A., Wang J. H., Lawler J. (2006) Structure 14, 33–42 [DOI] [PMC free article] [PubMed] [Google Scholar]
- 40.Tan K., Duquette M., Liu J. H., Shanmugasundaram K., Joachimiak A., Gallagher J. T., Rigby A. C., Wang J. H., Lawler J. (2008) J. Biol. Chem. 283, 3932–3941 [DOI] [PMC free article] [PubMed] [Google Scholar]
- 41.Jiménez B., Volpert O. V., Crawford S. E., Febbraio M., Silverstein R. L., Bouck N. (2000) Nat. Med. 6, 41–48 [DOI] [PubMed] [Google Scholar]
- 42.Young G. D., Murphy-Ullrich J. E. (2004) J. Biol. Chem. 279, 47633–47642 [DOI] [PubMed] [Google Scholar]
- 43.Calzada M. J., Annis D. S., Zeng B., Marcinkiewicz C., Banas B., Lawler J., Mosher D. F., Roberts D. D. (2004) J. Biol. Chem. 279, 41734–41743 [DOI] [PubMed] [Google Scholar]


