Abstract
All vertebrate cells regulate their cell volume by activating chloride channels of unknown molecular identity, thereby activating regulatory volume decrease. We show that the Ca2+-activated Cl− channel TMEM16A together with other TMEM16 proteins are activated by cell swelling through an autocrine mechanism that involves ATP release and binding to purinergic P2Y2 receptors. TMEM16A channels are activated by ATP through an increase in intracellular Ca2+ and a Ca2+-independent mechanism engaging extracellular-regulated protein kinases (ERK1/2). The ability of epithelial cells to activate a Cl− conductance upon cell swelling, and to decrease their cell volume (regulatory volume decrease) was dependent on TMEM16 proteins. Activation of ICl,swell was reduced in the colonic epithelium and in salivary acinar cells from mice lacking expression of TMEM16A. Thus TMEM16 proteins appear to be a crucial component of epithelial volume-regulated Cl− channels and may also have a function during proliferation and apoptotic cell death.
Regulation of cell volume is fundamental to all cells, particularly during cell growth and division. External hypotonicity leads to cell swelling and subsequent activation of volume-regulated chloride and potassium channels, to release intracellular ions and to re-shrink the cells, a process termed regulatory volume decrease (RVD)3 (1). Volume-regulated chloride currents (ICl,swell) have dual functions during cell proliferation as well as apoptotic volume decrease (AVD), preceding apoptotic cell death (2). Although ICl,swell is activated in swollen cells to induce RVD, AVD takes place under normotonic conditions to shrink cells (3, 4). Early work suggested intracellular Ca2+ as an important mediator for activation of ICl,swell and volume-regulated K+ channels (5), whereas subsequent studies only found a permissive role of Ca2+ for activation of ICl,swell (6), reviewed in Ref. 1. In addition, a plethora of factors and signaling pathways have been implicated in activation of ICl,swell, making cell volume regulation an extremely complex process (reviewed in Refs. 1, 3, and 7). These factors include intracellular ATP, the cytoskeleton, phospholipase A2-dependent pathways, and protein kinases such as extracellular-regulated kinase ERK1/2 (reviewed in Refs. 1 and 7). Previous approaches in identifying swelling-activated Cl− channels have been unsuccessful or have produced controversial data. Thus none of the previous candidates such as pICln, the multidrug resistance protein, or ClC-3 are generally accepted to operate as volume-regulated Cl− channels (reviewed in Refs. 8 and 9). Notably, the cystic fibrosis transmembrane conductance regulator (CFTR) had been shown in earlier studies to influence ICl,swell and volume regulation (10–12). The variable properties of ICl,swell suggest that several gene products may affect ICl,swell in different cell types.
The TMEM16 transmembrane protein family consists of 10 different proteins with numerous splice variants that contain 8–9 transmembrane domains and have predicted intracellular N- and C-terminal tails (13, 16–18). TMEM16A (also called ANO1) is required for normal development of the murine trachea (14) and is associated with different types of tumors, dysplasia, and nonsyndromic hearing impairment (13, 15). TMEM16A has been identified as a subunit of Ca2+-activated Cl− channels that are expressed in epithelial and non-epithelial tissues (16–18). Interestingly, members of the TMEM16 family have been suggested to play a role in osmotolerance in Saccharomyces cerevisiae (19). Here we show that TMEM16 proteins also contribute to ICl,swell and regulatory volume decrease.
EXPERIMENTAL PROCEDURES
Cell Culture, cDNAs, and Transfection
Cell lines from human embryonic kidney (HEK293), human colon carcinoma (HT29), and human cystic fibrosis pancreatic epithelial (CFPAC) cells were cultured as described (22). cDNA for mouse TMEM16B was purchased from ImaGenes GmbH (Berlin, Germany; clone name IRAVp968H1167D). cDNA for human TMEM16A were cloned into pcDNA3.1 V5-His (Invitrogen) from the total RNA of 16HBE-14o cells (bronchial epithelium; kindly provided by Prof. D. Gruenert, CPMRI, San Francisco, CA) by RT-PCR using the primers 5′-AAAAGCGGCCGCGGCCACGATGAGGGTC-3′ and 5′-AAATCTAGAAACAGGACGCCCCCGTGGTA-3′. All cDNAs were verified by sequencing. 16HBE-14o cells express a TMEM16A isoform containing exons a, b, and c according to Caputo et al. (18). Plasmids were transfected into HEK293 cells using standard methods (Lipofectamine, Invitrogen). All experiments were performed 48 h after the transfection.
Western Blotting
Protein was isolated from transfected HEK293 cells in a lysis buffer containing 50 mm Tris-HCl, 150 mm NaCl, 50 mm Tris, 100 mm dithiothreitol, 1% Nonidet P-40, 0.5% deoxycholate sodium, and 1% protease inhibitor mixture (Sigma) and was separated by 7% SDS-PAGE. For Western blot analysis, proteins separated by SDS-PAGE were transferred to a polyvinylidene difluoride membrane (GE Healthcare Europe GmbH, Munich, Germany) using a semi-dry transfer unit (Bio-Rad). Membranes were incubated with primary antibodies (dilution from 1:2000 to 1:5000) overnight at 4 °C. Proteins were visualized using a suitable (horseradish peroxidase) conjugated secondary antibody (dilution 1:30000) and ECL detection kit (GE Healthcare). Protein bands were detected on a FujiFilm LAS-3000.
Patch Clamp
Cells were grown on coverslips that were mounted in a perfused bath on the stage of an inverted microscope (IM35, Zeiss) and kept at 37 °C. Cells and acini isolated from mouse glands were allowed to settle onto poly-l-lysine-coated coverslips. The bath was perfused continuously with Ringer solution at about 10 ml/min. For activation of volume-dependent Cl− currents, isotonic Ringer bath solution (mm: NaCl 145, KH2PO4 0.4, K2HPO4 1.6, d-glucose 6, MgCl2 1, calcium gluconate 1.3, pH 7.4) was changed to isotonic control solution in which 50 mmol/liter of NaCl was replaced by 100 mmol/liter of mannitol. Subsequently, mannitol (50, 75, and 100 mmol/liters) was removed to produce extracellular hypotonicity of −50, −75, and −100 mosmol/liter, i.e. 17, 25, and 33% hypotonicity. Patch clamp experiments were performed in the fast whole cell configuration. Patch pipettes had an input resistance of 2–4 MΩ, when filled with an intracellular like “physiological” solution containing (mm) KCl 30, potassium gluconate 95, NaH2PO4 1.2, Na2HPO4 4.8, EGTA 1, calcium gluconate 0.758, MgCl2 1.034, d-glucose 5, ATP 3, pH was 7.2. The Ca2+ activity was 0.1 μm. We choose this solution because it enabled normal swelling/shrinkage behavior and allowed for direct comparison of results from patch clamping and volume measurements. The access conductance was measured continuously and was 30–140 nS. Currents (voltage clamp) and voltages (current clamp) were recorded using a patch clamp amplifier (EPC 7, List Medical Electronics, Darmstadt, Germany), the LIH1600 interface and PULSE software (HEKA, Lambrecht, Germany) as well as Chart software (AD Instruments, Spechbach, Germany). Data were stored continuously on a computer hard disc and analyzed using PULSE software. In regular intervals, membrane voltage (Vc) was clamped in steps of 10 mV from −50 to +50 mV relative to resting potential. Membrane conductance Gm was calculated from the measured current (I) and Vc values according to Ohm law.
Animals and Ussing Chamber Experiments
Generation of a null allele of Tmem16a and TMEM16A knock-out animals has been described previously (14). Pups (1–4 days) were sacrificed with Isofluran (Baxter, Germany). The pancreas and submandibular glands were removed and epithelial cells were dispersed in phosphate-buffered saline composed of Collagenase VIII (Sigma). Tracheas were dissected, opened longitudinally on the opposite side of the cartilage-free zone, and transferred immediately into an ice-cold buffer solution. Stripped colon was put into ice-cold Ringer bath solution containing amiloride (10 μm) and indomethacin (10 μm). For activation of volume-dependent Cl− currents, isotonic Ringer bath solution was changed to isotonic control solution in which 50 mmol/liter of NaCl was replaced by 100 mmol/liter of mannitol. Subsequently, mannitol was removed to produce extracellular hypotonicity of −100 mosmol/liter, i.e. 33% hypotonicity. Tissues were mounted into a microperfused Ussing chamber with a circular aperture of 0.785 mm2. Luminal and basolateral sides of the epithelium were perfused continuously at a rate of 5 ml/min. Bath solutions were heated to 37 °C, using a water jacket. Experiments were carried out under open circuit conditions. Data were collected continuously using PowerLab (AD Instruments, Australia). Values for transepithelial voltages (Vte) were referred to the serosal side of the epithelium. Transepithelial resistance (Rte) was determined by applying short (1 s) current pulses (ΔI = 0.5 μA). Rte and equivalent short circuit currents (ISC) were calculated according to Ohm law (Rte = ΔVte/ΔI, ISC = Vte/Rte).
RT-PCR, cDNA, siRNA, Real Time PCR
TMEM16A was cloned from airway epithelial cells (16HBE14o-), corresponding to isoform abc (18). TMEM16A-K610A, TMEM16A-S967A, and TMEM16A-S970A were produced by PCR-based site-directed mutagenesis. Expression of mRNAs encoding all 10 human TMEM16 proteins were examined in HEK293, HT29, and CFPAC cells by standard RT-PCR using real time and additional primers (name, accession number: sense, antisense): hTMEM16C, NM_031418.2, 5′-TCAGAGCAGAAGGCTTGATG-3′, 5′-AAACATGATATCGGGGCTTG-3′; hTMEM16D, NM_178826.2, 5′- TGACTGGGATTTGATAGACTGG-3′, 5′-GCTTCAAACTGGGGTCGTAT-3′; hTMEM16GL, NM_001001891.3, 5′-GCTCTGTGGTGATCGTGGT-3′, 5′-GGCACGGTACAGGATGATAGA-3′; hTMEM16GS, NM_001001666.3, 5′-GGCTCTTACGGGAGCACAG-3′, 5′-CAAACGAGGACGAAGTCGAT-3′; and hTMEM16K, NM_018075.3, 5′-CAGGGTCTTCAAACGTCCAT-3′, 5′-TCATCGTTTCAAAAGCCAACT-3′. Expression of TMEM16A, TMEM16F, TMEM16H, and TMEM16J were suppressed by two independent sets of siRNA. Duplexes of 25 nucleotides of siRNA were designed and synthesized by Invitrogen and Santa Cruz. siRNA was transfected using Lipofectamine (1 μg/μl) and cells were examined 48 or 72 h after transfection. Suppression of expression of TMEM16A, TMEM16F, TMEM16H, and TMEM16J was verified by real time PCR. Total RNA was isolated from HEK293 or HT29 cells using NucleoSpin RNA II columns (Macherey-Nagel, Düren, Germany). Total RNA (2 μg) was reverse-transcribed using random primer and RT (Moloney murine leukemia virus reverse transcriptase, Promega). The oligonucleotide primers were designed for real time PCR as following (name, accession number, sense and antisense primer): hTMEM16A, NM_018043.4, 5′-CCTCACGGGCTTTGAAGAG-3′, 5′-CTCCAAGACTCTGGCTTCGT-3′; hTMEM16B, NM_020373.1, 5′-TGGATGTGCAACAATTGAAGA-3′, 5′-GCATTCTGCTGGTCACACAT-3′; hTMEM16E, NM_213599.1, 5′-TGGAAACATTAAAGAAGCCATTTA-3′, 5′-GAGTTTGTCCGAGCTTTTCG-5′; hTMEM16F, NM_001025356.1, 5′-AGGAATGTTTTGCTACAAATGGA-3′, 5′-GTCCAAGGTTTTCCAACACG-3′; hTMEM16H, NM_020959.1, 5′-GGAGGACCAGCCAATCATC-3′, 5′-TGCTCGTGGACAGGGAAC-3′; hTMEM16J, NM_001012302.2, 5′-CAAACCCCAGCTGGAACTC-3′, 5′-GGATCCGGAGGCTCTCTT-3′; and β-actin, NM_001101, 5′-CAACGGCTCCGGCATGTG-3′, 5′-CTTGCTCTGGGCCTCGTC-3′. Real time PCR was performed in a Light Cycler (Roche), using the Quanti Tect SYBR Green PCR kit (Qiagen, Hilden, Germany). Each reaction contained 2 μl of Master Mix (including Taq polymerase, desoxyribonucleotide triphosphates, and SYBR Green buffer), 1 pm of each primer sense and antisense, 2.5 mm MgCl2, and 2 μl of cDNA. After activation of the Taq polymerase for 10 min at 94 °C cDNA was amplified by 15 s at 94 °C, 10 s at 55 °C, and 20 s at 72 °C, for 50 cycles. The amplification was followed by a melting curve analysis to control the PCR products. Analysis of the data were performed using Light Cycler software 3.5.3. Standard curves for transmembrane proteins mRNA and β-actin mRNA were produced by using cDNA of transfected HEK cells at different dilutions. The ratio of the amount of transmembrane protein to β-actin mRNA was calculated for each sample and analysis was performed in triplicate.
Analysis of Cell Volume and FACS
For cell volume measurements, HEK293 cells were loaded with 2 μg of calcein-AM (Molecular Probes) and 0.025% pluronic in a standard bath solution (Ringer) for 30–60 min at 37 °C. Analysis was done at an excitation wavelength of 500 nm and and emission wavelength of 520–550 nm. Cell swelling and RVD were observed for 10–15 min after applying hypotonic bath solution. To produce extracellular hypotonicity, isotonic Ringer bath solution was changed to isotonic control solution in which 50 mmol/liter of NaCl was replaced by 100 mmol/liter of mannitol. Subsequently, mannitol was removed to reduce extracellular hypotonicity by 100 mosmol/liter (33% hypotonicity). Experiments were performed 48 h after transfection of HEK293 cells with cDNAs encoding P2Y2 and hTMEM16A and 72 h after transfection with siRNA targeting TMEM16 family members or scrambled. All the compounds were dissolved in bath solutions and their effect on cell swelling was analyzed after 5–10 min incubation. Cell volume of HEK293 cells was also assessed by flow cytometry (Prof. Mathias Mack, University Hospital Regensburg) before (t = 0) and 30 s (t = 0.5 min) and 5 min (t = 5 min) after swelling, which was induced by reduction of the solution osmolarity to ⅓. In flow cytometry experiments, HEK293 cells were resuspended in phosphate-buffered saline and the average volume of 30,000 cells per condition determined.
Materials and Statistical Analysis
All compounds (ionomycin, carbachol, ATP, tamoxifen, DIDS, suramin, 1,2- bis(2-aminophenoxyl)ethane-N,N,N′,N′-tetraacetic acid-AM, U0126, staurosporine, CFTRinh-172, apyrase, MTSET, and cyclopiazonic acid) were of highest available grade of purity and were from Sigma or Merck. The anti-hTMEM16A was a generous gift from Prof. van de Rijn (Dept. of Pathology, Stanford University). All cell culture reagents were from Invitrogen. For activation of volume-dependent Cl− currents, isotonic Ringer bath solution was changed to isotonic control solution in which 50 mmol/liter of NaCl was replaced by 100 mmol/liter of mannitol. Subsequently, mannitol (50, 75, and 100 mmol/liter) was removed to produce extracellular hypotonicity of −50, −75, and −100 mosmol/liter, i.e. 17, 25, and 33% hypotonicity. RVD due to swelling activation of ion channels is an initial event that was assessed by analysis of the initial volume decrease. RVD indicates the initial rate of regulatory volume decrease or initial RVD rate, RVDi(%) = (Vmax − Vmin)/(Vmax − Vo) × 100% (20). Initial rate of RVD in hepatocytes is controlled by extracellular ATP (21). Student's t test (for paired or unpaired samples as appropriate) and analysis of variance was used for statistical analysis. p < 0.05 was accepted as significant.
RESULTS AND DISCUSSION
Suppression of ICl,swell by siRNA-TMEM16A in Three Different Cell Lines
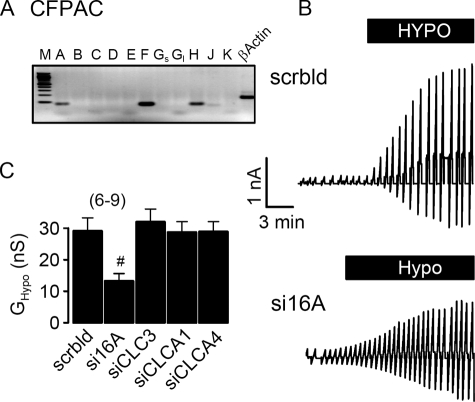
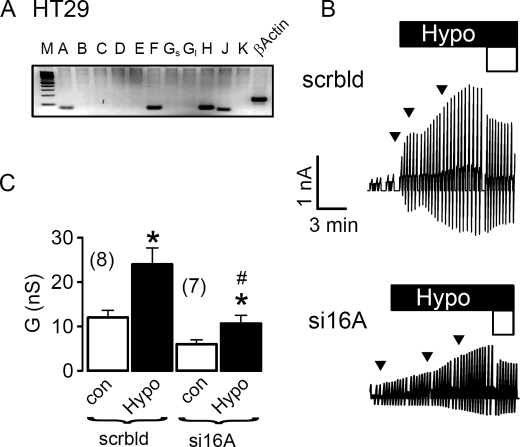
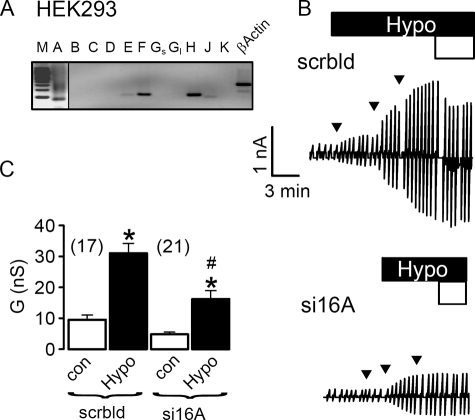
Because TMEM16A has been shown to be a major component of the Ca2+-activated Cl− channel, we examined the contribution of TMEM16A to swelling-activated whole cell currents (ICl,swell) in a human pancreatic cell line (CFPAC) that lacks expression of the CFTR Cl− channel (22). CFPAC cells express TMEM16A, -F, and -H and show pronounced activation of whole cell Cl− currents when exposed to hypotonic bath solution (22) (Fig. 1, A and B). Activation of whole cell currents was suppressed by siRNA for TMEM16A, but not by siRNA knockdown of CLC3, ClCA1, and CLCA4, which are also expressed in CFPAC cells (Fig. 1C). This result was confirmed in the human colonic epithelial cell line HT29, which also expresses TMEM16A, -F, -H, and -J (Fig. 2A). ICl,swell was activated upon exposure to increasing extracellular hypotonicity (17, 25, and 33%, Fig. 2B, arrows). Partial removal of Cl− from the extracellular bath solution (Fig. 2, white bars, 30 mm Cl−) reduced ICl,swell and depolarized Vm by 9.1 ± 0.8 mV (n = 7), indicating activation of Cl− conductance by hypotonic bath solution. Importantly, activation of ICl,swell was reduced by siRNA-TMEM16A (Fig. 2, B and C). Finally, the role of TMEM16A for ICl,swell was examined in HEK293 cells, which also express endogenous TMEM16 proteins (Fig. 3A). Equal to HT29 and CFPAC cells, ICl,swell was activated upon exposure to hypotonic bath solution (Fig. 3B). Partial removal of Cl− from the extracellular bath solution reduced ICl,swell and depolarized Vm by 8.2 ± 0.9 mV (n = 7). Most important, ICl,swell was inhibited by siRNA-TMEM16A (Fig. 3, B and C).
FIGURE 1.
Activation of ICl,swell in CFPAC cells requires TMEM16A channels. A, RT-PCR analysis indicates expression of TMEM16A, TMEM16F, and TMEM16H in CFPAC cells. M, marker; A–K, TMEM16A–K. Gs, Gl, short and long splice variants. B, original recordings of whole cell currents in CFPAC cells activated by hypotonic bath solution (33%). Cells were voltage clamped in intervals from −50 to +50 mV. Treatment with siRNA for TMEM16A (si16A) reduced the swelling-activated whole cell current, when compared with cells treated with scrambled (scrbld) RNA. C, summary of swelling-activated whole cell conductance (GHypo) measured in CFPAC cells treated with scrambled RNA or after RNA interference knockdown of TMEM16A, CLC-3, and CLCA proteins. Mean ± S.E., (n) = number of cells measured. #, significant inhibition of ICl,swell by RNA interference knockdown of TMEM16A when compared with treatment with scrambled RNA (unpaired t test).
FIGURE 2.
Activation of ICl,swell in HT29 cells requires TMEM16A channels. A, RT-PCR analysis indicates expression of TMEM16A, TMEM16F, TMEM16H, and TMEM16J in HT29 cells. M, marker; A–K, TMEM16A-K; Gs, Gl, short and long splice variants. B, original recordings of whole cell currents in HT29 cells, activated by a gradual increase of extracellular hypotonicity (17, 25, and 33%, arrows). Cells were voltage clamped in intervals from −50 to +50 mV. Partial replacement of extracellular Cl− by gluconate (open bar, 30 mm Cl−) inhibited whole cell outward currents. Treatment with siRNA for TMEM16A (si16A) reduced the swelling-activated whole cell current, when compared with cells treated with scrambled (scrbld) RNA. C, summary of whole cell conductance measured in HT29 cells under control conditions (open bars; normotonic bath solution) and after exposure to 33% hypotonicity (black bars). Mean ± S.E., (n) = number of cells measured. *, significant increase in whole cell conductance (paired t test). #, significant inhibition of ICl,swell by RNA interference knockdown of TMEM16A, when compared with treatment with scrambled RNA (unpaired t test).
FIGURE 3.
Activation of ICl,swell in HEK293 cells requires TMEM16A channels. A, RT-PCR analysis indicates expression of TMEM16A, TMEM16F, and TMEM16H in HEK293 cells. PCR product of TMEM16A becomes only visible when cDNA input was doubled. M, marker; A–K, TMEM16A–K; Gs, Gl, short and long splice variants. B, original recordings of whole cell currents in HEK293 cells, activated by a gradual increase of extracellular hypotonicity (17, 25, and 33%, arrows). Cells were voltage clamped in intervals from −50 to +50 mV. Partial replacement of extracellular Cl− by gluconate (open bar, 30 mm Cl−) inhibited whole cell outward currents. Treatment with siRNA for TMEM16A (si16A) reduced the swelling-activated whole cell current, when compared with cells treated with scrambled (scrbld) RNA. C, summary of whole cell conductance measured in HEK293 cells under control conditions (open bars, normotonic bath solution) and after exposure to 33% hypotonicity (black bars). Mean ± S.E., (n) = number of cells measured. *, significant increase in whole cell conductance (paired t test). #, significant inhibition of ICl,swell by RNA interference knockdown of TMEM16A, when compared with treatment with scrambled RNA (unpaired t test).
Members of the TMEM16 Family Participate in ICl,swell
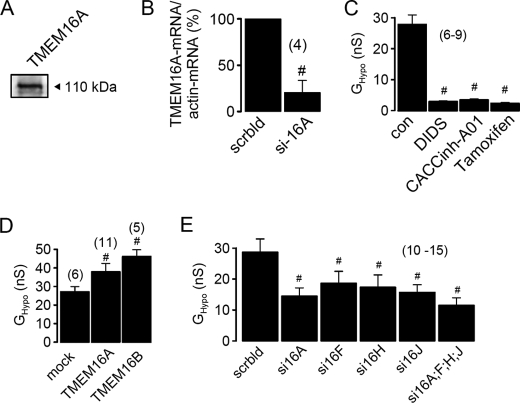
HEK293 cells that express low but detectable amounts of TMEM16A (Figs. 3A and 4A) were incubated with two different batches of siRNA and knockdown of TMEM16A was verified by real time RT-PCR (Fig. 4B). Activation of whole cell conductance by hypotonic bath solution (GHypo) was potently inhibited by the inhibitor of TMEM16A currents, DIDS (100 μm) (16), the specific inhibitor of Ca2+-activated Cl− currents CACCinh-A01 (23) and tamoxifen (100 μm) (Fig. 4C).
FIGURE 4.
Activation of ICl,swell in HEK293 cells depends on the presence of TMEM16 channels. A, Western blot analysis indicates expression of endogenous TMEM16A in HEK293 cells. B, real time PCR analysis of expression of TMEM16A in HEK293 cells treated with scrambled siRNA (scrbld) and TMEM16A-siRNA (si16A). C, inhibition of swelling-activated whole cell conductance (GHypo) in HEK293 cells by DIDS (100 μm), CaCCinh-A01 (10 μm), and tamoxifen (100 μm). D, summary of GHypo in HEK293 cells expressing empty plasmid (mock), TMEM16A, or TMEM16B. E, summary of swelling-induced whole cell conductance in cells treated with siRNA for various TMEM16 proteins. Mean ± S.E., (n) = number of cells measured. #, significant difference when compared with control cells (mock, scrbld, or absence of inhibitors) (unpaired t test).
We further confirmed the role of TMEM16 proteins for swelling-activated Cl− currents by overexpression of exogenous TMEM16A or TMEM16B, another Ca2+-activated Cl− channel and member of the TMEM16 family (24). Overexpression of both TMEM16 proteins augmented swelling-activated Cl− currents in HEK293 cells (Fig. 4D). This suggests that several TMEM16 proteins may contribute to swelling-activated Cl− currents. We therefore knocked down endogenous TMEM16F, -H, and -J individually or simultaneously, each by two different batches of siRNA, which in each case significantly reduced ICl,swell (Fig. 4E). Because knockdown of each TMEM16 protein caused a non-additive reduction in ICl,swell, this may suggest that TMEM16 proteins hetero-oligomerize to form swelling-activated Cl− channels. In preliminary studies we found that endogenous volume-activated Cl− channels in HEK293 cells were potently suppressed by expression of K610K-TMEM16A, a TMEM16A mutant that produced very little Cl− conductance.4
Role of Purinergic Signaling for Activation of TMEM16A by Cell Swelling
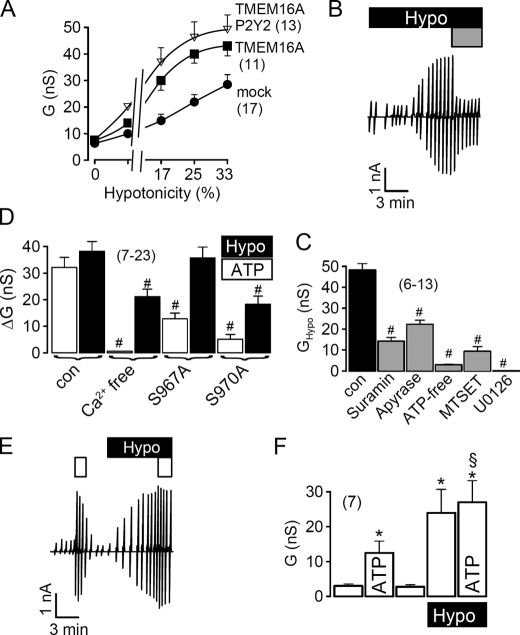
Coexpression of G-protein-coupled receptors has been shown to increase Ca2+-activated Cl− currents produced by TMEM16A (16). Although P2Y2 receptors are expressed endogenously in HEK293 cells, additional expression of exogenous purinergic P2Y2 receptors further increased swelling-activated whole cell currents in HEK293 cells (Fig. 5A).
FIGURE 5.
Role of purinergic signaling for activation of TMEM16A in HEK293 cells by cell swelling. A, activation of whole cell conductance by increased extracellular hypotonicity in cells expressing empty plasmid (mock), TMEM16A or TMEM16A together with P2Y2 receptors. B, swelling activation of whole cell currents in a HEK293 cell and inhibition of the current by suramin (100 μm; gray bar). C, inhibition of the swelling-activated whole cell conductance by suramin (100 μm), apyrase (3 units/ml), and ATP-free pipette solution, the cysteine reagent MTSET (2.5 mm), and the inhibitor of extracellular-regulated kinase (ERK1/2) U0126 (25 μm). D, summary of swelling-activated (Hypo) and ATP-induced whole cell conductance in TMEM16A expressing HEK293 cells, under control conditions and after removal of Ca2+ from both pipette and bath solution. Both ATP and swelling-induced whole cell conductance were reduced under Ca2+-free conditions and when two ERK1/2 consensus sides in TMEM16A were mutated. E, activation of whole cell currents by ATP (open bar, 10 μm), before and after swelling activation of whole cell currents (Hypo). F, summary of whole cell conductance in the absence and presence of ATP hypotonic bath solution. Mean ± S.E., (n) = number of cells measured. *, significant ATP effect (paired t test). #, significant difference when compared with control (unpaired t test). §, significant difference when compared with the absence of hypotonic bath solution (unpaired t test).
Intracellular ATP and swelling-induced ATP release from cells has been identified as an important factor for RVD (25). Moreover, it has been shown that ATP binds to purinergic P2Y2 receptors and activates TMEM16A (16). We found that blockage of P2Y2 receptors with 100 μm suramin largely reduced swelling-activated whole cell currents (Fig. 5, B and C), confirming the role of P2Y2 signaling for ICl,swell. Because ATP release is obviously a critical factor for activation of ICl,swell, we exposed the cells to hypotonic bath solution in the presence of the ATP-hydrolyzing enzyme apyrase, or removed ATP from the pipette filling solution, which both significantly reduced ICl,swell (Fig. 5C). Moreover, TMEM16A has been shown to be inhibited by the sulfhydryl reagent MTSET, which reacts with three cysteine residues in the putative pore forming loop of TMEM16A (16). MTSET also blocked swelling-activated whole cell currents in HEK293 cells. Remarkably, the ERK1/2 inhibitor U0126 completely inhibited ICl,swell thus clearly implying a role of this kinase for activation of TMEM16 channels (Fig. 5C). Notably, also ATP, i.e. Ca2+-activated whole cell currents, were reduced by U0126 (data not shown).
We further examined the contribution of Ca2+ and ERK1/2 for activation of ICl,swell and Ca2+-dependent activation of TMEM16A by ATP, using a Ca2+-free solution (in patch pipette and bath) and by mutating two potential C-terminal ERK1/2 consensus sides (Ser967 and Ser970) in TMEM16A. We found that eliminating Ca2+ abolished activation of TMEM16A by ATP and inhibited ICl,swell (Fig. 5D). Mutating Ser967 to alanine inhibited ATP-activated currents, whereas mutating Ser970 to alanine inhibited both ATP-activated Cl− currents (TMEM16A) and ICl,swell (Fig. 5D). Thus both swelling activation and ATP-dependent activation of TMEM16A use Ca2+ and ERK1/2 as intracellular messengers. Although ICl,swell requires ERK1/2 for activation, Ca2+ has only a permissive function (26, 27). ATP release by swollen cells may activate ERK1/2 at very low local extracellular ATP concentrations, and may thereby induce swelling-activated Cl− conductance, as reported earlier (27).
To further demonstrate that ATP and cell swelling target the same Cl− channel, we applied ATP before and after exposure to hypotonic bath solution (paired experiments). We observed that after activation of ICl,swell, ATP-induced (Ca2+ dependent) whole cell currents were largely reduced (Fig. 5, E and F). Similar non-additive effects of ATP and cell swelling on whole cell Cl− conductance were observed in HT29 cells (data not shown).
TMEM16 Proteins Are Essential for RVD in HEK293 Cells
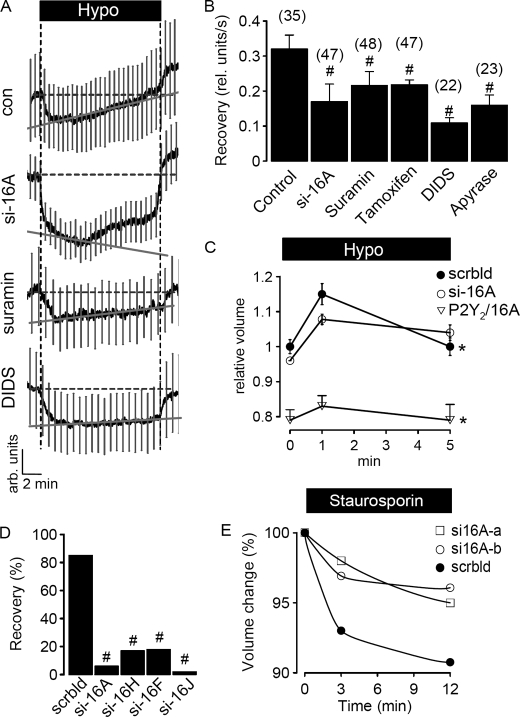
To further confirm the role of TMEM16 channels for ICl,swell and RVD we loaded HEK293 cells with the fluorescence dye calcein (28). Hypotonic bath solution induced cell swelling and decreased calcein fluorescence, which was followed by a 98% recovery after 20 min, indicating RVD (Fig. 6A). Recovery from swelling was reduced in cells treated with siRNA-TMEM16A (42% after 20 min). Similarly inhibition of P2Y2 receptors by suramin, or application of the Cl− channel blockers tamoxifen and DIDS, or apyrase, all significantly reduced RVD (Fig. 6, A and B).
FIGURE 6.
TMEM16 proteins are essential for RVD in HEK293 cells. A, swelling (Hypo)-induced changes in calcein fluorescence in control HEK293 cells and cells treated with siRNA for TMEM16A or suramin (100 μm) or DIDS (100 μm); mean curve ± S.E. (n = 10). B, summary of the rate of fluorescence recovery per second, indicating recovery of the cell volume from hypotonic swelling. Treatment with siRNA for TMEM16A or exposure to various inhibitors of ICl,swell inhibited recovery of the cell volume, i.e. RVD. C, hypotonic cell swelling and recovery from cell swelling of cells treated with (i) scrambled RNA, (ii) TMEM16A-RNAi, or (iii) coexpressing P2Y2 receptors/TMEM16A, as determined by FACS analysis of 30,000 cells per experiment. Experiments were performed in triplicate. D, summary of volume, i.e. fluorescence recovery after hypotonic cell swelling of HEK293 cells treated with siRNA for different TMEM16 proteins, as determined by FACS analysis of 30,000 cells per experiment. E, apoptotic cell shrinkage induced by staurosporin (2 μm) under normotonic conditions in cells treated with two different batches of siRNA for TMEM16A (si16A-a and si16A-b), or when treated with scrambled RNA (FACS analysis of 30,000 cells). Mean ± S.E., (n) = number of cells measured. *, significant recovery from cell swelling of cells treated with scrambled siRNA (paired t test). #, significant difference when compared with control (unpaired t test).
These results obtained in single cell measurements were confirmed by FACS analysis of a larger number of cells. HEK293 cells treated with scrambled siRNA increased their cell volume, which returned to control values within 5 min of exposure to hypotonic bath solution (Fig. 6C). In contrast, cells treated with siRNA for TMEM16A did not return to their initial volume, demonstrating reduced RVD. Notably, overexpression of P2Y2 receptors together with TMEM16A reduced the cell volume of HEK293 cells under control conditions. Overexpression of P2Y2 receptors probably sensitizes HEK293 cells toward extracellular ATP, thus P2Y2/TMEM16A expressing cells activate Cl− channels more rapidly and therefore tend to reduce their cell volume. Moreover, their large RVD capacity counteracts any tendency to swell and therefore the cells show only a small increase in cell volume when exposed to hypotonic bath solution (Fig. 6C). We determined the rate of recovery from cell swelling and found that not only TMEM16A but also the other TMEM16 proteins expressed in HEK293 cells contribute to RVD, as demonstrated by siRNA knockdown of the individual TMEM16 proteins (Fig. 6D).
It has been reported earlier that cell shrinkage due to opening of ion channels not only occurs during hypotonic swelling, but also in normotonic solution, when cells go into apoptotic cell death (2, 29). AVD is an initial step during apoptosis, which can be induced by compounds such as staurosporin (29). When we exposed HEK293 cells to staurosporin we observed a decrease in cell volume, indicating AVD (Fig. 6E). In contrast, knockdown of TMEM16A with two independent siRNAs significantly reduced AVD, suggesting that TMEM16A is important for both cell volume regulation (RVD) and AVD.
Impaired ICl,swell in Epithelial Tissues of Mice Lacking TMEM16
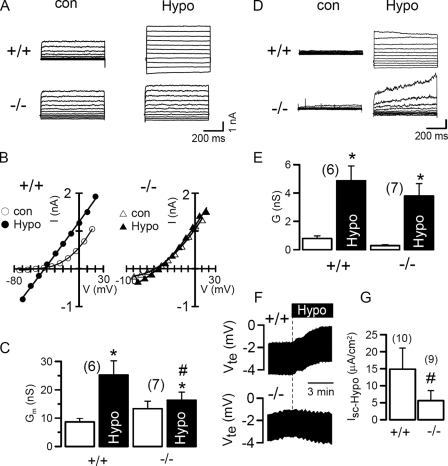
TMEM16A is expressed at high levels in the submandibular gland and to a lower degree in hepatocytes (14, 17) (Unigene data base). We examined activation of ICl,swell in freshly isolated acinar cells from submandibular glands and in hepatocytes of 1–4-day-old WT (+/+) mouse pups and compared the results with those obtained in cells from mice lacking expression of TMEM16A (−/−). Exposure to hypotonic solution of submandibular acinar cells from +/+ animals activated a whole cell current that was essentially absent in cells from −/− animals (Fig. 7, A and C). Thus the volume-activated whole cell conductance was almost abolished in submandibular gland cells from −/− mice (Fig. 7C). In hepatocytes ICl,swell was of similar magnitude in both cells from +/+ and −/− animals, however, currents activated in −/− cells showed a different time dependence, suggesting some contribution of TMEM16A to ICl,swell also in hepatocytes (30).
FIGURE 7.
Impaired ICl,swell in epithelial tissues of mice lacking TMEM16−/−. A and B, whole cell currents and corresponding I/V curves obtained in submandibular acinar cells of TMEM16A knock-out mice (−/−) and wild type littermates (+/+) before and after exposure to hypotonic (33%) bath solution. C, summary of the whole cell conductance induced by hypotonic bath solution in WT and knock-out animals. D and E, whole cell currents and corresponding whole cell conductance obtained in hepatocytes of TMEM16A knock-out mice (−/−) and wild type littermates (+/+), before and after exposure to hypotonic bath solution. F, recording of the change in transepithelial voltage (Vte) induced by hypotonic bath solution (25%) in WT (+/+) and knock-out (−/−) animals. G, summary of ion transport, i.e. the short circuit currents induced by hypotonic bath solution in WT (+/+) animals and knock-out (−/−) littermates. Mean ± S.E., (n) = number of cells measured. *, significant increase in whole cell conductance (paired t test). #, significant difference when compared with WT (+/+) (unpaired t test).
Volume-activated Cl− currents have also been identified previously in the basolateral membrane of colonic epithelial cells (31). Opening of basolateral Cl− channels due to exposure to hypotonic bath solution reduced the lumen negative transepithelial voltage (Vte) in the distal colonic epithelium (Fig. 7F). In contrast the distal colon from TMEM16A−/− animals showed little changes when exposed to hypotonic solution, and thus swelling-induced short circuit currents were significantly reduced in the TMEM16A−/− colon (Fig. 7, F and G). Taken together the data clearly indicate that TMEM16A channels contribute to volume-regulated Cl− currents in native mouse epithelial cells. The present results suggest that volume-regulated Cl− channels may be composed of different members of the TMEM16 family, probably in a tissue-specific manner, thus giving rise to variable properties of ICl,swell in different cell types and tissues (9). As these channels also control apoptotic cell shrinkage, they may affect cell survival, which could explain the role of these proteins in tumor development (13).
Acknowledgments
We acknowledge supply of the CaCC inhibitor CaCCinh-A01 by Prof. Alan Verkman (University of California, San Francisco, CA), the technical support by Prof. Mathias Mack (University Hospital Regensburg) regarding FACS analysis, and critical discussions with Prof. Dr. R. Warth (Dept. of Physiology, University Regensburg). The technical support by Patthara Kongsuphol, Krongkarn Chootip, and Caio Toledo is gratefully acknowledged.
This work was supported by Deutsche Forschungsgemeinschaft Grants SFB699 and KU 756/8-2 and TargetScreen2 Grant EU-FP6-2005-LH-037365.
J. Almaça, Y. Tian, F. Aldehni, J. Ousingsawat, P. Kongsuphol, J. R. Rock, B. D. Harfe, R. Schreiber, and K. Kunzelmann, unpublished data.
- RVD
- regulatory volume decrease
- AVD
- apoptotic volume decrease
- DIDS
- 4,4′-diisothiocyanostilbene-2,2′-disulfonic acid
- MTSET
- [2-(trimethylammonium)ethyl]methanethiosulfonate
- CFTR
- cystic fibrosis transmembrane conductance regulator
- ERK
- extracellular signal-regulated kinase
- HEK
- human embryonic kidney
- CFPAC
- cystic fibrosis pancreatic epithelial cell
- RT
- reverse transcriptase
- siRNA
- small interfering RNA
- FACS
- fluorescence-activated cell sorter
- WT
- wild type.
REFERENCES
- 1.Stutzin A., Hoffmann E. K. (2006) Acta Physiol. (Oxf.) 187, 27–42 [DOI] [PubMed] [Google Scholar]
- 2.Okada Y., Maeno E., Shimizu T., Manabe K., Mori S., Nabekura T. (2004) Pflugers Arch. 448, 287–295 [DOI] [PubMed] [Google Scholar]
- 3.Lang F., Busch G. L., Ritter M., Völkl H., Waldegger S., Gulbins E., Häussinger D. (1998) Physiol. Rev. 78, 247–306 [DOI] [PubMed] [Google Scholar]
- 4.Lang F., Madlung J., Bock J., Lükewille U., Kaltenbach S., Lang K. S., Belka C., Wagner C. A., Lang H. J., Gulbins E., Lepple-Wienhues A. (2000) Pflugers Arch. 440, 902–907 [DOI] [PubMed] [Google Scholar]
- 5.Hoffmann E. K., Simonsen L. O., Lambert I. H. (1984) J. Membr. Biol. 78, 211–222 [DOI] [PubMed] [Google Scholar]
- 6.Pedersen S. F., Prenen J., Droogmans G., Hoffmann E. K., Nilius B. (1998) J. Membr. Biol. 163, 97–110 [DOI] [PubMed] [Google Scholar]
- 7.Hoffmann E. K. (2000) Cell Physiol. Biochem. 10, 273–288 [DOI] [PubMed] [Google Scholar]
- 8.Jentsch T. J., Stein V., Weinreich F., Zdebik A. A. (2002) Physiol. Rev. 82, 503–568 [DOI] [PubMed] [Google Scholar]
- 9.Fürst J., Gschwentner M., Ritter M., Bottà G., Jakab M., Mayer M., Garavaglia L., Bazzini C., Rodighiero S., Meyer G., Eichmüller S., Wöll E., Paulmichl M. (2002) Pflugers Arch. 444, 1–25 [DOI] [PubMed] [Google Scholar]
- 10.Vennekens R., Trouet D., Vankeerberghen A., Voets T., Cuppens H., Eggermont J., Cassiman J. J., Droogmans G., Nilius B. (1999) J. Physiol. 515, 75–85 [DOI] [PMC free article] [PubMed] [Google Scholar]
- 11.Valverde M. A., O'Brien J. A., Sepúlveda F. V., Ratcliff R., Evans M. J., Colledge W. H. (1993) Pflügers Arch 425, 434–438 [DOI] [PubMed] [Google Scholar]
- 12.Valverde M. A., O'Brien J. A., Sepúlveda F. V., Ratcliff R. A., Evans M. J., Colledge W. H. (1995) Proc. Natl. Acad. Sci. U.S.A. 92, 9038–9041 [DOI] [PMC free article] [PubMed] [Google Scholar]
- 13.Katoh M., Katoh M. (2004) Int. J. Mol. Med. 14, 759–764 [PubMed] [Google Scholar]
- 14.Rock J. R., Futtner C. R., Harfe B. D. (2008) Dev. Biol. 321, 141–149 [DOI] [PubMed] [Google Scholar]
- 15.Carles A., Millon R., Cromer A., Ganguli G., Lemaire F., Young J., Wasylyk C., Muller D., Schultz I., Rabouel Y., Dembélé D., Zhao C., Marchal P., Ducray C., Bracco L., Abecassis J., Poch O., Wasylyk B. (2006) Oncogene 25, 1821–1831 [DOI] [PubMed] [Google Scholar]
- 16.Yang Y. D., Cho H., Koo J. Y., Tak M. H., Cho Y., Shim W. S., Park S. P., Lee J., Lee B., Kim B. M., Raouf R., Shin Y. K., Oh U. (2008) Nature 455, 1210–1215 [DOI] [PubMed] [Google Scholar]
- 17.Schroeder B. C., Cheng T., Jan Y. N., Jan L. Y. (2008) Cell 134, 1019–1029 [DOI] [PMC free article] [PubMed] [Google Scholar]
- 18.Caputo A., Caci E., Ferrera L., Pedemonte N., Barsanti C., Sondo E., Pfeffer U., Ravazzolo R., Zegarra-Moran O., Galietta L. J. (2008) Science 322, 590–594 [DOI] [PubMed] [Google Scholar]
- 19.Takizawa P. A., DeRisi J. L., Wilhelm J. E., Vale R. D. (2000) Science 290, 341–344 [DOI] [PubMed] [Google Scholar]
- 20.Altamirano J., Brodwick M. S., Alvarez-Leefmans F. J. (1998) J. Gen. Physiol. 112, 145–160 [DOI] [PMC free article] [PubMed] [Google Scholar]
- 21.Pafundo D. E., Mut P., Pérez Recalde M., González-Lebrero R. M., Fachino V., Krumschnabel G., Schwarzbaum P. J. (2004) Am. J. Physiol. Regul. Integr. Comp Physiol. 287, R833–R843 [DOI] [PubMed] [Google Scholar]
- 22.Kunzelmann K., Allert N., Kubitz R., Breuer W. V., Cabantchik Z. I., Normann C., Schumann S., Leipziger J., Greger R. (1994) Pflügers Arch. 428, 76–83 [DOI] [PubMed] [Google Scholar]
- 23.de la Fuente R., Namkung W., Mills A., Verkman A. S. (2008) Mol. Pharmacol. 73, 758–768 [DOI] [PubMed] [Google Scholar]
- 24.Pifferi S., Dibattista M., Menini A. (2009) Pflugers Arch., in press [DOI] [PubMed] [Google Scholar]
- 25.Franco R., Panayiotidis M. I., de la Paz L. D. (2008) J. Cell. Physiol. 216, 14–28 [DOI] [PubMed] [Google Scholar]
- 26.Chen B., Nicol G., Cho W. K. (2007) J. Membr. Biol. 215, 1–13 [DOI] [PubMed] [Google Scholar]
- 27.Van der Wijk T., De Jonge H. R., Tilly B. C. (1999) Biochem. J. 343, 579–586 [DOI] [PMC free article] [PubMed] [Google Scholar]
- 28.Adam G., Ousingsawat J., Schreiber R., Kunzelmann K. (2005) Pflügers Arch. 449, 470–478 [DOI] [PubMed] [Google Scholar]
- 29.Lang F., Ritter M., Gamper N., Huber S., Fillon S., Tanneur V., Lepple-Wienhues A., Szabo I., Gulbins E. (2000) Cell Physiol. Biochem. 10, 417–428 [DOI] [PubMed] [Google Scholar]
- 30.Lan W. Z., Abbas H., Lam H. D., Lemay A. M., Hill C. E. (2005) Am. J. Physiol. Gastrointest. Liver Physiol. 288, G221–G229 [DOI] [PubMed] [Google Scholar]
- 31.Diener M., Nobles M., Rummel W. (1992) Pflügers Arch. 421, 530–538 [DOI] [PubMed] [Google Scholar]


