Abstract
Nebulin is a giant filamentous F-actin-binding protein (∼800 kDa) that binds along the thin filament of the skeletal muscle sarcomere. Nebulin is one of the least well understood major muscle proteins. Although nebulin is usually viewed as a structural protein, here we investigated whether nebulin plays a role in muscle contraction by using skinned muscle fiber bundles from a nebulin knock-out (NEB KO) mouse model. We measured force-pCa (−log[Ca2+]) and force-ATPase relations, as well as the rate of tension re-development (ktr) in tibialis cranialis muscle fibers. To rule out any alterations in troponin (Tn) isoform expression and/or status of Tn phosphorylation, we studied fiber bundles that had been reconstituted with bacterially expressed fast skeletal muscle recombinant Tn. We also performed a detailed analysis of myosin heavy chain, myosin light chain, and myosin light chain 2 phosphorylation, which showed no significant differences between wild type and NEB KO. Our mechanical studies revealed that NEB KO fibers had increased tension cost (5.9 versus 4.4 pmol millinewtons−1 mm−1 s−1) and reductions in ktr (4.7 versus 7.3 s−1), calcium sensitivity (pCa50 5.74 versus 5.90), and cooperativity of activation (nH 3.64 versus 4.38). Our findings indicate the following: 1) in skeletal muscle nebulin increases thin filament activation, and 2) through altering cross-bridge cycling kinetics, nebulin increases force and efficiency of contraction. These novel properties of nebulin add a new level of understanding of skeletal muscle function and provide a mechanism for the severe muscle weakness in patients with nebulin-based nemaline myopathy.
Introduction
Muscle contraction is based on cyclic interactions between the myosin cross-bridges that are part of the thick filaments and actin, the major protein of the thin filament (1). The thin filament contains troponin C (TnC),2 troponin I (TnI), and troponin T (TnT), which together make up the troponin (Tn) complex. The Tn complex and tropomyosin (Tm) together participate in the calcium-dependent regulation of thin filament activation (2). In addition to Tn and Tm, thin filaments of vertebrate skeletal muscle also contain nebulin (3). Nebulin is a giant filamentous protein that spans the entire thin filament, with its C terminus anchored in the Z-disk and its N-terminal region located near the thin filament pointed end (4, 5). The majority of the nebulin sequence is composed of ∼35-amino acid modules, with the central module 9 (M9) and module 162 (M162) modules arranged into seven-module super-repeats (6–8). This arrangement enables a single nebulin module to interact with a single actin monomer, and each nebulin super-repeat to associate with a single Tm·Tn complex (8–10). Previous work has shown that nebulin plays structural roles (11, 12), and this work is focused on the role of nebulin in regulating muscle contraction.
Evidence for the role of nebulin in regulating thin filament activation has been obtained in the following: 1) in in vitro studies that showed that nebulin binds to F-actin with high affinity and that this affinity is reduced by adding Tm and Tn (8, 9), and 2) in experiments in which recombinant nebulin fragments inhibited the sliding velocity of actin over myosin (13). It is uncertain how such findings extrapolate to the more complex myofibrillar system, with many geometric and mechanical constraints that are absent in vitro. Thus to establish the role of nebulin in muscle contraction, one needs to study higher order systems. This work has been held back by the lack of methods to specifically extract nebulin. Here we took advantage of our recently developed nebulin KO (NEB KO) mouse model (11) and studied the role(s) of nebulin in muscle contraction. Our findings reveal a novel role for nebulin in thin filament activation and tuning cross-bridge cycling kinetics.
EXPERIMENTAL PROCEDURES
Muscles
The NEB KO model has been reported earlier (11). NEB KO mice were identified through PCR genotyping and further confirmed with protein gels. Tibialis cranialis muscles of 7–9-day-old mice were skinned overnight at 4 °C in relaxing solution (RS) containing 1% (w/v) Triton X-100 (RS: 50 mm BES (pH 7.0), 31 mm potassium propionate, 10 mm NaN3, 20 mm EGTA, 6.29 mm MgCl2, 6.09 mm ATP, 20 mm 2,3-butanedione monoximine, 12 mm creatine phosphate, 10 IU/ml creatine kinase, 1 mm DTT, and a mixture of protease inhibitors (4 μm benzamidine-HCl, 5 μm bestatin, 2 μm E-64, 10 μm leupeptin, 1 μm pepstatin, and 200 μm PMSF)). Detergent-skinned muscle preparations were washed thoroughly with the RS buffer and stored in 50% glycerol and RS at −20 °C for not more than 6 weeks. Because the size of single muscle fibers (diameter ∼10 um) was too small for several of our methods (especially the ATPase measurements), we used small muscle fiber bundles (diameter ∼0.1 mm) instead. Fiber length was typically ∼2.0 mm. Experiments had been approved by the IACUC of the University of Arizona.
Force-pCa Relations
Skinned muscle fiber bundles were attached to a displacement generator (model 300B, Cambridge Technology, Cambridge, MA) at one end and to a force transducer element (AE 801, SensoNor, Horten, Norway) at the other end using aluminum T-clips. The resting sarcomere length (SL) was set to 2.0 μm using a He-Ne laser diffraction system. After two cycles of full activation (pCa 4.3) and relaxation (pCa 8.5), the resting SL was readjusted to 2.0 μm. By using this approach, we found that the resting SL remained stable throughout the experiment. Fiber width and diameter were measured at three points along the fiber, and the cross-sectional area was determined assuming an elliptical cross-section. Tension was expressed as force per cross-sectional area. To determine the pCa-tension relation (pCa = −log of molar free Ca2+ concentration), skinned muscle fiber bundles were sequentially bathed in solutions with pCa values ranging from 4.3 to 8.5 and then back to 4.3, and the corresponding tension was measured. Muscle fibers were discarded if the maximally activated tension at the end of the pCa series had decreased more than 20% of the initial maximally activated tension (average rundown of reconstituted WT (12 ± 2% (n = 8) and NEB KO fibers (14 ± 2% (n = 8)) was not significantly different). Measured tension values were normalized to the maximal tension obtained at pCa 4.3. Because the maximal tension at the end of the experiment was slightly less than that at the beginning, we calculated the maximal active tension for each pCa assuming that rundown varied with the number of activations (this results in ∼1.5% rundown per activation). The obtained pCa-tension data were fit to the Hill equation, providing pCa50 (pCa giving 50% maximal active tension) and the Hill coefficient, nH, as the index of myofilament cooperativity (for additional details see Ref. 14).
Muscle Fiber Stiffness
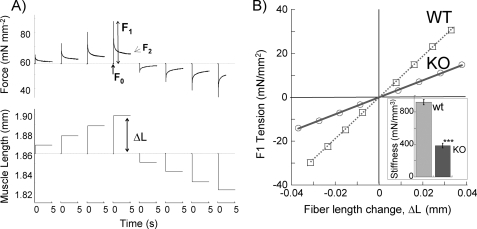
Fiber bundles were maximally activated at pCa 4.3. When the muscle fiber reached a steady-state isometric force (F0), the muscle length was changed in a step-like fashion (either increased (+) or decreased (−)) by ±0.5, ±1.0, ±1.5, and ±2.0% of muscle length (Fig. 4A gives an example). Stiffness associated with the number of strongly bound cross-bridges prior to stretch was estimated from the relationship between length change (ΔL) and the peak force response (F1). Stiffness is represented as the slope of the linear regression of the relationship between F1 and ΔL.
FIGURE 4.
Stiffness measurements. A, explanation of the protocol that was used (see “Experimental Procedures” for details). B, average results of WT and NEB KO fibers. Slope of instantaneous force response to stretch (F1) divided by length change (ΔL) provides a measurement of fiber stiffness. Inset shows that stiffness is significantly reduced in NEB KO fibers. ***, p < 0.001.
ktr Measurements
To measure the rate of tension redevelopment (ktr), we used the large slack/release approach, originally described by Brenner (15), to disengage force-generating cross-bridges from the thin filaments, which were isometrically activated. Fast activation of the fiber was achieved by transferring the skinned muscle fibers from the pre-activation solution containing a low concentration of EGTA (pCa 9.0) to a pCa 4.3 activating solution. Once the steady state was reached, a slack equivalent to 10% of the muscle length was rapidly induced at one end of the muscle using the motor. This was followed immediately by an unloaded shortening lasting 20 ms. The remaining bound cross-bridges were mechanically detached by rapidly (1 ms) restretching the muscle fiber to its original length, after which tension redevelops. The rate constant of monoexponential tension redevelopment was determined by fitting the rise of tension to the following equation: F = Fss(1 − e−ktr·t), where F is force at time t and ktr is the rate constant of tension redevelopment.
Simultaneous Force-ATPase Measurement
We used a system similar to the one described by de Tombe and Stienen (16). To measure the ATPase activity, a near-UV light was projected through the quartz window of the bath (30-μl volume and temperature controlled at 20 °C) and detected at 340 nm. Maximum activation buffer (pCa 4.3) contained (in mm) the following: potassium propionate 31, Na2ATP 5.95, MgCl2 6.61, EGTA 10, CaCl2 10.11, BES 50 (pH 7.0), NaN3 10, NADH 0.9, and phosphoenolpyruvate 10, with 4 mg ml−1 pyruvate kinase (500 units mg−1), 0.24 mg ml−1 lactate dehydrogenase (870 units mg−1), and 20 μm A2P5 as well as a mixture of protease inhibitors. For efficient mixing, the solution in the bath was continuously stirred by means of motor-driven vibration of a membrane positioned at the base of the bath. ATPase activity of the skinned fiber bundles was measured as follows: ATP regeneration from ADP was coupled to the breakdown of phosphoenolpyruvate to pyruvate, and ATP was catalyzed by pyruvate kinase, which is linked to the synthesis of lactate catalyzed by lactate dehydrogenase. The breakdown of NADH, which is proportional to the amount of ATP consumed, was measured on line by UV absorbance at 340 nm. The ratio of light intensity at 340 nm (sensitive to NADH concentration), and the light intensity at 410 nm (reference signal), was obtained by means of an analog divider. After each recording, the UV absorbance signal of NADH was calibrated by multiple rapid injections of 0.25 nmol of ADP (0.025 μl of 10 mm ADP) into the bathing solution, with a motor-controlled calibration pipette. The slope of the [ATP] versus time trace during steady-state tension development of a calcium-induced contraction (see Fig. 3A for an example) was determined from a linear fit, and the value was divided by the fiber volume (in mm3) to determine the ATPase rate of the fiber. ATPase rates were corrected for the basal ATPase in relaxing solution. The ATPase rate and tension at different pCa values were plotted against each other, and the tension cost was determined from the slope of a linear fit to the data.
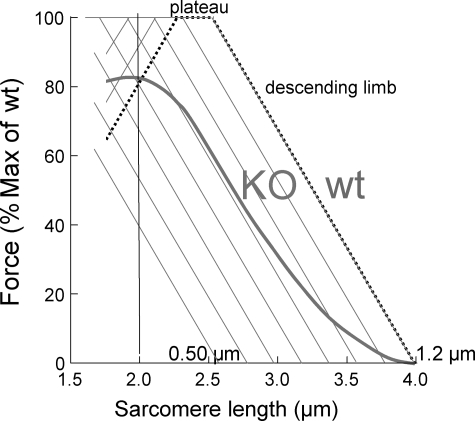
FIGURE 3.
Predicted force-SL relation of WT and NEB KO TC fibers. We assumed a thick filament length of 1.6 μm and a bare zone width of 0.15 μm. WT fibers had a thin filament length of 1.2 μm (measured from the mid-Z-disk to edge of H-zone). For NEB KO, we constructed eight predicted F-SL relations with thin filaments that were 0.5, 0.6, 0.7, 0.8, 0.9, 1.0, 1.1, or 1.2 μm (covering the full range that we measured (11)), and from these eight relations we determined the average relation (see thick curve labeled KO). (Notice that averaging the eight relations assumes that thin filament length is uniformly distributed from 0.5 to 1.2 μm, which is consistent with our previous measurements (11).) The WT and average NEB KO curves intersect at the SL used in this study (2.0 μm).
Reconstitution of Recombinant Fast Skeletal (fs) Tn Isoforms into Detergent-skinned Muscle Fiber Bundles
Exchange of endogenous troponin with bacterially expressed recombinant fs troponin complex was based on the method described previously (17). The extraction solution containing a mixture of fsTn was prepared as follows: fsTnT (0.7 mg/ml, w/v) and fsTnI (0.7 mg/ml, w/v) were initially dissolved in 50 mm Tris-HCl (pH 8.0), 6 m urea, 1.0 m KCl, 10 mm DTT, and a mixture of protease inhibitors. High salt and urea were removed by successive dialysis against the following buffers: 50 mm Tris-HCl (pH 8.0 at 4 °C), 4 m urea, 0.7 m KCl, 1 mm DTT, 4 mm benzamidine-HCl, 0.4 mm PMSF, and 0.01% NaN3, followed by 50 mm Tris-HCl (pH 8.0 at 4 °C), 2 m urea, 0.5 m KCl, 1 mm DTT, 4 mm benzamidine-HCl, 0.4 mm PMSF, and 0.01% NaN3, and then finally against the extraction buffer containing 50 mm BES (pH 7.0 at 20 °C), 180 mm KCl, 10 mm 2,3-butanedione monoximine, 5 mm EGTA, 6.27 mm MgCl2, 1.0 mm DTT, 4 mm benzamidine-HCl, 0.2 mm PMSF, and 0.01% NaN3. After final dialysis, 5 mm MgATP2− and fresh protease inhibitors were added to the supernatant containing cTnT-cTnI. Any undissolved protein was removed by spinning in a microcentrifuge at maximum speed for 15 min. The exchange experiment was carried out in the extraction solution containing fsTnT-fsTnI for 3–4 h at room temperature with gentle constant stirring. After extraction, muscle fiber bundles were washed twice with extraction buffer for 15 min. fsTnT-fsTnI-treated fiber bundles were reconstituted overnight (4 °C) with fsTnC (2 mg/ml) prepared in the relaxation buffer (50 mm BES, 51.0 mm potassium propionate, 5.83 mm Na2ATP, 10 mm EGTA, 5 mm NaN3, 1 mm DTT, 10 mm P-enolpyruvate, 50 μm leupeptin, 1 μm pepstatin, 200 μm PMSF, 10 μm oligomycin, and 20 μm A2P5 (ionic strength 180 mm)).
Protein Analysis
For Tn analysis, Western blotting was performed using fast skeletal and slow skeletal specific antibodies (ss-TnI, cs-20645; fs-TnI, sc-8120; ssTnT, sc-28269; fs-TnT, sc-8123; TnC, sc-8117 from Santa Cruz Biotechnology and fsTnT JLT-12 from Sigma). For Tm expression, Western blotting was performed using an antibody directed against both α- and β-Tm (CH1, Hybridoma Bank, University of Iowa). For MHC analysis, the skinned muscle fiber bundles that had been used for mechanical experiments were detached from the force transducer and servo-motor and placed in SDS sample buffer containing 62.5 mm Tris-HCl, 2% (w/v) SDS, 10% (v/v) glycerol, and 0.001% (w/v) bromphenol blue at a pH of 6.8. The samples were stored at −80 °C until assayed. The samples were denatured by boiling for 2 min. The stacking gel contained a 4% acrylamide concentration (pH 6.7), and the separating gel contained 7% acrylamide (pH 8.7) with 30% glycerol (v/v). Control samples of mouse soleus and tibialis cranialis muscle (neonatal and adult) were run on the gels for comparison of migration patterns of the myosin heavy chain isoforms. Sample volumes of 10 μl were loaded per lane. The gels were run for 24 h at 15 °C and a constant voltage of 275 V. The gels were silver-stained, scanned, and analyzed with one-dimensional scan EX software. For MLC2 phosphorylation, we used urea/glycerol-PAGE as described previously (18). The densitometric analysis of protein bands was made with one-dimensional scan EX software. The integrated optical density of the MLC2 and the MLC2-P was used to obtain the percentage of MLC2-P. We also analyzed the levels of phosphorylation using the Pro-Q Diamond stain (Molecular Probes), according to the manufacturer's instructions. The gel was then re-stained with SYPRO Ruby or with silver stain. The Pro-Q Diamond band integrated optical density was normalized to the corresponding total protein integrated optical density.
Statistical Analysis
For muscle mechanics experiments, 7–9 fiber muscle bundles were studied per group, and for gel electrophoresis and Western blotting studies, typically 6 muscle fiber bundles were analyzed per group. Data are presented as means ± S.E. Statistical analyses were performed by t test between NEB KO and WT mice; p < 0.05 was considered statistically significant.
RESULTS
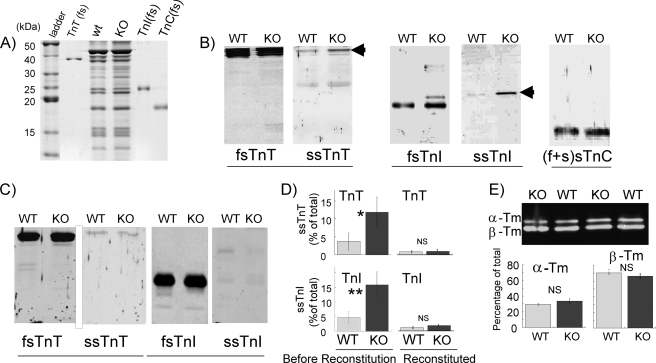
Because differences in thin filament regulatory protein can cause changes in myofilament calcium sensitivity and cross-bridge cycling kinetics (2), we first examined the protein levels of fast skeletal (fs) and slow skeletal (ss) TnI, TnT, and TnC. High resolution protein gels in the 10–50-kDa range did not reveal major differences between NEB KO and WT muscle fiber bundles (Fig. 1A). To determine whether minor differences existed, we performed Western blot studies with antibodies against fsTnT, ssTnI, fsTnT, ssTnI, and a pan-specific TnC (Fig. 1, B–D). Both WT and NEB KO muscles expressed predominantly fsTn, but a low level of ssTnT and ssTnI was also present (Fig. 1B). The ssTnT and ssTnI level was in each case ∼5% of total fsTnT and fsTnI in WT muscle fibers and ∼15% in KO muscle fibers, a difference that was found to be statistically significant (Fig. 1D, left panels). To rule out the effect of any altered Tn expression or differences in their post-translational modification, we replaced the native Tn complex of WT and NEB KO fibers with bacterially expressed recombinant fsTn (see “Experimental Procedures”). As expected, reconstituted fibers contained negligible amounts of ssTnT and ssTnI, with no significant differences between WT and NEB KO muscle fiber bundles (Fig. 1, C and D, right panels). We also studied possible shifts in Tm isoforms and found no significant differences between WT and NEB KO fibers (Fig. 1E). MHC isoform expression was also evaluated. The fiber bundles contained predominantly neonatal MHC (53 ± 3 (WT) and 59 ± 6 (KO) % of total), small amounts of MHC IIA (15 ± 8 (WT) and 29 ± 6 (KO) % of total), and MHC IIB (26 ± 8 (WT) and 10 ± 6 (KO) % of total), and barely detectable levels of MHC I (4 ± 1 (WT) and 5 ± 1 (KO) % of total), with no significant differences between WT and NEB KO fibers. Absence of a significant change in MHC isoform expression is consistent with a recent study by Gokhin et al. (19) on MHC isoform expression in gastrocnemius muscle of WT and NEB KO mice (postnatal day 7) where also no significant differences were found. Finally, we determined the phosphorylation status of myosin light chain 2 (MLC2), which is known to affect calcium sensitivity (20), and we determined the MLC3/MLC1 ratio, which in some studies has been shown to affect cross-bridge kinetics (for original citations see Ref. 21). However, we found no significant differences between WT and NEB KO fibers (Fig. 2). In summary, the main difference between WT and NEB KO muscle fibers, in addition to nebulin, was up-regulated ssTnT and ssTnI isoforms in NEB KO mice. This difference was abolished following reconstitution with WT recombinant fsTn. Hence, we used solely fsTn-reconstituted TC fibers from WT and NEB KO mice to study the effect of nebulin on myofilament calcium sensitivity and cross-bridge cycling kinetics.
FIGURE 1.
Tn and Tm in WT and NEB KO fiber bundles before and after fsTn reconstitution. A, SDS-PAGE of WT and NEB KO TC muscle. Purified fsTnT, fsTnI, and fsTnC were run as standards. No major differences are visible between WT and NEB KO muscles. B and C, Western blot analysis with antibodies to fs and ss isoforms of TnT, TnI, and TnC before (B) and after (C) fsTn reconstitution. Note up-regulation of ssTnT and ssTnI in NEB KO fibers before reconstitution but not after. D, quantitative analysis of ssTnT (top) and ssTnI (bottom) before and after reconstitution (Recons.) with fsTn. Only very low levels of ssTnT and ssTnI are detectable in reconstituted muscles (1–2% of total), and levels are not significantly (NS) different between WT and NEB KO fibers. *, p < 0.05; **, p < 0.01. E, analysis of Tm isoform expression. WT and NEB KO fibers express similar levels of αTm and βTm.
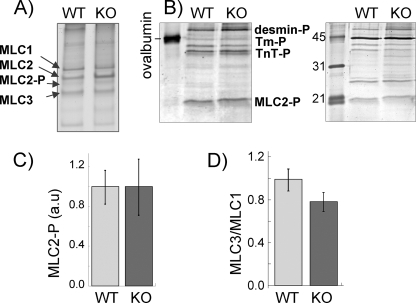
FIGURE 2.
MLC phosphorylation (A–C) and MLC3/MLC1 expression ratio (D). MLC2 phosphorylation was determined using urea/glycerol-PAGE (A) and Pro-Q diamond phosphoprotein staining (B and C). Urea-glycerol PAGE shows a minor band below MLC2, which based on our previous mass spectrometry work (18) is identified as MLC2-P. MLC2P makes up ∼10% of total MLC2, with no noticeable difference between WT and NEB KO fiber bundles. B, Pro-Q diamond (left) stains MLC2 (identification based on mobility and Western blots) with no noticeable differences between WT and NEB KO. Pro-Q diamond staining was normalized to SYPRO Ruby (right)-based protein levels, and normalized results are shown in C. MLC phosphorylation is not different in WT and NEB KO fiber bundles. D, MLC3/MLC1 ratio is not different between WT and NEB KO fibers.
Mechanical experiments on contracting muscle were carried out at a sarcomere length (SL) of 2.0 μm, which was preferred for the following reasons. Using electron microscopy on phalloidin gold-labeled muscle fibers, we showed previously (11) that thin filaments in TC WT muscle are 1.2 μm long and that in NEB KO muscle thin filament length varies from 0.5 to 1.2 μm (average ∼0.8 μm). Using these values, we then constructed the force-SL relations for WT and the average curve for NEB KO muscle (details in Fig. 3). Results showed that on the descending limb of WT muscle (SLs >2.5 um) force is much less in NEB KO than in WT muscle. However, on the plateau and ascending limb of the WT muscle, the difference between WT and KO force is much reduced, and at a SL of ∼2.0 μm the WT and NEB KO forces are the same (∼80% of maximal). Thus, by performing our mechanical study at a SL of 2.0 μm, force differences due to thin filament length differences were minimized. An additional reason for using this SL is that passive tension is absent at this length, and our measurements (especially ktr) were therefore not affected by changes in passive tension.
Maximal Ca2+-activated active tension (pCa 4.3) was significantly reduced from 84 ± 4 mN/mm2 in WT to 38 ± 2.2 mN/mm2 in the NEB KO muscle fibers, a reduction of ∼50%. We also measured muscle fiber stiffness by imposing rapid changes in muscle length to estimate stiffness associated with the number of strongly bound cross-bridges (Fig. 4). Stiffness was significantly lower in NEB KO muscle fibers (920 ± 23 and 388 ± 29 mN/mm3). The reduction in stiffness for NEB KO muscle fibers was proportional to the reduction in Ca2+-activated maximal tension, and as a result the tension/stiffness ratio was not significantly different between WT and NEB KO muscle fibers (Table 1). This demonstrated that the tension per cross-bridge is the same in NEB KO muscle fibers. Thus, the lower Ca2+-activated maximal tension in NEB KO muscle fibers is due to a reduced number of force-generating cross-bridges.
TABLE 1.
Mechanical measurements in isometrically contracted skinned TC fiber bundles from WT and NEB KO mice
Lines 1–5 were measured at pCa 4.3; lines 6 and 7 were measured at a pCa range of 8.5 to 4.3. NS means not significant.
| WT | NEB KO | p value | |
|---|---|---|---|
| 1. Tension (mN/mm2) | 84 ± 4 | 38 ± 2.2 | <0.001 |
| 2. Stiffness (mN/mm3) | 920 ± 23 | 388 ± 29 | <0.001 |
| 3. Tension/stiffness (0.01 mm) | 9.1 ± 0.4 | 9.7 ± 0.6 | NS |
| 4. ktr (s−1) | 7.8 ± 0.3 | 4.7 ± 0.3 | 0.003 |
| 5. Tension cost (pmol mN−1 mm−1 s−1) | 4.4 ± 0.3 | 5.9 ± 0.3 | 0.005 |
| 6. pCa50 | 5.90 ± 0.02 | 5.74 ± 0.01 | <0.001 |
| 7. nH | 4.38 ± 0.23 | 3.64 ± 0.14 | 0.02 |
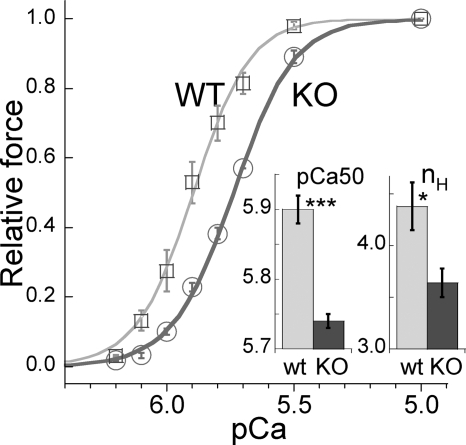
We measured active force at a range of calcium levels and expressed force relative to the maximal force at pCa 4.3. The obtained pCa-force relations were shifted to the right in NEB KO muscle fibers (Fig. 5) with a pCa50 value of 5.90 for WT muscle fibers and 5.74 for NEB KO muscle fibers. NEB KO muscle fibers also had an ∼20% reduction in the cooperativity of myofilament activation as reflected by the reduced Hill coefficient (nH) (Fig. 5, inset; Table 1).
FIGURE 5.
Force-pCa relations of WT and NEB KO reconstituted fiber bundles. The relation of NEB KO fibers is shifted to the right, indicating that the NEB KO fibers are less calcium-sensitive. ***, p < 0.001.Inset, mean pCa50 and nH values are significantly lower in NEB KO fibers. *, p < 0.05; ***, p < 0.001.
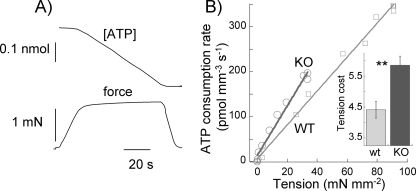
The tension cost was determined optically by measuring the breakdown of NADH during contraction, with NADH levels enzymatically coupled to ATP utilization (see under “Experimental Procedures”). An example of a maximally activated NEB KO muscle fiber bundle with [ATP] falling linearly during the tension plateau is shown in Fig. 6A. The slope of the [ATP] versus time curve was normalized by the fiber volume to obtain ATP consumption rates that can be compared for differently sized fiber bundles. For each muscle fiber bundle, we measured ATP consumption rates at a range of pCa values, and results were plotted against the active tension of each contraction. A typical result for an NEB KO and WT muscle fiber is shown in Fig. 6B. ATP consumption rates varied linearly with active tension with a slope that reflects tension cost. The tension cost was significantly higher in NEB KO muscle fibers (Fig. 6B, inset; Table 1).
FIGURE 6.
Tension cost of WT and NEB KO fibers. A, example of maximally activated NEB KO fiber bundle (pCa 4.3) with developed force at bottom and [ATP] at the top. The slope of the [ATP] versus time trace was divided by fiber volume (in mm3) to determine ATP consumption rate. B, ATP consumption rates were determined at different activating calcium levels and obtained values plotted against tension. An example of a NEB KO and WT preparation is shown. Results follow a linear relationship with a slope that reflects tension cost. Inset, mean tension cost (in pmol mm−3 s−1) is significantly higher in NEB KO fibers. **, p < 0.01.
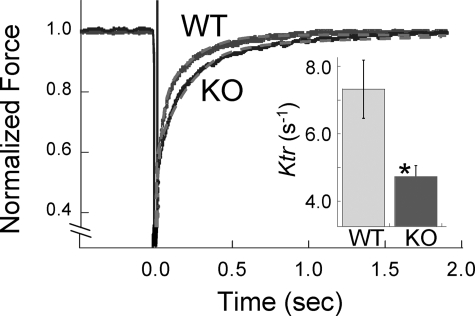
Finally, we also measured the rate of tension redevelopment. Muscle fibers were first isometrically activated at pCa 4.3, and when a steady tension was reached, cross-bridges were disengaged by performing a quick release, a brief period of unloaded shortening, and then a rapid restretch to the original length. Following restretch, tension rebuilds with a time course that can be fit with a monoexponential curve with ktr as rate constant. Fig. 7 shows a ktr experiment on a WT and NEB KO muscle fiber bundle, revealing that tension recovers faster in the WT muscle fiber bundle. The summarized results are shown in Fig. 7, inset. ktr is significantly lower in NEB KO muscle fibers (4.7 versus 7.3 s−1).
FIGURE 7.
ktr measurements of WT and NEB KO fibers. Example of ktr measurement at pCa 4.3 with superimposed results of NEB KO and WT fiber bundles is shown. Gray broken lines indicate exponential fit used to determine ktr. (Force prior to length step was set to 1.0.) Inset, mean ktr is significantly lower in NEB KO fibers. *, p < 0.05.
DISCUSSION
To establish whether nebulin plays a role in skeletal muscle thin filament activation and cross-bridge cycling kinetics, we studied tibialis cranialis muscle fibers from NEB KO mice. NEB KO muscle fibers had reduced myofilament calcium sensitivity, reduced cooperativity of activation, increased tension cost, and a lower ktr. For these effects to be ascribed to nebulin, it is important that no major differences in regulatory proteins exist between WT and NEB KO muscle fibers. No differences were found in MHC isoform composition, MLC composition, or MLC2 phosphorylation levels. The only significant difference that we found in our protein analysis was up-regulated ssTnI and ssTnT in nebulin KO fibers. To rule out that these differences in Tn isoforms gave rise to altered force production and kinetics, we reconstituted all muscle fibers with bacterially expressed WT recombinant Tn (Fig. 1). Hence, we consider it likely that nebulin is responsible for the measured differences between NEB KO and WT muscle fibers.
Effect of Nebulin on Maximal Tension Development
We found that maximal active tension was reduced from ∼80 mN/mm2 in WT to ∼40 mN/mm2 in NEB KO fibers. This ∼50% reduction is less than the >90% reduction (from ∼60 to ∼ 5 mN/mm2) that was recently reported for intact gastrocnemius muscle of NEB KO mice at postnatal day 7 (19). A possible explanation for the discrepancy is that depressed excitation-contraction coupling lowered the activating calcium level in the intact muscle experiments, an effect that would be absent in skinned fiber experiments where calcium is controlled at a saturating level. It is likely that the direct effect of nebulin on myofilament function is best captured in skinned fiber experiments.
Nebulin might influence the maximal force at saturating calcium levels in various ways, one of which is via its ability to specify the length of thin filaments. The length of the thin filament is an important functional parameter because it determines the degree of overlap between thin and thick filaments, and thereby sets the level of maximum force that a muscle can develop at a given SL. Several recent studies (8, 22) have provided experimental evidence to show that nebulin specifies thin filament length via its unique N- and C-terminal sequences. The N-terminal end of nebulin interacts with tropomodulin and the C-terminal end with CapZ, both of which are thought to play a role in specifying the length of F-actin (22, 23). Although details of the mechanism(s) of thin filament length regulation remain to be established (24), that nebulin is a major player in this process is suggested by studies on NEB KO mice (11, 12) in which it was found that thin filament length is variable and on average shorter than in WT mice. The extent to which shorter thin filaments result in lower force depends on the SL, with large reductions at long SL where both WT and KO fibers are on the descending limb of the force-SL length relation but less at short SL where KO fibers are still on the descending limb, and WT fibers are already on the ascending limb (Fig. 3). At the SL where this study was carried out (2.0 μm), WT and KO fibers produce similar force levels (∼80% of maximal, see Fig. 3), and the shorter thin filaments of KO fibers are predicted to have had a negligible effect on maximal force in this study.
Nebulin might also affect force by influencing cross-bridge cycling kinetics and altering the fraction of strongly bound cross-bridges that generate force. Whether this fraction is different in NEB KO fibers can be evaluated from ktr, tension cost, and muscle stiffness measurements. We used the analytical framework suggested by Brenner (15) in which the cross-bridge cycle is reduced to a two-state model with apparent rate constants, fapp and gapp, with fapp representing the transition from the nonforce-generating state to the force-generating state, and gapp representing the transition from the force-generating state back to the nonforce-generating state. In this model, the tension cost (slope of ATPase versus force relation) is directly proportional to the detachment rate (gapp) of myosin cross-bridges from actin (15). The increased tension cost of NEB KO muscle fibers (Fig. 6) indicates that gapp is increased in NEB KO muscle fibers. In the two-state cross-bridge model, the rate of force redevelopment is proportional to fapp + gapp, and the fraction of cross-bridges attached to actin is proportional to fapp/(fapp + gapp). Thus the decrease in ktr of NEB KO muscle fibers (Fig. 7) together with the conclusion that gapp is increased indicate that fapp must be reduced and that the reduction must be larger than the increase in gapp. Combined, this leads to the conclusion that the fraction of cross-bridges attached to actin is reduced in NEB KO fibers. Because the Ca2+-activated steady-state tension (F0) and the stiffness during activation measure the force of all strong binding cross-bridges and their number, respectively, the F0/stiffness ratio is a measure of average force per cross-bridge (25). The force/stiffness ratio was not different between WT and NEB KO fibers (Table 1), indicating that nebulin does not influence the amount of force produced per attached cross-bridge. Thus, the decreased fraction of strongly bound cross-bridges in NEB KO fibers is predicted to result in a lower force. The absolute value of gapp is not known, but assuming that gapp of WT fibers is 2 s−1 (as determined in skinned fast skeletal fibers (15)), the predicted reduction in force-generating cross-bridges is 44%, which is only slightly less than observed. Despite the uncertainty about the value of gapp, the calculation does illustrate that it is likely that a significant force reduction results from the altered cross-bridge cycling kinetics determined here. Although the mechanism by which nebulin affects cross-bridge cycling needs investigation, Root and Wang (26) have shown that nebulin associates with the actin N terminus in subdomain 1, where also the myosin cross-bridge binds. Our findings suggest that the presence of nebulin at or near the myosin subfragment 1-binding site enhances cross-bridge binding and slows detachment. In summary our work shows that nebulin plays a role in muscle contraction by speeding up cross-bridge attachment and slowing cross-bridge detachment. The combined effect is increased force and reduced tension cost.
Effect of Nebulin on Thin Filament Activation
The structure and protein binding properties of nebulin make it well suited to influence thin filament activation. Nebulin contains ∼200 domains of ∼35 amino acids that are characterized by the actin binding-sequence SDXXYK; these domains make up seven domain super repeats characterized by the Tm/Tn-binding motif, WLKGIGW (8). Biochemical studies have shown that a single nebulin module interacts with a single actin monomer and that each nebulin super repeat interacts with a Tm·Tn complex of the thin filament (9); binding characteristics that support that nebulin follow the helical path of F-actin. The Tm·Tn complex regulates skeletal muscle contraction by a steric blocking mechanism in which in the relaxed state Tm blocks the actin-binding site for myosin, and the binding of Ca2+ to Tn induces a movement by Tm away from this blocked position (2). Our work demonstrates reduced myofilament calcium sensitivity of NEB KO fibers and reduced cooperativity of activation (Fig. 5). Whether these differences might be due to shorter thin filaments in NEB KO fibers per se can be evaluated from the study by Kawai and co-workers (27) in which the force-pCa relation of rabbit skinned psoas fibers was measured before and after thin filament length reduction with the actin-severing protein gelsolin. Differences in calcium sensitivity and cooperativity were only found when thin filament length was reduced by an average of >60%, which far exceeds the average 30% thin filament length reduction in TC KO fibers. Hence, it is likely that our findings cannot be explained by shorter thin filaments per se but rather by an effect of nebulin on thin filament activation. It is interesting that similar to Tm, nebulin has been shown to follow the helical path of F-actin and occupy different sites on F-actin (28). This leads to an interesting possibility that nebulin acts in concert with Tm and that it promotes the transition of contractile regulatory units (Tm-Tn) from the nonpermissive to the permissive states, thereby increasing myofilament calcium sensitivity and cooperativity. It is also possible that the increased number of force-generating cross-bridges in the presence of nebulin enhances thin filament activation, and the effect of nebulin on cross-bridge cycling kinetics is the primary event that governs both the increased number of force-generating cross-bridges and the increased calcium sensitivity. In support of this possibility, we found that the steady-state stiffness following a step-like length change (F2/ΔL, see Fig. 4A), which reflects cross-bridge recruitment at a constant calcium level, is 3-fold larger in WT than in NEB KO fibers (450 ± 28 (WT) and 149 ± 8 mN/mm3 (KO)). Finally, it is striking that the low calcium sensitivity and low cooperativity that we observed in the absence of nebulin resembles that of cardiac muscle (2, 29), where stoichiometric levels of nebulin are absent (11). Cardiac muscle has multiple mechanisms for enhancing thin filament activation, such as enhanced length-dependent activation, differences in cooperativity related to different protein isoforms, and the presence of cardiac specific phosphorylation sites, which allow cardiac muscle to grade its response to different loading conditions. Because the skeletal muscle lacks the aforementioned features unique to cardiac muscle, we propose that nebulin is essential for tuning the thin filament for optimal skeletal muscle function.
Summary
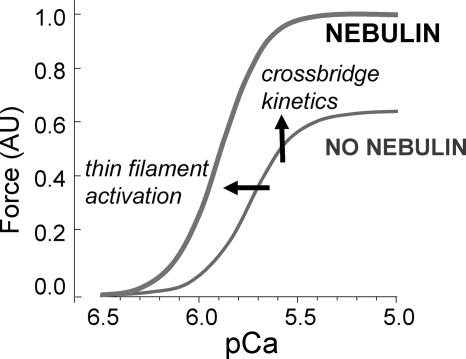
We provide evidence for the first time that nebulin alters cross-bridge cycling kinetics and thin filament activation, thereby increasing force production and lowering tension cost (Fig. 8). Nemaline myopathy, which is frequently caused by nebulin mutations and reduced levels of nebulin (30–32), is characterized by severe and debilitating muscle weakness and our work provides new avenues for understanding and combating this disease.
FIGURE 8.
Schematic of effects of nebulin on force development. Nebulin increases force as follows: 1) by altering cross-bridge cycling characteristics and increasing the number of force-generating cross-bridges, and 2) by increasing thin filament activation.
Acknowledgments
We thank Luann Wyly, Dianna Acuna-Wenner, Tiffany Pecor, and Eric Rogers for excellent technical assistance.
This work was supported, in whole or in part, by National Institutes of Health Grants AR053897 and HL062881 (to H. G.) and HL075643 (to M. C.).
- TnC
- troponin C
- NEB KO
- nebulin knockout
- WT
- wild type
- Tn
- troponin
- TnI
- troponin I
- TnT
- troponin T
- Tm
- tropomyosin
- DTT
- dithiothreitol
- PMSF
- phenylmethylsulfonyl fluoride
- MHC
- myosin heavy chain
- SL
- sarcomere length
- fs
- fast skeletal
- ss
- slow skeletal
- DTT
- dithiothreitol
- A2P5
- diadenosine 5′-pentaphosphate
- BES
- 2-[bis(2-hydroxyethyl)amino]ethanesulfonic acid
- mN
- millinewton
- TC
- tibialis cranialis.
REFERENCES
- 1.Huxley H. E. (1969) Science 164, 1356–13654181952 [Google Scholar]
- 2.Gordon A. M., Homsher E., Regnier M. (2000) Physiol. Rev. 80, 853–924 [DOI] [PubMed] [Google Scholar]
- 3.Wang K. (1996) Adv. Biophys. 33, 123–134 [PubMed] [Google Scholar]
- 4.Kruger M., Wright J., Wang K. (1991) J. Cell Biol. 115, 97–107 [DOI] [PMC free article] [PubMed] [Google Scholar]
- 5.Labeit S., Gibson T., Lakey A., Leonard K., Zeviani M., Knight P., Wardale J., Trinick J. (1991) FEBS Lett. 282, 313–316 [DOI] [PubMed] [Google Scholar]
- 6.Wang K., Knipfer M., Huang Q. Q., van Heerden A., Hsu L. C., Gutierrez G., Quian X. L., Stedman H. (1996) J. Biol. Chem. 271, 4304–4314 [DOI] [PubMed] [Google Scholar]
- 7.Labeit S., Kolmerer B. (1995) J. Mol. Biol. 248, 308–315 [DOI] [PubMed] [Google Scholar]
- 8.McElhinny A. S., Kazmierski S. T., Labeit S., Gregorio C. C. (2003) Trends Cardiovasc. Med. 13, 195–201 [DOI] [PubMed] [Google Scholar]
- 9.Ogut O., Hossain M. M., Jin J. P. (2003) J. Biol. Chem. 278, 3089–3097 [DOI] [PubMed] [Google Scholar]
- 10.Jin J. P., Wang K. (1991) J. Biol. Chem. 266, 21215–21223 [PubMed] [Google Scholar]
- 11.Witt C. C., Burkart C., Labeit D., McNabb M., Wu Y., Granzier H., Labeit S. (2006) EMBO J. 25, 3843–3855 [DOI] [PMC free article] [PubMed] [Google Scholar]
- 12.Bang M. L., Li X., Littlefield R., Bremner S., Thor A., Knowlton K. U., Lieber R. L., Chen J. (2006) J. Cell Biol. 173, 905–916 [DOI] [PMC free article] [PubMed] [Google Scholar]
- 13.Root D. D., Wang K. (1994) Biochemistry 33, 12581–12591 [DOI] [PubMed] [Google Scholar]
- 14.Chandra M., Tschirgi M. L., Tardiff J. C. (2005) Am. J. Physiol. Heart Circ. Physiol. 289, H2112–H2119 [DOI] [PubMed] [Google Scholar]
- 15.Brenner B. (1988) Proc. Natl. Acad. Sci. U.S.A. 85, 3265–3269 [DOI] [PMC free article] [PubMed] [Google Scholar]
- 16.de Tombe P. P., Stienen G. J. (1995) Circ. Res. 76, 734–741 [DOI] [PubMed] [Google Scholar]
- 17.Gallon C. E., Tschirgi M. L., Chandra M. (2006) Arch. Biochem. Biophys. 456, 127–134 [DOI] [PubMed] [Google Scholar]
- 18.Hidalgo C., Wu Y., Peng J., Siems W. F., Campbell K. B., Granzier H. (2006) Arch. Biochem. Biophys. 456, 216–223 [DOI] [PubMed] [Google Scholar]
- 19.Gokhin D. S., Bang M. L., Zhang J., Chen J., Lieber R. L. (2009) Am. J. Physiol. Cell Physiol. 296, C1123–C1132 [DOI] [PMC free article] [PubMed] [Google Scholar]
- 20.Sweeney H. L., Bowman B. F., Stull J. T. (1993) Am. J. Physiol. 264, C1085–C1095 [DOI] [PubMed] [Google Scholar]
- 21.Lutz G. J., Bremner S. N., Bade M. J., Lieber R. L. (2001) J. Exp. Biol. 204, 4237–4248 [DOI] [PubMed] [Google Scholar]
- 22.Pappas C. T., Bhattacharya N., Cooper J. A., Gregorio C. C. (2008) Mol. Biol. Cell 19, 1837–1847 [DOI] [PMC free article] [PubMed] [Google Scholar]
- 23.McElhinny A. S., Kolmerer B., Fowler V. M., Labeit S., Gregorio C. C. (2001) J. Biol. Chem. 276, 583–592 [DOI] [PubMed] [Google Scholar]
- 24.Castillo A., Nowak R., Littlefield K. P., Fowler V. M., Littlefield R. S. (2009) Biophys. J. 96, 1856–1865 [DOI] [PMC free article] [PubMed] [Google Scholar]
- 25.Campbell K. B., Razumova M. V., Kirkpatrick R. D., Slinker B. K. (2001) Ann. Biomed. Eng. 29, 384–405 [DOI] [PubMed] [Google Scholar]
- 26.Root D. D., Wang K. (2001) Biochemistry 40, 1171–1186 [DOI] [PubMed] [Google Scholar]
- 27.Ding W., Fujita H., Kawai M. (2002) Exp. Physiol. 87, 691–697 [DOI] [PubMed] [Google Scholar]
- 28.Lukoyanova N., VanLoock M. S., Orlova A., Galkin V. E., Wang K., Egelman E. H. (2002) Curr. Biol. 12, 383–388 [DOI] [PubMed] [Google Scholar]
- 29.Gordon A. M., Regnier M., Homsher E. (2001) News Physiol. Sci. 16, 49–55 [PubMed] [Google Scholar]
- 30.Sewry C. A., Brown S. C., Pelin K., Jungbluth H., Wallgren-Pettersson C., Labeit S., Manzur A., Muntoni F. (2001) Neuromuscul. Disord. 11, 146–153 [DOI] [PubMed] [Google Scholar]
- 31.Ottenheijm C. A., Witt C. C., Stienen G. J., Labeit S., Beggs A. H., Granzier H. (2009) Hum. Mol. Genet. 18, 2359–2369 [DOI] [PMC free article] [PubMed] [Google Scholar]
- 32.Wallgren-Pettersson C., Pelin K., Nowak K. J., Muntoni F., Romero N. B., Goebel H. H., North K. N., Beggs A. H., Laing N. G. (2004) Neuromuscul. Disord. 14, 461–470 [DOI] [PubMed] [Google Scholar]


