Abstract
Insulin stimulates the translocation of the glucose transporter GLUT4 from intracellular locations to the plasma membrane in adipose and muscle cells. Prior studies have shown that Akt phosphorylation of the Rab GTPase-activating protein, AS160 (160-kDa Akt substrate; also known as TBC1D4), triggers GLUT4 translocation, most likely by suppressing its Rab GTPase-activating protein activity. However, the regulation of a very similar protein, TBC1D1 (TBC domain family, member 1), which is mainly found in muscle, in insulin-stimulated GLUT4 translocation has been unclear. In the present study, we have identified likely Akt sites of insulin-stimulated phosphorylation of TBC1D1 in C2C12 myotubes. We show that a mutant of TBC1D1, in which several Akt sites have been converted to alanine, is considerably more inhibitory to insulin-stimulated GLUT4 translocation than wild-type TBC1D1. This result thus indicates that similar to AS160, Akt phosphorylation of TBC1D1 enables GLUT4 translocation. We also show that in addition to Akt activation, activation of the AMP-dependent protein kinase partially relieves the inhibition of GLUT4 translocation by TBC1D1. Finally, we show that the R125W variant of TBC1D1, which has been genetically associated with obesity, is equally inhibitory to insulin-stimulated GLUT4 translocation, as is wild-type TBC1D1, and that healthy and type 2 diabetic individuals express approximately the same level of TBC1D1 in biopsies of vastus lateralis muscle. In conclusion, phosphorylation of TBC1D1 is required for GLUT4 translocation. Thus, the regulation of TBC1D1 resembles that of its paralog, AS160.
Insulin stimulates glucose transport into adipose and muscle cells by increasing the amount of the GLUT4 glucose transporter at the cell surface by a process termed GLUT4 translocation (1, 2). Unstimulated adipocytes and myotubes sequester GLUT4 in intracellular compartments. Insulin activates signaling cascades that lead to the trafficking of specialized GLUT4 vesicles to the cell membrane and fusion of the vesicles therewith. A key signaling pathway for GLUT4 translocation proceeds from the insulin receptor through the activation of the protein kinase Akt. One Akt substrate that connects signaling to GLUT4 trafficking is the Rab GTPase-activating protein (GAP)3 known as AS160. There is now considerable evidence for the following scheme (2, 3): under basal conditions, AS160 acts as a brake on GLUT4 translocation by maintaining one or more Rab proteins required for translocation in their inactive GDP state; in response to insulin, Akt phosphorylates AS160 and thereby suppresses its GAP activity; as a consequence, the elevation of the GTP form of the Rab proteins occurs, leading to the increased docking and subsequent fusion of the GLUT4 vesicles at the plasma membrane.
More recently, we and others have characterized a paralog of AS160 known as TBC1D1 (4–7). Overall, TBC1D1 is 47% identical to AS160, with the GAP domain being 79% identical (4). Its GAP domain has the same Rab specificity as the GAP domain of AS160 (4). TBC1D1 is predominantly expressed in skeletal muscle; its expression in adipocytes is very low (5, 6). Nevertheless, 3T3-L1 adipocytes are a convenient cell type in which to examine the role of proteins in GLUT4 translocation, because insulin causes an ∼10-fold increase in GLUT4 at the cell surface. Previously, we examined the role of TBC1D1 in GLUT4 translocation by overexpressing it in 3T3-L1 adipocytes. Surprisingly, even though insulin led to phosphorylation of TBC1D1 on Akt site(s), ectopic TBC1D1 potently inhibited GLUT4 translocation (4, 5). By contrast, overexpression of AS160 did not inhibit GLUT4 translocation (8). This difference suggested that the regulation of TBC1D1 might be fundamentally different from that of AS160. In the present study, we show that this is not the case. By reducing the level of ectopic TBC1D1, we have obtained evidence that phosphorylation of TBC1D1 on several likely Akt sites relieves the inhibitory effect on GLUT4 translocation. In addition, we have examined the effect of a variant of TBC1D1 genetically associated with obesity on GLUT4 translocation and determined the relative levels of TBC1D1 in muscle biopsies from healthy and type 2 diabetic individuals.
EXPERIMENTAL PROCEDURES
Plasmids and Antibodies
The cDNA for the long splice variant of mouse TBC1D1 (gi 28972622) was obtained from the Kazusa Foundation and inserted into the NotI and XbaI sites of p3xFLAG-CMV-7.1 (Sigma). Comparison of the sequence of this cDNA with sequences for mouse TBC1D1 in the mRNA and genomic data bases revealed that it has a mutation in which Glu at position 174 has been replaced by Lys. Lys-174 was mutated to Glu using the QuikChange® II XL site-directed mutagenesis kit (Stratagene, Cedar Creek, TX) to obtain plasmid encoding wild-type TBC1D1. A number of mutations in wild-type TBC1D1 were generated through use of the QuikChange kit. In each case, the complete cDNA for TBC1D1 was sequenced, because the mutagenesis procedure occasionally introduced a base change at sites other than the desired one. An affinity-purified antibody against mouse TBC1D1 was the previously described PG antibody (5). The myogenin antibody (number 21835) was from GeneTex (Irvine, CA); the antibody against GAPDH (number 25778) was from Santa Cruz Biotechnology (Santa Cruz, CA); and anti-FLAG conjugated to horseradish peroxidase (number A8592) was from Sigma.
Cell Culture, Immunoprecipitation, Mass Spectrometry, and Immunoblotting
3T3-L1 fibroblasts (CL-173, ATCC, Manassas, VA) and C2C12 myoblasts (CRL-1772, ATCC) were maintained and differentiated into adipocytes and myotubes, respectively, according to previously described procedures (9, 10).
For identification of phosphorylation sites, TBC1D1 was isolated from C2C12 myotubes on day 4 of differentiation. Ten-cm plates of cells were serum-starved for 2 h and then left untreated or treated with 160 nm insulin for 15 min or 1 mm AICAR for 45 min. Each plate was washed with phosphate-buffered saline, scraped into 0.6 ml of SDS lysis buffer (100 mm Hepes, pH 7.5, 300 mm NaCl, 1 mm EDTA, 40 mg/ml SDS, and 10 mm dithiothreitol, with protease inhibitors 10 μm leupeptin, 10 μm EP475, 1 μm pepstatin, and 10 μg/ml aprotinin), and held at 100 °C for 5 min. After cooling, the sulfhydryl groups were capped by adding 15 mm N-ethylmaleimide. The SDS lysate from three plates was diluted with 9.6 ml 2.6% nonionic detergent nonaethyleneglycol dodecyl ether, 150 mm NaCl, 50 mm Hepes, pH 7.5, and centrifuged at 18,000 × g for 30 min. The supernatant was incubated with 15 μg antibody against TBC1D1 for 4 h at 4 °C, and the immune complexes were collected by mixing with 40 μl protein A-Sepharose beads for 12 h. The immune complexes were released from the beads with reducing SDS sample buffer, and the proteins were separated by SDS-PAGE and stained with Coomassie Blue. By visual comparison with known amounts of protein standards, ∼500 ng of TBC1D1 were isolated from three 10-cm plates.
For mass spectrometric analysis, the gel bands containing TBC1D1 were split into thirds and digested with trypsin, chymotrypsin, and elastase to maximize coverage. Peptide sequence analysis of each digestion mixture was performed by microcapillary, reversed-phase, high-performance liquid chromatography, coupled with nanospray tandem mass spectrometry on an LTQ-Orbitrap mass spectrometer (ThermoFisher Scientific, San Jose, CA). Preliminary sequencing of peptides was facilitated with the SEQUEST algorithm with a 30 ppm mass tolerance against the MGI mouse subset of Uniprot Knowledgebase, concatenated to a reverse decoy data base. Peptides were accepted with a mass error <2.5 ppm and score thresholds to attain an estimated false discovery rate of 1%. Data sets for all digest results were combined in silico, culled of minor contaminating keratin or autolytic peptide spectra, and re-searched with SEQUEST against the TBC1D1 sequence without taking into account enzyme specificity and with differential modifications of phosphorylated tyrosine, serine, and threonine residues. The discovery of phosphopeptides and subsequent manual confirmation of their spectra were facilitated in-house versions of programs MuQuest, GraphMod, and FuzzyIons (Proteomics Browser Suite, ThermoFisher Scientific).
For immunoblot analysis, SDS samples of C2C12 and 3T3-L1 adipocytes were prepared by washing plates with phosphate-buffered saline and scraping the cells into SDS sample buffer with 10 mm dithiothreitol and protease inhibitors, and holding the samples at 100 °C for 5 min. The concentration of protein in the samples was determined by the precipitating Lowry assay (11). Proteins were resolved by SDS-PAGE, transferred to polyvinylidene fluoride membrane (Millipore, Bedford, MA), and probed using antibodies to the protein of interest followed by horseradish peroxidase-conjugated secondary antibody. Protein bands were detected using SuperSignal West Pico ECL (Thermo Scientific, Rockford, IL) and Kodak BioMax XAR film (Carestream Health, Rochester, NY).
GLUT4 Translocation Assay
The assay for the measurement of GLUT4 at the cell surface has been described in detail previously (12). Briefly, 3T3-L1 adipocytes on day 4 of differentiation were co-transfected with 75 μg of HA-GLUT4-GFP plasmid together with 10 μg of wild-type or mutant TBC1D1 plasmid plus 90 μg p3xFLAG-CMV-7.1 control plasmid, unless stated otherwise. On the next day, cells were serum-starved for 2 h and then left untreated or treated with 160 nm insulin for 30 min. In some experiments, cells were treated with 1 mm AICAR for 70 min or with the combination of AICAR for 70 min and insulin for the final 30 min. Cells were then analyzed for HA-GLUT4-GFP at the cell surface. The HA-GLUT4-GFP is a reporter form of GLUT4, in which the HA tag is located in the amino-terminal cell surface loop, and the GFP is located at the intracellular carboxyl terminus. HA-GLUT4-GFP at the cell surface was labeled with anti-HA followed by APC-conjugated secondary antibody. The adipocytes were then analyzed by flow cytometry. The ratio of APC to GFP fluorescence intensity was measured for ∼2,000 GFP-positive cells under each condition. The mean APC/GFP ratio was corrected for nonspecific binding of the APC-conjugated secondary antibody by subtracting the mean APC/GFP ratio for GFP-positive adipocytes labeled only with the secondary antibody. This corrected APC/GFP ratio is a measure of the relative amount of HA-GLUT4-GFP at the cell surface, normalized to the expression level of GFP in each cell. To compare replicate experiments done on different days, each experiment included a vector control, and the values for the amount of HA-GLUT4-GFP at the cell surface were normalized to the value for the vector control in the insulin state. By immunofluorescence of permeabilized cells, as described in Ref. 12, we determined that 97% of the cells expressing HA-GLUT4-GFP in our assay also expressed the FLAG-tagged TBC1D1.
Cell Surface Transferrin Receptor
This assay has been described in detail previously (12). Briefly, adipocytes were co-transfected with HA-GLUT4-GFP and TBC1D1 plasmids as described above for the cell surface GLUT4 assay. On the next day, cells were serum-starved and then treated with 160 nm insulin for 15 min. Endogenous transferrin receptor at the cell surface was then labeled with antibody against the extracellular domain of the receptor, followed by the APC-conjugated secondary antibody. The mean APC fluorescence intensity of ∼2,000 GFP-positive cells was obtained using flow cytometry. This value was corrected for nonspecific binding of the secondary antibody by subtracting the mean fluorescence intensity of GFP-positive cells labeled only with the secondary antibody. The corrected value is a measure of the relative amount of endogenous transferrin receptor at the cell surface in the GFP-positive cells. In this assay, GFP serves as a marker for cells that are co-transfected and so also express TBC1D1.
Expression of Human TBC1D1
Biopsies from the vastus lateralis portion of the quadriceps femoris muscle were obtained under local anesthesia (5 mg/ml mepivacaine chloride) from healthy control subjects and type 2 diabetic patients. The study protocol was approved by the regional human ethical committee at Karolinska Institutet, and informed consent was received from all subjects before participation. The clinical characteristics of the subjects are given in supplemental Table 1. Muscle samples were homogenized in ice-cold homogenization buffer (50 mm Hepes, pH 7.6, 150 mm NaCl, 1% Triton X-100, 1 mm Na3VO4, 10 mm NaF, 30 mm NaP2O7, 10% glycerol, 1 mm benzamidine, 1 mm dithiothreitol, 10 μg/ml leupeptin, 1 mm phenylmethanesulfonyl fluoride, and 1 μm microstatin) and were centrifuged at 12,000 × g for 15 min at 4 °C. The protein concentration of each supernatant was determined using a Bio-Rad protein assay. Samples were separated by SDS-PAGE and subjected to immunoblot analysis for TBC1D1 or GAPDH. Bands were quantified by densitometry.
Statistics
Statistical analyses were performed using the unpaired, two-tailed t test.
RESULTS
TBC1D1 Expression in C2C12 Myotubes
Previous studies have shown that TBC1D1 is strongly expressed in skeletal muscles of the mouse (5, 6). To find a cell system in which to examine TBC1D1, we assessed the expression of TBC1D1 upon differentiation of the mouse C2C12 line from myoblasts into myotubes. In this line, fusion of the myoblasts into myotubes is complete on approximately day 4 after switching to the differentiation medium. TBC1D1 increased ∼8-fold on day 2 of differentiation and remained at this level until day 8 (Fig. 1). A similar increase was seen for myogenin, a marker for differentiation (13).
FIGURE 1.
TBC1D1 expression during C2C12 differentiation. SDS samples of C2C12 myoblasts (day 0) and myotubes at different stages of differentiation (days 2, 4, 6, and 8) were immunoblotted for TBC1D1 (TBC) and myogenin (Myo). The 1× load of protein was 90 μg.
Identification of Phosphorylation Sites on TBC1D1
The substantial expression of TBC1D1 in C2C12 myotubes allowed the use of these cells to identify sites on TBC1D1 that are phosphorylated in response to insulin, as well as to an activator of the protein kinase AMPK. Myotubes on day 4 of differentiation were left untreated or treated with insulin or the AMPK-activating agent AICAR. TBC1D1 was isolated by immunoprecipitation and SDS-PAGE and digested with proteases, and phosphopeptides were characterized by mass spectrometry. Table 1 summarizes the results. A number of the sites are in the motifs characteristic for phosphorylation by the Akt kinase and/or by AMPK. Several of the sites have been identified previously. Taylor et al. (6) reported that TBC1D1 isolated from mouse tibialis anterior muscle treated with insulin or AICAR showed phosphorylation on Ser- or Thr-231, -499, -590, -621, -660, and -700. Chen et al. (7) found that TBC1D1 isolated from cultured L6 myotubes showed phosphorylation on Thr-590 in response to insulin and Ser-231 in response to AICAR. We have reported that human TBC1D1 expressed in 3T3-L1 adipocytes is phosphorylated on the sites corresponding to Thr-590 in response to insulin and to Ser-231 in the basal state as well as in response to insulin and AICAR (4, 5). A limitation of the data in Table 1 is that peptide coverage of TBC1D1 was incomplete (see the legend to Table 1), and quantification of the extent of phosphorylation on the sites was not performed. Nevertheless, the results in Table 1 indicate that insulin treatment of the C2C12 myotubes led to phosphorylation of Ser-489, Thr-499, and Ser-501 (Table 1), and the knowledge of these sites served as a basis for identifying sites that control the activity of TBC1D1 (see below).
TABLE 1.
TBC1D1 phosphorylation sites identified by mass spectrometry
TBC1D1 was isolated from basal, insulin-, or AICAR-treated C2C12 myotubes, and phosphorylation sites were identified by mass spectrometry as described under “Experimental Procedures.” Each phosphorylation site is listed under the condition in which it was found, together with whether the site is in a partial (p) or full Akt or AMPK motif. Where two or three adjacent sites are listed, the specific residue phosphorylated among the several was not conclusively identified. In addition, an asterisk denotes the most likely phosphorylated site, albeit not conclusively identified, within a confirmed phosphopeptide. Peptide coverage of TBC1D1 under basal, insulin-, and AICAR-stimulated conditions was 60, 68, and 76% by amino acid count, respectively. The motifs for Akt and AMPK were taken as RXRXX(S/T) and Φ(β, X)XX(S/T)XXXΦ, where X, Φ, and β are any, a hydrophobic, and a basic amino acid, respectively (26). Partial motifs were taken as ones that lacked one of the specificity elements.
| Site | Basal | Insulin | AICAR | Site motif |
|---|---|---|---|---|
| Ser-145/Ser-146 | + | |||
| Ser-229 | + | pAkt | ||
| Ser-231 | + | AMPK | ||
| Ser-489 | + | * | Akt | |
| Ser-497 | * | * | ||
| Thr-499 | + | * | pAkt | |
| Ser-501 | + | + | pAkt | |
| Ser-519 | * | |||
| Ser-521 | + | + | ||
| Ser-559/Ser-560 | + | AMPK(559) | ||
| Ser-565 | * | |||
| Thr-590 | + | Akt, pAMPK | ||
| Ser-608 | * | + | ||
| Ser-621 | + | + | + | pAkt, pAMPK |
| Ser-660 | + | + | + | pAMPK |
| Ser-661 | * | * | ||
| Ser-697/Ser-698/Ser-699 | + | + | pAkt(697), pAMPK(697) | |
| Ser-700 | + | + | + | AMPK |
| Ser-1028 | * | |||
| Tyr-1039 | * | * | * | |
| Thr-1218 | + | + | + |
Regulation of Insulin-stimulated GLUT4 Translocation by TBC1D1 Phosphorylation
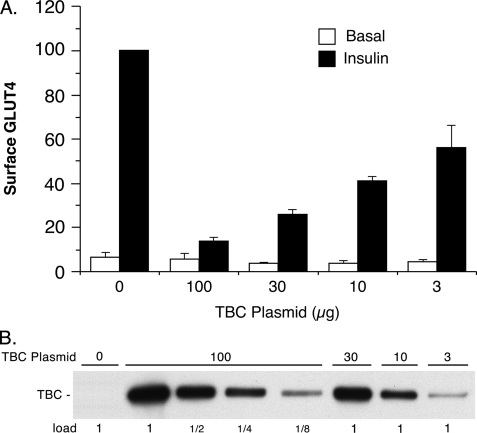
Previously, we examined the effect of overexpression of an alternatively spliced, short version of TBC1D1 on insulin-stimulated GLUT4 translocation in 3T3-L1 adipocytes (4, 5). This short version of TBC1D1 differs from that found in muscle, in that the former lacks the exon encoding amino acids 631–724 (4–6). In those studies, we found that under our assay conditions, the short version of TBC1D1 almost completely inhibited insulin-stimulated GLUT4 translocation (4, 5). Similarly, the long version of TBC1D1, which was used here, almost completely inhibited insulin-stimulated GLUT4 translocation under our previous conditions, in which 100 μg of the TBC1D1 plasmid was co-transfected into 3T3-L1 adipocytes with 75 μg of the reporter HA-GLUT4-GFP plasmid (Fig. 2). Reduction in the amount of TBC1D1 plasmid used in the transfection resulted in lower expression of TBC1D1 protein (Fig. 2B) and correspondingly less inhibition of GLUT4 translocation (Fig. 2A). With 10 μg TBC1D1 plasmid, TBC1D1 expression was one-fourth that with 100 μg plasmid, and GLUT4 translocation was only inhibited by about 50%.
FIGURE 2.
Effect of TBC1D1 expression level on GLUT4 translocation. A, relative amounts of surface GLUT4 in basal and insulin-stimulated 3T3-L1 adipocytes transfected with HA-GLUT4-GFP plasmid, together with varying amounts of wild-type TBC1D1 (TBC) plasmid and control vector plasmid, such that the total of the two was 100 μg of plasmid. Values are the mean ± S.E. for each condition from two (100, 30, and 3 μg TBC1D1 plasmid) or three (0 and 10 μg of TBC1D1 plasmid) replicate experiments. B, SDS lysates of cells in A were immunoblotted for TBC1D1 with anti-FLAG antibody. The 1× load was 10 μg.
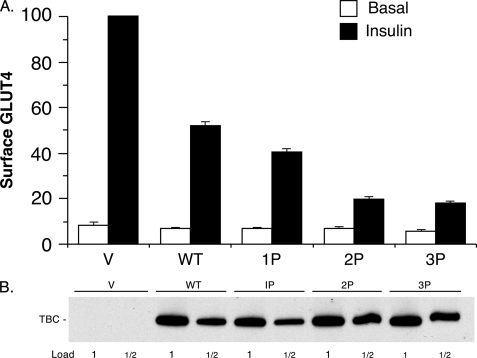
This reduced inhibition of GLUT4 translocation with less TBC1D1 plasmid allowed examination for the first time of whether phosphorylation of TBC1D1 regulates its inhibition of insulin-stimulated GLUT4 translocation. To do so, we determined the effect of replacing with alanine the known sites of insulin-stimulated phosphorylation. The T590A mutant (designated 1P mutant) caused a reduction in cell surface GLUT4 in the insulin state compared with the wild-type TBC1D1 (Fig. 3A). Introduction of combined T499A and S501A mutations into the 1P mutant (designated the 2P mutant) caused a further substantial reduction in cell surface GLUT4 (Fig. 3A). Finally, introduction of the S489A mutation into the 2P mutant (designated 3P mutant) caused only a very slight further reduction in cell surface GLUT4. These results thus indicate that insulin-stimulated phosphorylation of Thr-590 and Thr-499 and/or Ser-501 reduce the inhibitory effect of TBC1D1 on GLUT4 translocation. The insulin-stimulated increase in GLUT4 at the cell surface in the presence of the 3P mutant was only 28% of the increase that occurred in the presence of wild-type TBC1D1. In these experiments, the level of expression of the wild-type and mutant forms of TBC1D1 was the same (Fig. 3B). This finding excludes higher expression of the mutants as an explanation for the results.
FIGURE 3.
Inhibition of GLUT4 translocation by TBC1D1 phosphorylation mutants. A, relative amounts of surface GLUT4 in basal and insulin-stimulated 3T3-L1 adipocytes transfected with HA-GLUT4-GFP plasmid, together with the control vector plasmid alone (V) or with the plasmids for wild-type (WT) and phosphorylation site mutants (1P, 2P, and 3P) of TBC1D1 (TBC). The values are the mean ± S.E. from two replicate experiments. Figs. 4A and 5A show six additional experiments in which TBC1D1 wild-type and 3P mutant were among those examined. The lower amount of GLUT4 at the cell surface in the insulin state for the 3P mutant compared with wild-type TBC1D1 for these eight experiments was significant, with p < 0.05. B, SDS lysates of cells in A were immunoblotted for TBC1D1 with anti-FLAG antibody. The 1× load was 10 μg. A representative immunoblot is shown.
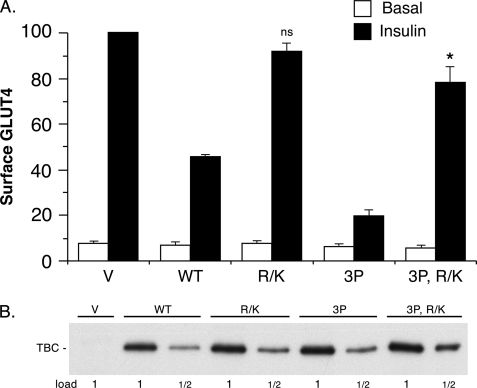
The GAP domain of TBC1D1 contains an Arg residue that is critical for its activity. Mutation of this residue to Lys completely inactivates the GAP activity (4). Previously, we found that the short form of TBC1D1 with the R941K mutation did not inhibit GLUT4 translocation (4). This result indicated that inhibition required the functional GAP domain. Here, we examined the effect of the same mutation in the long form of TBC1D1, as well as in the 3P mutant thereof. Both of these mutants largely, although not entirely, restored GLUT4 at the cell surface to the level seen with the vector control (Fig. 4A). This result indicates that inhibition by both the wild-type TBC1D1 and 3P mutant largely depends upon a functional GAP domain. Each of the mutants was equally expressed compared with the wild-type TBC1D1 (Fig. 4B).
FIGURE 4.
Effect of the TBC1D1 GAP activity on GLUT4 translocation. A, relative amounts of surface GLUT4 in basal and insulin-stimulated 3T3-L1 adipocytes transfected with HA-GLUT4-GFP plasmid, together with the control vector plasmid (V) alone or with the plasmids for wild-type TBC1D1 (WT), GAP-inactive TBC1D1 (R/K), the 3P mutant of TBC1D1, and the GAP-inactive mutant thereof (3P, R/K). Values are mean ± S.E. from three replicate experiments. ns, not statistically different from the value for vector insulin; *, p < 0.05 for comparison to the value for vector insulin. B, SDS lysates of cells in A were immunoblotted for TBC1D1 (TBC) with anti-FLAG antibody. The 1× load was 10 μg. A representative immunoblot is shown.
Effect of AMPK Activation on TBC1D1 Inhibition of GLUT4 Translocation
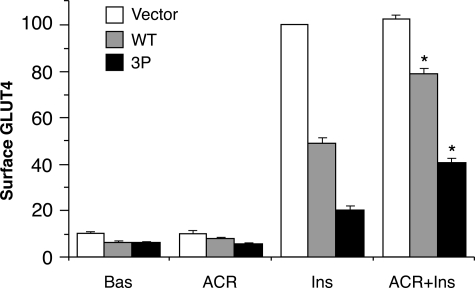
In a previous study, we reported that activation of AMPK with AICAR in 3T3-L1 adipocytes partially relieved the inhibition of insulin-stimulated GLUT4 translocation caused by the short version of TBC1D1 (5). In the present study, we used the same conditions, which led to maximal AMPK activation, to examine the effect of AMPK activation on inhibition by the long version of TBC1D1 and its 3P mutant. The combination of AICAR and insulin led to 1.6- and 2.0-fold increases in the amount of GLUT4 at the cell surface for the wild-type TBC1D1 and 3P mutant, respectively, compared with the increase with insulin alone (Fig. 5). As was the case in Figs. 3 and 4, in these experiments it was established by immunoblotting that the wild-type TBC1D1 and 3P mutant were equally expressed (data not shown).
FIGURE 5.
Reduction in TBC1D1 inhibition of GLUT4 translocation by AICAR. Relative amounts of surface GLUT4 in 3T3-L1 adipocytes transfected HA-GLUT4-GFP plasmid, together with the control vector plasmid alone or with the plasmids for wild-type TBC1D1 (WT) or the 3P mutant of TBC1D1. Cells were untreated (Bas) or treated with AICAR (ACR) or insulin (Ins) or both (ACR+Ins). Values are mean ± S.E. from three replicate experiments. *, p < 0.05 for comparison with insulin alone for the same plasmid.
Effect of TBC1D1 on Transferrin Receptor Translocation
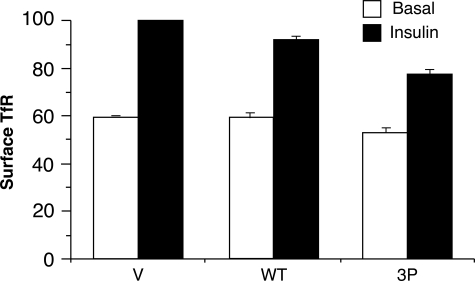
In 3T3-L1 adipocytes, the transferrin receptor undergoes continuous recycling between the endosomal system and the cell surface. Insulin treatment causes an ∼2-fold increase in transferrin receptor at the cell surface, mainly by stimulation of its rate of exocytosis (14). To determine whether TBC1D1 regulated the constitutive recycling system, we examined the effect of ectopic expression of wild-type TBC1D1 and its 3P mutant on the amount of endogenous transferrin receptor at the cell surface. As expected, in the vector control, insulin increased the amount of cell surface transferrin receptor 68 ± 1% (Fig. 6). Compared with the vector contol, cells expressing wild-type TBC1D1 showed the same amount of cell surface transferrin receptor in the basal state, but a trend toward less in the insulin-stimulated state, such that insulin caused an increase of 54 ± 9% (Fig. 6). Cells expressing the 3P mutant showed a modest reduction of cell surface transferrin receptor in both the basal and insulin-stimulated state, with the net result that insulin caused a 47 ± 3% increase (Fig. 6). Thus, relative to the vector control, the 3P mutant reduced the insulin-stimulated increase in cell surface transferrin receptor from 68% to 47% (p < 0.05), which constitutes a 31% reduction in the insulin stimulation. By contrast, the inhibitory effect of the 3P mutant on insulin-stimulated GLUT4 translocation was much more marked. The average insulin-stimulated increases in cell surface GLUT4 over the basal value were 1,160% for the vector control and 220% in the presence of the 3P mutant (data from Figs. 3A and 4A), and hence the 3P mutant caused an 81% reduction in GLUT4 translocation.
FIGURE 6.
Effect of TBC1D1 on cell surface transferrin receptor. Relative amounts of surface transferrin receptor (TfR) in basal and insulin-stimulated 3T3-L1 adipocytes transfected with the HA-GLUT4-GFP plasmid, together with the control vector plasmid (V) alone or with the plasmids for wild-type TBC1D1 (WT) or the 3P mutant thereof. Values are mean ± S.E. from three replicate experiments.
Characterization of the R125W Variant of TBC1D1
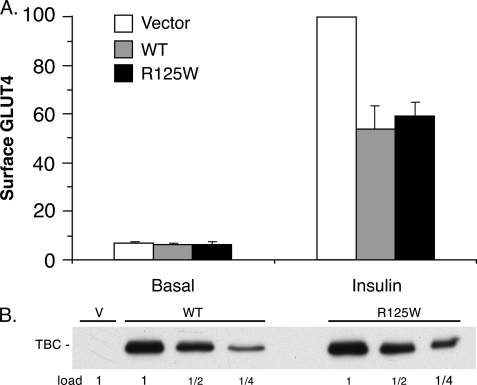
Genetic screening has linked a variant of TBC1D1 in which Arg-125 is replaced by Trp with a predisposition to familial obesity in females (15, 16). The system developed in this study, where wild-type TBC1D1 caused a 50% inhibition of insulin-stimulated GLUT4 translocation, enabled an analysis of the effect of the R125W mutation on this activity. The R125W mutant of TBC1D1 was equally inhibitory to GLUT4 translocation as the wild-type protein (Fig. 7A). Both forms of the protein were expressed at the same level (Fig. 7B).
FIGURE 7.
Effect of TBC1d1 R125W on GLUT4 translocation. A, relative amounts of surface GLUT4 in basal and insulin-stimulated 3T3-L1 adipocytes transfected with the HA-GLUT4-GFP plasmid, together with the control vector plasmid (V) alone or with the plasmids for wild-type TBC1D1 (WT) or the R125W mutant thereof. Values are mean ± S.E. from three replicate experiments. B, SDS lysates of cells in A were immunoblotted for TBC1D1 (TBC) with anti-FLAG antibody. The 1× load was 10 μg. A representative immunoblot is shown.
TBC1D1 Expression in Type 2 Diabetic Humans
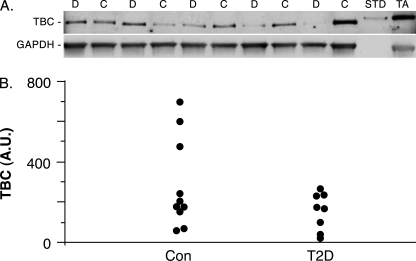
In type 2 diabetes, the level of GLUT4 in skeletal muscle is unchanged, but insulin is less effective at eliciting GLUT4 translocation (17). Because increased expression of TBC1D1 inhibited GLUT4 translocation (Fig. 2), it seemed possible that TBC1D1 might be overexpressed in type 2 diabetes, with such overexpression contributing to the inhibition of insulin-stimulated GLUT4 translocation. To test this possibility, we determined the expression levels of TBC1D1 in vastus lateralis muscle biopsies from control and type 2 diabetic humans by immunoblot analysis (Fig. 8A). The intensity of the TBC1D1 band in each sample was normalized to that of GAPDH in the same sample (Fig. 8A), which was used as a loading control. The individual values for the ten control and eight type 2 diabetic subjects are shown in Fig. 8B. There was considerable variation in the amount of TBC1D1 between individuals. The average value for the control samples (280 arbitrary units) was higher, but not significantly different from that of the type 2 diabetic samples (150 arbitrary units, p = 0.14). Consequently, increased expression of TBC1D1 does not occur in type 2 diabetes and thus cannot contribute to the reduced insulin-stimulated GLUT4 translocation.
FIGURE 8.
TBC1D1 expression in control and diabetic human skeletal muscle. A, representative immunoblot of SDS lysates of vastus lateralis biopsies from control (C) and type 2 diabetic (D) subjects, immunoblotted for TBC1D1 or GAPDH as a loading control. Each lane was loaded with 75 μg protein. One ng of recombinant mouse FLAG-tagged TBC1D1 isolated from transfected human embryonic kidney 293 cells (STD) and 50 μg of mouse tibialis anterior muscle protein (TA) were included as positive controls. B, dot plot of individual values for control (Con) and type 2 diabetic (T2D) subjects expressed as arbitrary units (A.U.) for the TBC1D1 signal normalized to the GAPDH signal.
DISCUSSION
Although a number of studies have shown that TBC1D1 undergoes phosphorylation on Akt sites in response to insulin treatment (4–7, 18), there has been no direct evidence on how such phosphorylation affects the function of TBC1D1. The present study provides the first evidence that insulin-elicited phosphorylation of TBC1D1 relieves its inhibition of insulin-stimulated GLUT4 translocation. The basis for this conclusion is that the mutant of TBC1D1 in which several likely Akt phosphorylation sites were removed was much more inhibitory to insulin-stimulated GLUT4 translocation than the wild-type TBC1D1. This finding supports the hypothesis that insulin-stimulated phosphorylation of TBC1D1 suppresses its Rab GAP activity and thereby elevates the GTP form of a Rab(s), leading to GLUT4 translocation. Hence, the regulation of TBC1D1 resembles that proposed for its paralog, AS160 (see Introduction). In the latter case, a key finding in support of the hypothesis is that a mutant of AS160 in which four potential Akt sites are mutated to Ala (known as the AS160 4P mutant) markedly inhibits insulin-stimulated GLUT4 translocation in 3T3-L1 adipocytes.
The sites found here to regulate the activity of TBC1D1 were Thr-499/Ser-501 and Thr-590. The full motif for Akt phosphorylation is RXRXX(S/T) (19). The Thr-499/Ser-501 sites are in the partial Akt motif RSLT*ES*L, where either the Thr or the Ser marked with an asterisk can be phosphorylated by Akt, and in fact, both sites were found. The Thr-590 site is located in sequence RRRANT*L, a full Akt motif. It is interesting to note that these two Akt motifs are the only ones that are well conserved between TBC1D1 and AS160 (4). In mouse AS160, the corresponding sites are Thr-575/Ser-577 and Thr-649, in the sequences RSLT*SS*L and RRRAHT*F, respectively. Moreover, sequential mutation of these sites in AS160 to Ala also sequentially increases the inhibition of insulin-stimulated GLUT4 translocation (8). In the future, it will be of interest to determine whether phosphorylation on each site reduces the Rab GAP activity of TBC1D1 and AS160. Unfortunately, to date, it has not been possible to purify full-length TBC1D1 or AS160 that is active as a GAP (data not shown) (20).
In skeletal muscle, both contraction and AICAR treatment activate AMPK and cause GLUT4 translocation to the cell surface. Considerable evidence indicates that the GLUT4 translocation is entirely downstream of AMPK in the case of AICAR, but only partially so in the case of contraction (21). Several studies show that AICAR stimulates phosphorylation of TBC1D1 on potential AMPK sites (6, 7). Previously we reported that AICAR treatment partially relieved the inhibition of insulin-stimulated GLUT4 translocation caused by the short version of TBC1D1 in 3T3-L1 adipocytes (5), and the results here show that the same is true for the long version of TBC1D1 found in muscle. A reasonable hypothesis for this effect is that, similarly to what is proposed for the insulin effect through Akt, phosphorylation of TBC1D1 by AMPK suppresses its GAP activity. However, in contrast to the insulin effect, we have not yet been able to identify potential AMPK sites which when mutated to Ala block the relief of inhibition. In our previous study, mutation of the sites corresponding to Thr 590 and Ser 231 (see Table 1) did not reduce the AICAR effect significantly (5); and in this study the TBC1D1 3P mutant, which contains the T590A mutation, responded to AICAR slightly better than wild-type TBC1D1. Moreover, we have also found that the AICAR enhancement of insulin-stimulated GLUT4 translocation occurred with a mutant of TBC1D1 in which two other potential AMPK sites, Ser-559 and -621 (see Table 1), were mutated to Ala (data not shown). The other known potential AMPK sites (Ser-660, -697, and -700 (see Table 1)) are located within the variable exon and because the short version of TBC1D1 lacks these sites but responds to AICAR (5), these sites do not seem likely candidates to control the AICAR effect. A recent study reports that in skeletal muscle AICAR increases cell-surface GLUT4 by inhibiting GLUT4 endocytosis, whereas insulin increases it by stimulating GLUT4 exocytosis (22). It seems less likely that this mechanism for AICAR operates in 3T3-L1 adipocytes because in the absence of TBC1D1 AICAR treatment had no effect on the amount of GLUT4 at the cell surface in either the basal or insulin state (Fig. 5) (5). Nevertheless, the possibility that AICAR-stimulated phosphorylation of TBC1D1 is not the basis for its partial relief of TBC1D1 inhibition of insulin-stimulated GLUT4 translocation in 3T3-L1 adipocytes has to be considered.
The finding that the TBC1D1 3P mutant was much more inhibitory to GLUT4 translocation than to transferrin receptor translocation indicates that TBC1D1 acts largely, if not entirely, in the trafficking pathway specific to the exocytosis from the specialized GLUT4 vesicles (1, 2). A similar result was previously obtained with the AS160 4P mutant in 3T3-L1 adipocytes (23). The AS160 4P mutant caused a slight, but not statistically significant, reduction of transferrin receptors at the cell surface in both the basal and insulin states.
As described under “Results,” the R125W variant of TBC1D1 is genetically associated with female obesity within certain families. The failure to find an effect of this variant on GLUT4 translocation in the 3T3-L1 system may be due to the cellular context of the assay. The genetic evidence suggests that the R125W variant acts with the variant of an unidentified protein to cause its effect (15, 16). The link between TBC1D1 and obesity has been strengthened by the recent discovery that mice homozygous for a truncation mutation in the TBC1D1 gene that disrupts the GAP domain are protected against diet-induced obesity (24). This study also showed that knockdown of TBC1D1 in C2C12 myotubes increased palmitate uptake and oxidation in the basal state. Insulin, AICAR, and contraction cause the translocation of fatty acid transporters to the plasma membrane in muscle (25). Hence, a speculative explanation for these findings is the following. In muscle phosphorylation of TBC1D1 in response to insulin, AICAR, or contraction triggers the translocation of the fatty acid transporters as well as GLUT4. In the correct context, the R125W mutant variant interferes with this effect and so reduces fatty acid uptake and oxidation by muscle, whereas in the mouse strain with the truncation mutation of TBC1D1 there is no TBC1D1 GAP activity. As a consequence, more fatty acid transporters are at the plasma membrane in the absence of these stimuli, and so fatty acid uptake and oxidation by muscle is enhanced.
In conclusion, this study shows that insulin-stimulated phosphorylation of TBC1D1 is required for GLUT4 translocation. The same has been shown for phosphorylation of AS160. Both proteins are found in skeletal muscle (5, 6). Both undergo phosphorylation in response to insulin in skeletal muscle (6, 18). Hence, in the future, it will be of considerable interest to determine whether TBC1D1 and AS160 have redundant or complementary roles in insulin-stimulated GLUT4 translocation in skeletal muscle.
Supplementary Material
This work was supported, in whole or in part, by National Institutes of Health Grants DK25336 and DK42816 (to G. E. L.). This work was also supported by grants from the European Research Council and the Swedish Research Council (to J. R. Z.).

The on-line version of this article (available at http://www.jbc.org) contains supplemental Table 1.
- GAP
- GTPase-activating protein
- AICAR
- 5-aminoimidazole-4-carboxamide 1-β-d-ribofuranoside
- HA
- hemagglutinin
- GFP
- green fluorescent protein
- GAPDH
- glyceraldehyde-3-phosphate dehydrogenase
- APC
- allophycocyanin.
REFERENCES
- 1.Huang S., Czech M. P. (2007) Cell. Metab. 5, 237–252 [DOI] [PubMed] [Google Scholar]
- 2.Zaid H., Antonescu C. N., Randhawa V. K., Klip A. (2008) Biochem. J. 413, 201–215 [DOI] [PubMed] [Google Scholar]
- 3.Sakamoto K., Holman G. D. (2008) Am. J. Physiol. Endocrinol. Metab. 295, E29–E37 [DOI] [PMC free article] [PubMed] [Google Scholar]
- 4.Roach W. G., Chavez J. A., Mîinea C. P., Lienhard G. E. (2007) Biochem. J. 403, 353–358 [DOI] [PMC free article] [PubMed] [Google Scholar]
- 5.Chavez J. A., Roach W. G., Keller S. R., Lane W. S., Lienhard G. E. (2008) J. Biol. Chem. 283, 9187–9195 [DOI] [PMC free article] [PubMed] [Google Scholar]
- 6.Taylor E. B., An D., Kramer H. F., Yu H., Fujii N. L., Roeckl K. S., Bowles N., Hirshman M. F., Xie J., Feener E. P., Goodyear L. J. (2008) J. Biol. Chem. 283, 9787–9796 [DOI] [PMC free article] [PubMed] [Google Scholar]
- 7.Chen S., Murphy J., Toth R., Campbell D. G., Morrice N. A., Mackintosh C. (2008) Biochem. J. 409, 449–459 [DOI] [PubMed] [Google Scholar]
- 8.Sano H., Kane S., Sano E., Mîinea C. P., Asara J. M., Lane W. S., Garner C. W., Lienhard G. E. (2003) J. Biol. Chem. 278, 14599–14602 [DOI] [PubMed] [Google Scholar]
- 9.Frost S. C., Lane M. D. (1985) J. Biol. Chem. 260, 2646–2652 [PubMed] [Google Scholar]
- 10.Chavez J. A., Knotts T. A., Wang L. P., Li G., Dobrowsky R. T., Florant G. L., Summers S. A. (2003) J. Biol. Chem. 278, 10297–10303 [DOI] [PubMed] [Google Scholar]
- 11.Peterson G. L. (1977) Anal. Biochem. 83, 346–356 [DOI] [PubMed] [Google Scholar]
- 12.Lyons P. D., Peck G. R., Kettenbach A. N., Gerber S. A., Roudaia L., Lienhard G. E. (2009) Biosci. Rep. 29, 229–235 [DOI] [PMC free article] [PubMed] [Google Scholar]
- 13.Ariga M., Nedachi T., Katagiri H., Kanzaki M. (2008) J. Biol. Chem. 283, 10208–10220 [DOI] [PubMed] [Google Scholar]
- 14.Tanner L. I., Lienhard G. E. (1987) J. Biol. Chem. 262, 8975–8980 [PubMed] [Google Scholar]
- 15.Stone S., Abkevich V., Russell D. L., Riley R., Timms K., Tran T., Trem D., Frank D., Jammulapati S., Neff C. D., Iliev D., Gress R., He G., Frech G. C., Adams T. D., Skolnick M. H., Lanchbury J. S., Gutin A., Hunt S. C., Shattuck D. (2006) Hum. Mol. Genet. 15, 2709–2720 [DOI] [PubMed] [Google Scholar]
- 16.Meyre D., Farge M., Lecoeur C., Proenca C., Durand E., Allegaert F., Tichet J., Marre M., Balkau B., Weill J., Delplanque J., Froguel P. (2008) Hum. Mol. Genet. 17, 1798–1802 [DOI] [PubMed] [Google Scholar]
- 17.Ryder J. W., Yang J., Galuska D., Rincón J., Björnholm M., Krook A., Lund S., Pedersen O., Wallberg-Henriksson H., Zierath J. R., Holman G. D. (2000) Diabetes 49, 647–654 [DOI] [PubMed] [Google Scholar]
- 18.Funai K., Cartee G. D. (2009) Diabetes 58, 1096–1104 [DOI] [PMC free article] [PubMed] [Google Scholar]
- 19.Obata T., Yaffe M. B., Leparc G. G., Piro E. T., Maegawa H., Kashiwagi A., Kikkawa R., Cantley L. C. (2000) J. Biol. Chem. 275, 36108–36115 [DOI] [PubMed] [Google Scholar]
- 20.Mîinea C. P., Sano H., Kane S., Sano E., Fukuda M., Peränen J., Lane W. S., Lienhard G. E. (2005) Biochem. J. 391, 87–93 [DOI] [PMC free article] [PubMed] [Google Scholar]
- 21.Fujii N., Jessen N., Goodyear L. J. (2006) Am. J. Physiol. Endocrinol. Metab. 291, E867–E877 [DOI] [PubMed] [Google Scholar]
- 22.Karlsson H. K., Chibalin A. V., Koistinen H. A., Yang J., Koumanov F., Wallberg-Henriksson H., Zierath J. R., Holman G. D. (2009) Diabetes 58, 847–854 [DOI] [PMC free article] [PubMed] [Google Scholar]
- 23.Zeigerer A., McBrayer M. K., McGraw T. E. (2004) Mol. Biol. Cell 15, 4406–4415 [DOI] [PMC free article] [PubMed] [Google Scholar]
- 24.Chadt A., Leicht K., Deshmukh A., Jiang L. Q., Scherneck S., Bernhardt U., Dreja T., Vogel H., Schmolz K., Kluge R., Zierath J. R., Hultschig C., Hoeben R. C., Schürmann A., Joost H. G., Al-Hasani H. (2008) Nat. Genet. 40, 1354–1359 [DOI] [PubMed] [Google Scholar]
- 25.Nickerson J. G., Momken I., Benton C. R., Lally J., Holloway G. P., Han X. X., Glatz J. F., Chabowski A., Luiken J. J., Bonen A. (2007) Appl. Physiol. Nutr. Metab. 32, 865–873 [DOI] [PubMed] [Google Scholar]
- 26.Towler M. C., Hardie D. G. (2007) Circ. Res. 100, 328–341 [DOI] [PubMed] [Google Scholar]
Associated Data
This section collects any data citations, data availability statements, or supplementary materials included in this article.


