Abstract
The growth of most melanoma cells in vitro is inhibited by the tumor-promoting phorbol ester 12-O-tetradecanoylphorbol-13-acetate (TPA). In this study, the involvement of the signal transducer and activator of transcription 3 (STAT3) in the TPA-induced growth inhibition of melanoma cells was examined. The in vitro growth and DNA synthesis of five melanoma cell lines, whose STAT3 was activated (phosphorylated), was inhibited by TPA, whereas that of WM35 and WM39 cells, whose STAT3 activity was at negligible levels, was considerably slow and not affected by TPA. Blockade of STAT3 activity by small interfering RNAs suppressed the growth of WM1205Lu cells containing constitutively activated STAT3. Treatment of WM1205Lu cells with TPA decreased both the phosphorylated STAT3 and the DNA-binding activity of STAT3. Pretreatment of WM1205Lu cells with either a protein-tyrosine phosphatase inhibitor or a protein kinase C (PKC) inhibitor prevented the inhibitory effects of TPA on the level of phosphorylated STAT3. The five melanoma cell lines containing phosphorylated STAT3 commonly expressed PKCα, PKCδ, and PKCϵ. Introduction of the dominant negative mutant of one of these PKC isoforms into WM1205Lu cells inhibited the TPA-induced dephosphorylation of STAT3. A Src inhibitor attenuated the STAT3 phosphorylation in WM1205Lu cells. These results indicate that constitutively activated STAT3 is positively regulated by c-Src and negatively regulated by a PKC-activated tyrosine phosphatase(s) in melanoma cells. Because TPA did not affect c-Src activity, we conclude that the growth inhibitory effect of TPA on melanoma cells is mediated through inactivation of STAT3 by a PKC-activated tyrosine phosphatase(s).
Malignant melanoma is an aggressive, therapy-resistant malignancy of melanocytes, and the incidence of this tumor has been steadily increasing worldwide (1–4). Although there have been significant basic scientific advances in the understanding of the tumor biology of melanoma, there have been few significant therapeutic advances, and melanoma is one of the most lethal of all cancers even when a radical operation is performed (3, 4). Melanoma cells have a distinct biological feature in vitro: the growth of most of these cells is inhibited by the tumor-promoting phorbol ester 12-O-tetradecanoylphorbol-13-acetate (TPA)2 (5–8), and much attention has been directed at this feature of melanoma cells (9). However, the molecular mechanism of the TPA-induced growth inhibition of melanoma cells has not been fully elucidated.
The transcription factor signal transducer and activator of transcription 3 (STAT3) was originally identified as a DNA-binding protein that responds to stimulation by epidermal growth factor and interleukin-6 (IL-6) and has an important role in their signaling (10, 11). Similar to other STATs (12), STAT3 is normally activated in a regulated fashion when protein ligands bind cell surface STAT3 receptors. Then, STAT3 becomes activated by phosphorylation of a critical tyrosine residue (Tyr705) by Janus kinase (JAK) and dimerizes through reciprocal Src homology 2-phosphotyrosine interaction (13). The dimeric STAT3 translocates to the nucleus, where it binds to consensus STAT3 binding sequences within the promoter region of target genes and thereby activates their transcription (13–15). In normal cells, the duration of STAT3 activation is temporary, usually lasting from a few minutes to several hours (16). In these cells, STAT3 plays crucial roles in the development of various organs and in cell proliferation (17). In contrast, constitutive activation of STAT3 has been observed in many kinds of tumors (18–20), including melanomas (21, 22), and this persistently active STAT3 is thought to contribute to proliferation and oncogenesis by modulating the expression of a variety of genes (18, 19).
In this study, we investigated the possibility that STAT3 is involved in the TPA-induced growth inhibition of melanoma cells. We have found that TPA inhibits both the growth and the DNA synthesis, concomitant with a decrease in phosphorylated STAT3 levels, of melanoma cells containing constitutively activated STAT3 but not of cells lacking activated STAT3. Furthermore, we have revealed that the TPA-induced decrease in phosphorylated STAT3 levels is due to the dephosphorylation of STAT3 by a TPA-activated protein-tyrosine phosphatase (PTPase)(s).
EXPERIMENTAL PROCEDURES
Antibodies and Reagents
Antibodies against STAT3 phosphorylated on Tyr705 (pY-STAT3) and STAT3 phosphorylated on Ser727 (pS-STAT3) were obtained from Cell Signaling Technology (Beverly, MA). Anti-STAT3, anti-actin, anti-protein kinase C (PKC) α, and anti-PKCβII antibodies were from Santa Cruz Biotechnology (Santa Cruz, CA). Anti-PKCδ and anti-PKCϵ antibodies were purchased from Transduction Laboratories (Lexington, KY). Anti-c-Src and anti-phospho-c-Src antibodies were from Oncogene Research Products (Boston, MA) and Calbiochem, respectively. TPA and sodium orthovanadate were purchased from Sigma. Dimethyl sulfoxide (DMSO) was obtained from Nacalai Tesque (Kyoto, Japan). The PKC inhibitor GF109203X, the Src-specific inhibitor PP2 (4-amino-5- (4-chlorophemyl)-7-(t-butyl)pyrazolo[3,4-d]pyramidine) (23), PP3 (4-amino-7-phenyl pyrazolo[3,4-d] pyramidine) (23), an inactive analogue of PP2, and the JAK inhibitor I (24) were purchased from Calbiochem. IL-6 was from R&D Systems, Inc. (Minneapolis, MN).
Cells and Cell Culture
Seven human melanoma cell lines from primary (WM35, WM39, WM98-1, and WM115) and metastatic (WM164, WM239A, and WM1205Lu) lesions were kindly provided by Dr. Meenhard Herlyn (The Wistar Institute, Philadelphia, Pennsylvania). The detailed character of these melanoma cells has been described previously (25). The melanoma cells were cultured in Eagle's minimal essential medium (EMEM) containing 5% FCS (Biowest, Miami, FL), 100 units/ml penicillin, 100 mg/ml streptomycin, and 250 ng/ml Fungizone in a humidified atmosphere containing 5% CO2 at 37 °C. Where indicated, melanoma cells were infected with adenovirus vectors or transfected with siRNAs and then further cultured as described under each experiment.
Immunoblot Analysis
Immunoblot analysis for the determination of total STAT3, pY-STAT3, pS-STAT3, actin, PKCα, PKCβII, PKCδ, and PKCϵ was carried out essentially as described previously (26). Briefly, the cells were washed with phosphate-buffered saline and lysed in 20 mm Tris-HCl (pH 7.5) containing 1% Triton X-100, 150 mm NaCl, 1 mm EDTA, 1 mm EGTA, 10 mm β-mercaptoethanol, 10 mm NaF, 1 mm sodium orthovanadate, and 50 μg/ml phenylmethylsulfonyl fluoride and centrifuged at 17,000 × g for 10 min. Immunoblot analysis for the determination of total c-Src and phospho-c-Src was carried out essentially as described previously (27). Briefly, the cells were extracted with buffer containing 20 mm Tris-HCl (pH 7.5), 1% Triton X-100, 150 mm NaCl, 1 mm EDTA, 1 mm EGTA, 10 mm β-mercaptoethanol, 1 mm sodium orthovanadate, 10 μg/ml leupeptin, and 20 μm (p-amidinophenyl)methanesulfonyl fluoride. Immunoprecipitation was carried out with 200 μg of Triton X-100-solubilized proteins and 1.5 μg of anti-c-Src antibody overnight at 4 °C. The protein concentration of the supernatants was measured using Coomassie Plus protein assay reagent (Pierce). Equal amounts of protein extracts from the supernatants of samples for total STAT3, pY-STAT3, pS-STAT3, actin, PKCα, PKCβII, PKCδ, and PKCϵ, and the immunoprecipitates from samples for total c-Src and phospho-c-Src were separated by SDS-PAGE and transferred onto an Immobilon P membrane (Millipore, Bedford, MA). The membranes were blocked with phosphate-buffered saline containing 5% skim milk and 0.05% Tween 20 for 30 min at room temperature and then probed with each primary antibody. Peroxidase-conjugated anti-rabbit (for total STAT3, pY-STAT3, pS-STAT3, and actin), alkaline phosphatase-conjugated anti-mouse (for PKCα, PKCβII, PKCδ, PKCϵ, and total c-Src), and alkaline phosphatase-conjugated anti-rabbit (for phospho-c-Src) antibodies (Promega, Madison, WI) were employed as the secondary antibodies. The oxidative reaction by peroxidase was detected using Enhanced Chemiluminescence Western blotting detection reagents (GE Healthcare). The color reaction for alkaline phosphatase was carried out using 5-bromo-4-chloro-3-indoyl-phosphate and nitro blue tetrazolium (Promega) as substrates.
Thymidine Incorporation Assay
DNA synthesis was measured by incorporation of [3H]thymidine essentially as described previously (28). Cells were seeded in 24-well plates at a density of 1 × 10⁴ cells/well in EMEM containing 5% FCS and then cultured for 24 h. The cells were then cultured for a further 24 h with no additives or with the addition of 0.1% DMSO (control) or 100 nm TPA. Cells were pulsed with 1 mCi/well [3H]thymidine for the last 6 h of incubation, and the radioactivity incorporated into trichloroacetic acid-insoluble material was measured using a liquid scintillation counter.
Adenovirus Vectors
The recombinant adenovirus vectors encoding the dominant negative mutants of PKCα (DN-PKCα), PKCδ (DN-PKCδ), and PKCϵ (DN-PKCϵ), which have been described previously (29, 30), were kindly provided by Dr. Toshio Kuroki (Gifu University, Gifu, Japan) and were designated AxDN-PKCα, AxDN-PKCδ, and AxDN-PKCϵ, respectively. The adenovirus carrying the β-galactosidase gene (LacZ) from Escherichia coli, which has been described previously (31) and was kindly provided by Dr. Izumu Saito (University of Tokyo, Tokyo, Japan), was designated AxLacZ and used as a control virus. Infection with the adenoviruses did not affect cell viability at the doses used in this study.
STAT3 siRNA
STAT3 siRNA was performed with double-stranded siRNAs against STAT3 (si-1, 5′-AAC UUC AGA CCC GUC AAC AAA dTdT-3′ and 3′-dTdT GAA GUC UGG GCA GUU GUU U-5′; si-2, 5′-AAC AUC UGC CUA GAU CGG CUA dTdT-3′ and 3′-dTdT GUA GAC GGA UCU AGC CGA U-5′), and the negative control siRNA (TaKaRa, Shiga, Japan) was performed using TransIT-TKO transfection reagent (Mirus, Madison, WI) according to the manufacturer's instructions.
Measurement of the DNA-binding Activity of STAT3
The DNA-binding activity of STAT3 was determined using the TransAMTM STAT3 transcription factor assay kit (Active Motif, Carlsbad, CA) according to the manufacturer's instructions. TPA-, IL-6-, or mock-treated WM1205Lu cells were lysed in 20 mm HEPES (pH 7.5) containing 5 mm NaF, 10 mm Na2MoO4, 0.1 mm EDTA, and 0.5% Nonidet P-40 and clarified by centrifugation at 10,000 × g for 10 min at 4 °C. Five micrograms of extracted protein were used in the assay. The TransAMTM STAT3 transcription factor assay kit contains a 96-well plate with immobilized oligonucleotides encoding a STAT3 consensus site (5′-TTCCCGGAA-3′). The active form of STAT3 contained in the cell extract specifically binds to these oligonucleotides. The primary antibody used to detect STAT3 recognizes both the α and β isoforms of human STAT3. A horseradish peroxidase-conjugated secondary antibody provides a sensitive colorimetric readout that is quantified by a spectrophotometer at 450 nm with a reference wavelength of 655 nm.
Statistics
Differences between results were assessed for significance using Student's t test. p < 0.05 was considered to be statistically significant.
RESULTS
Relationship between TPA-induced Growth Inhibition and STAT3 Activity in Melanoma Cells
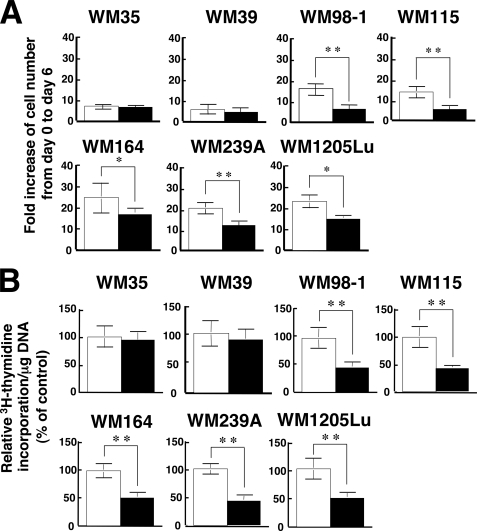
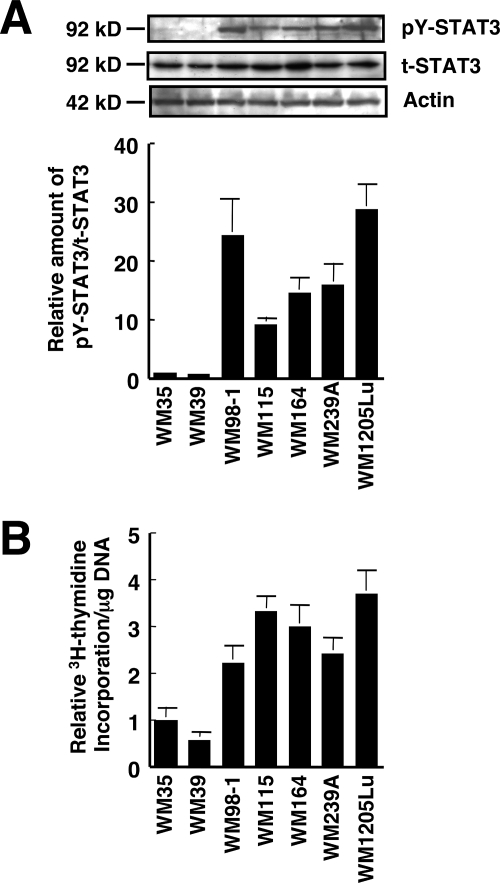
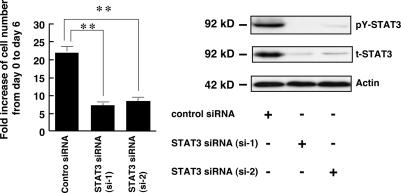
As an initial step in determining the possible involvement of STAT3 in the TPA-induced growth inhibition of melanoma cells, the effects of TPA on the in vitro growth, DNA synthesis, and STAT3 activity in seven human melanoma cell lines was investigated (Figs. 1 and 2). TPA significantly inhibited the in vitro growth as well as DNA synthesis of WM98-1, WM115, WM164, WM239A, and WM1205Lu cells, whereas it did not affect those of WM35 and WM39 cells (Fig. 1). All seven melanoma cell lines expressed similar levels of total STAT3 protein (Fig. 2A). However, STAT3 was phosphorylated (activated) on Tyr705 in the five cell lines whose growth was inhibited by TPA, whereas the activation level of STAT3 in WM35 and WM39 cells, whose growth was not inhibited by TPA, was at negligible levels. In addition, the in vitro growth (Fig. 1A) and DNA synthesis (Fig. 2B) of WM35 and WM39 were relatively lower than those of the other five cell lines. These results suggest that STAT3 plays an important role in the growth of melanoma cells and that constitutively activated STAT3 is related to TPA-induced growth inhibition of melanoma cells. To evaluate the role of STAT3 in melanoma growth directly, the effect of the siRNAs of STAT3 on melanoma growth was examined in WM1205Lu cells (Fig. 3). Knockdown of STAT3 by siRNAs in WM1205Lu cells significantly reduced the expression of total STAT3 as well as the phosphorylation of STAT3 concomitant with a decrease in the growth of the cells. These results indicate that the STAT3 activity positively regulates the growth activity of melanoma cells.
FIGURE 1.
Effects of TPA on the in vitro growth and DNA synthesis of melanoma cell lines. A, seven melanoma cell lines (WM35, WM39, WM98-1, WM115, WM164, WM239A, WM1205Lu) were plated at a density of 1 × 10⁵ cells in 10-cm tissue culture dishes, and the following day (day 0) the cells were treated with either 0.1% DMSO (control; open bars) or 100 nm TPA (filled bars). On day 6 the triplicate dishes were trypsinized, and the cell number was counted. Data are expressed as fold increase of cell number from day 0 to day 6 and are shown as mean ± S.D. (n = 3; *, p < 0.05; **, p < 0.01). B, the seven melanoma cell lines used in A were seeded at 104 cells/well in 24-well plates and grown for 24 h in EMEM containing 5% FCS. Cells were then treated with either 0.1% DMSO (control; open bars) or 100 nm TPA (filled bars) and cultured for another 24 h. [3H]Thymidine was added for the last 6 h of the incubation, and [3H]thymidine incorporation was determined by scintillation counting. [3H]Thymidine incorporation/mg DNA was calculated. Data are expressed as percentage of control and are shown as mean ± S.D. (n = 3; **, p < 0.01). The results shown are representative of three independent experiments.
FIGURE 2.
STAT3 is activated in human melanoma cells. A, whole cell extracts from the seven human melanoma cell lines used in Fig. 1 were prepared, and the phosphorylation level of pY-STAT3 as well as the expression of total STAT3 (t-STAT3) were determined by immunoblot analysis using anti-pY-STAT3 and anti-STAT3 antibodies, respectively. Expression of actin was also examined (top three panels). The relative amount of pY-STAT3/t-STAT3 was calculated (bottom panel). The ratio of pY-STAT3 to total STAT3 in WM35 cells is represented as 1. B, the seven melanoma cell lines used in A were seeded at 104 cells/well in 24-well plates and grown for 48 h in EMEM containing 5% FCS. [3H]Thymidine was added for the last 6 h of the incubation, and [3H]thymidine incorporation was determined by scintillation counting. [3H]Thymidine incorporation/mg DNA was calculated for each cell line, and data are expressed as relative [3H]thymidine incorporation/mg of DNA. The value of WM35 cells is represented as 1, and data are shown as mean ± S.D. The results shown are representative of three independent experiments.
FIGURE 3.
STAT3 is involved in melanoma growth. WM1205Lu cells were plated at a density of 1 × 10⁵ cells in 10-cm tissue culture dishes. On the following day (day 0), the cells were transfected with control siRNA (40 nm) or STAT3 siRNAs, si-1 and si-2 (40 nm). Left, on day 6 the triplicate dishes were trypsinized, and the cell number was counted (left). Data are expressed as fold increase of cell number from day 0 to day 6 and are shown as mean ± S.D. (n = 3; **, p < 0.01). Right, 24 h after siRNA transfection, the phosphorylation level of pY-STAT3 as well as the expression of total STAT3 (t-STAT3) and actin was analyzed as in Fig. 2A.
Dephosphorylation and Attenuation of Transcriptional Activity of STAT3 by TPA
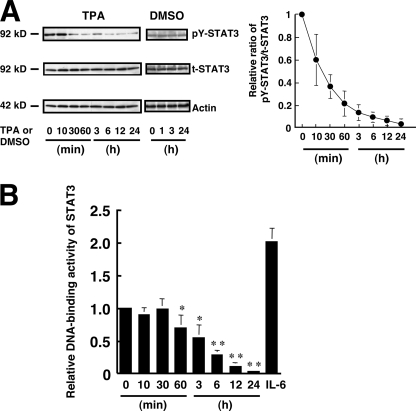
Next, the effect of TPA on the tyrosine phosphorylation state and the DNA-binding activity of STAT3 in melanoma cells was investigated using WM1205Lu cells, which contain phosphorylated STAT3. Tyrosine phosphorylation of STAT3 in the melanoma cells was markedly suppressed in a time-dependent manner within 60 min of TPA treatment, and the suppression of STAT3 phosphorylation lasted for at least 24 h (Fig. 4A). The DNA-binding activity of STAT3 was also suppressed by TPA time-dependently from 60 min after TPA treatment (Fig. 4B), but it was not significantly altered within 30 min after TPA treatment. The discrepancy between the changes in the levels of tyrosine phosphorylation and DNA-binding activity of STAT3 is explained under “Discussion.”
FIGURE 4.
TPA reduces the tyrosine phosphorylation and activity of STAT3 in melanoma cells. A, WM1205Lu cells were treated with either 0.1% DMSO (control) or 100 nm TPA. The phosphorylation level of pY-STAT3 as well as the expression of total STAT3 (t-STAT3) and actin were determined at the indicated time (top three panels). The results shown are representative of three independent experiments. The relative amount of pY-STAT3 to total STAT3 was calculated. The ratio of pY-STAT3 to total STAT3 at time 0 is represented as 1. Data are shown as mean ± S.D. (n = 4; *, p < 0.05; **, p < 0.01 versus time 0). B, WM1205Lu melanoma cells were treated with 100 nm TPA. DNA-binding activity of STAT3 in the cells at the indicated time was determined, and the results are shown as relative DNA-binding activity of STAT3. DNA-binding activity of STAT3 in the cells treated with 10 mg/ml IL-6 for 30 min was also determined. Data are shown as mean ± S.D. (n = 3). The results shown are representative of three independent experiments.
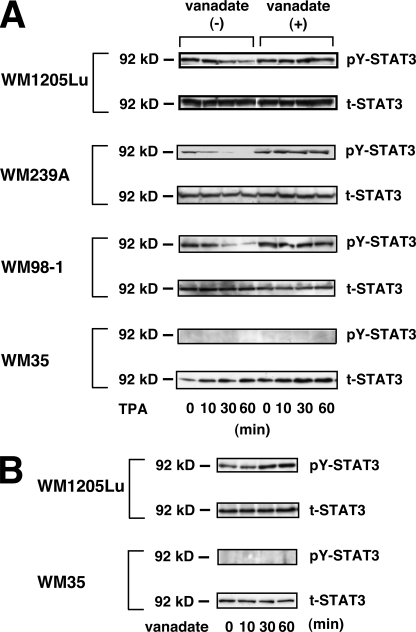
To examine whether the TPA-induced decrease in phosphorylated STAT3 is due to dephosphorylation of STAT3 by PTPase(s), WM1205Lu, WM239A, WM98-1, and WM35 cells were incubated for 30 min with sodium orthovanadate prior to the addition of TPA. The TPA-induced decrease in phosphorylated STAT3 was almost completely inhibited by the pretreatment with vanadate (Fig. 5A, vanadate (+)), indicating that the TPA-induced decrease in phosphorylated STAT3 is mediated through activation of a PTPase(s). Treatment with sodium orthovanadate alone increased the level of tyrosine phosphorylation of STAT3 in WM1205Lu cells, but not in WM35 cells (Fig. 5B).
FIGURE 5.
TPA-induced decrease of phosphorylated STAT3 is due to dephosphorylation of STAT3 mediated through activation of a PTPase(s). A, WM1205Lu, WM239A, WM98-1, and WM35 cells cultured in EMEM containing 5% FCS were incubated without (vanadate (−)) or with 0.5 mm sodium orthovanadate (vanadate (+)) for 30 min and then stimulated with 100 nm TPA. The phosphorylation levels of pY-STAT3 as well as the expression of total STAT3 (t-STAT3) were determined at the indicated time point. B, WM1205Lu and WM35 cells were incubated with 0.5 mm sodium orthovanadate. The phosphorylation levels of pY-STAT3 as well as the expression of total STAT3 were determined at the indicated time point. The results shown are representative of three independent experiments.
PKC Is Involved in the TPA-induced Dephosphorylation of STAT3
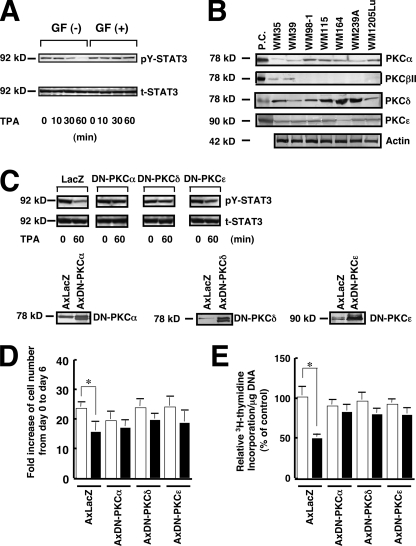
Because the major intracellular receptor for TPA in cells is PKC (32), we investigated whether PKC is involved in the TPA-induced dephosphorylation of STAT3. Pretreatment with the PKC inhibitor GF109203X almost completely inhibited the TPA-induced dephosphorylation of STAT3 (Fig. 6A), indicating that PKC activation is involved in the TPA-induced dephosphorylation of STAT3. PKC consists of multiple isoforms that are divided into three groups depending on their structural differences: cPKC (classical or conventional PKC), consisting of the α, βI, βII, and γ isoforms; nPKC (new or novel PKC), consisting of the δ, ϵ, η, and θ isoforms; and aPKC (atypical PKC), consisting of the ζ and λ isoforms (32). PKCβI and PKCβII are splicing variants: expression of the former is restricted to certain tissues, whereas the latter is the predominant form generated from the PKCβ gene. Of these PKC groups, cPKC and nPKC but not aPKC are activated by TPA (32). The expression of cPKC and nPKC isoforms in the 7 melanoma cell lines used in this study was examined by immunoblot analysis (Fig. 6B). Rat brain was used as a positive control because all PKC antibodies used react with both the human and rat PKC proteins (33). PKCα, PKCδ, and PKCϵ were detected in all melanoma cell lines, although the amount of PKCα protein in WM35 and WM39 cells was considerably less than in the other five cell lines. PKCβII was detected in only the WM35 and WM39 cell lines. PKCγ was detected in none of the seven melanoma cell lines (data not shown). To examine whether the PKC isoforms that are commonly expressed in melanoma cells containing constitutively active STAT3 are responsible for the TPA-induced activation of the PTPase(s), dominant negative forms of PKCα, PKCδ, and PKCϵ were introduced into WM1205Lu cells using adenovirus vectors (Fig. 6C). The TPA-induced dephosphorylation of STAT3 was markedly suppressed by the introduction of the dominant negative mutant of PKCα, PKCδ, or PKCϵ, indicating that these PKC isoforms are involved in the TPA-induced dephosphorylation of STAT3. Expression of the dominant negative forms of PKCα, PKCδ, and PKCϵ blocked both the TPA-induced inhibition of in vitro growth (Fig. 6D) and DNA synthesis (Fig. 6E).
FIGURE 6.
PKC is involved in the TPA-induced dephosphorylation of STAT3. A, WM1205Lu cells cultured in EMEM containing 5% FCS were incubated without (GF (−)) or with (GF (+)) 1 μm GF109203X for 60 min and then stimulated with 100 nm TPA. The phosphorylation level of pY-STAT3 (upper panel) as well as the expression of total STAT3 (t-STAT3) (lower panel) were determined at the indicated time. B, equal amounts of the total cell lysate of seven melanoma cell lines were subjected to immunoblot analysis using antibodies against each PKC isoform. Rat brain lysate was used as a positive control (P.C.) for PKCα, PKCβII, PKCδ, and PKCϵ. The expression of actin was also examined. C, WM1205Lu cells were infected with 20 plaque-forming units/cell of AxDN-PKCα, AxDN-PKCδ, AxDN-PKCϵ, or AxLacZ and cultured in EMEM containing 5% FCS for 24 h. Cells infected with each adenovirus were treated with 100 nm TPA for 60 min, and the phosphorylation level of pY-STAT3 (upper panels) as well as the expression of total STAT3 (middle panels) were determined by immunoblot analysis. The expression of DN-PKCα, DN-PKCδ, and DN-PKCϵ was examined by immunoblot analysis using anti-PKCα, anti-PKCδ, and anti-PKCϵ antibodies, respectively (lower panels). D, WM1205Lu cells were infected with 20 plaque-forming units/cell of AxDN-PKCα, AxDN-PKCδ, AxDN-PKCϵ, or AxLacZ and cultured in EMEM containing 5% FCS for 24 h. Cells were then seeded at a density of 1 × 10⁵ cells in 10-cm tissue culture dishes, and the following day (day 0) the cells were treated with either 0.1% DMSO (control; open bars) or 100 nm TPA (filled bars). After 6 days (day 6) the triplicate dishes were trypsinized, and the cell number was counted. Data are expressed as fold increase of cell number from day 0 to day 6 and are shown as mean ± S.D. (n = 3; *, p < 0.05). E, WM1205Lu cells were infected with 20 plaque-forming units/cell of AxDN-PKCα, AxDN-PKCδ, AxDN-PKCϵ, or AxLacZ and cultured in EMEM containing 5% FCS for 24 h. Cells were then seeded at 104 cells/well in 24-well plates and grown for 24 h in EMEM containing 5% FCS. Then, the cells were treated with either 0.1% DMSO (control; open bars) or 100 nm TPA (filled bars) for 24 h. [3H]Thymidine was added for the last 6 h of the incubation, and [3H]thymidine incorporation was determined by scintillation counting. [3H]Thymidine incorporation/mg of DNA was calculated, and data are expressed as relative [3H]thymidine incorporation/mg of DNA. The value of control cells infected with AxLacZ is represented as 100%, and data are shown as mean ± S.D. (n = 3; *, p < 0.05). The results shown are representative of three independent experiments.
Involvement of c-Src Activity in the Constitutive Activation of STAT3 but Not in the TPA-induced Dephosphorylation of STAT3
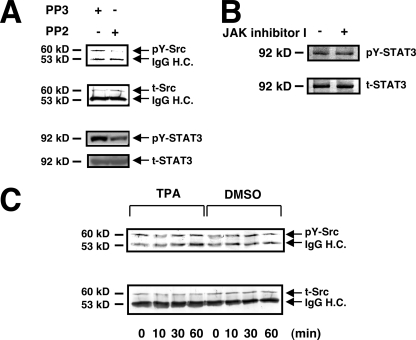
It has been reported that c-Src contributes to the constitutive activation of STAT3 in melanoma cells by phosphorylating STAT3 (21). In WM1205Lu cells, c-Src was constitutively activated, and PP2, a Src-specific inhibitor, but not PP3, an inactive analogue of PP2, inhibited the phosphorylation of STAT3 concomitant with an inhibition of c-Src tyrosine kinase activity (Fig. 7A). This indicated that STAT3 is in part positively regulated by c-Src in melanoma cells. TPA did not, however, affect c-Src activity (Fig. 7C), indicating that TPA-induced STAT3 dephosphorylation is not due to an inhibition of c-Src activity. TPA did not affect the activity of two other representative Src family kinases, Fyn and c-Yes, in WM1205Lu cells (data not shown). It has been shown that activation of STAT3 in some melanoma cell lines relies on JAK (34). However, the phosphorylation level of STAT3 was not affected either at 1 h (data not shown) or 3 h after JAK inhibitor I treatment in WM1205Lu cells (Fig. 7B). These results indicate that the fast Tyr705 dephosphorylation of STAT3 in melanoma cells upon TPA treatment (Figs. 4A and 5A) cannot be attributed to the inhibition of Src or JAK family kinases.
FIGURE 7.
Inhibition of c-Src or JAK activity is not involved in TPA-induced STAT3 dephosphorylation. A, WM1205Lu cells were treated with 10 μm PP2 or PP3 (control) for 180 min. The phosphorylation level of c-Src (pY-Src) and the expression of total c-Src (t-Src) were determined by immunoblot analysis after immunoprecipitation with anti-c-Src antibody using anti-phospho-c-Src and anti-c-Src antibodies, respectively (top two panels). The expression of pY-STAT3 and total STAT3 (t-STAT3) was also determined by immunoblot analysis (bottom two panels). B, WM1205Lu cells were treated with 200 nm JAK inhibitor I or DMSO (control) for 180 min. The phosphorylation level of pY-STAT3 as well as the expression of total STAT3 were determined by immunoblot analysis using anti-pY-STAT3 and anti-STAT3 antibodies, respectively. C, WM1205Lu cells were stimulated with 100 nm TPA or 0.1% DMSO (control). The phosphorylation level of pY-Src (upper panel) as well as the expression of t-Src (lower panel) were determined at the indicated time point. The positions of pY-Src, t-Src, IgG heavy chains (IgG H.C.), pY-STAT3, and t-STAT3 in A and B are indicated by arrows. The results shown are representative of three independent experiments.
Effect of TPA on STAT3 Phosphorylation at Ser727
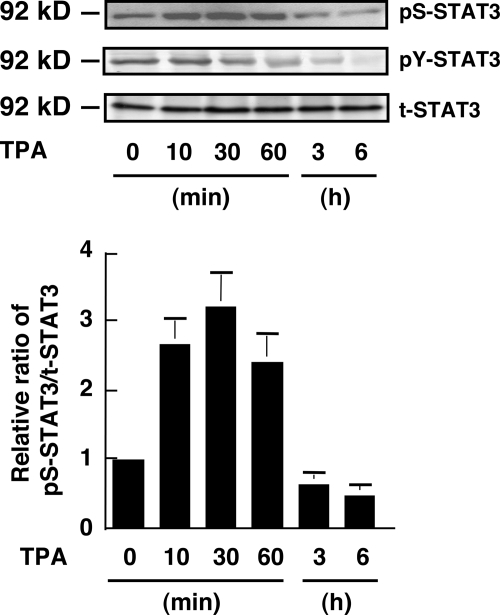
It is predicted that Tyr705 phosphorylation is not sufficient for the obligatory role of STAT3 (19). Ser727 phosphorylation in STAT3 enhances the transcriptional activity of STAT3 and is required for maximal activation of STAT3 signaling (19). We examined the effect of TPA on the phosphorylation status of Ser727 in WM1205Lu cells (Fig. 8). STAT3 was constitutively phosphorylated on Ser727 in the cells. TPA treatment induced a transient (∼1 h) increase in the phosphorylation level of Ser727. Then, the phosphorylation level of Ser727 decreased and became lower than in untreated cells at 3 and 6 h after treatment.
FIGURE 8.
Effect of TPA on Ser727 phosphorylation of STAT3. WM1205Lu melanoma cells were treated with 100 nm TPA. The phosphorylation levels of Ser727 (pS-STAT3) and Tyr705 (pY-STAT3) on STAT3 and the expression of total STAT3 (t-STAT3) were determined by immunoblot analysis using anti-pS-STAT3, anti-pY-STAT3, and anti-STAT3 antibodies, respectively, at the indicated time point (top three panels). The results shown are representative of three independent experiments. The relative amount of pS-STAT3 to total STAT3 was calculated (bottom panel). The ratio of pS-STAT3 to total STAT3 at time 0 is represented as 1. Data are shown as mean ± S.D. (n = 3).
DISCUSSION
In the present study, we have shown that STAT3 plays a crucial role in the growth of melanoma cells. We have also demonstrated that STAT3 activity is in part positively regulated by c-Src and negatively regulated by a PKC-activated PTPase(s) in melanoma cells. TPA inhibits the growth of melanoma cells containing activated STAT3 but not of cells lacking activated STAT3. Furthermore, TPA-induced growth inhibition of melanoma cells is associated with dephosphorylation of STAT3 without affecting c-Src tyrosine kinase activity. Thus, we conclude that the growth-inhibitory effect of TPA on melanoma cells is mediated through dephosphorylation of STAT3.
We have shown that melanoma growth is positively regulated by STAT3, which is consistent with the previous report (21). However, it is obvious that STAT3 activity is not the sole positive regulator of melanoma growth from the following facts: First, the growth activity of melanoma cell lines does not directly correlate with the levels of STAT3 activity. Second, blockade of STAT3 activity only partially inhibits the growth of melanoma cells. Third, WM35 and WM39 cells containing a negligible amount of the active form of STAT3 still grow.
In contrast to the idea that constitutively activated STAT3 positively regulates melanoma growth, it has been reported that several external signals such as IL-6 and oncostatin M induce melanoma growth inhibition through activation of STAT3 (35, 36). Thus, it is possible that constitutively activated STAT3 and external signal-induced activation of STAT3 affect melanoma growth differently.
In normal cells, the level and duration of STAT3 activation are controlled by a variety of mechanisms, including dephosphorylation of the receptor complex or nuclear STAT3 dimers by PTPases, interaction of activated STAT3 with inhibitory molecules in the protein inhibitors of the activated STAT (PIAS) family, and feedback inhibition of the JAK/STAT3 pathway by the suppressor of cytokine signaling (SOCS) protein through inhibition and/or degradation of JAKs (37, 38). Conversely, we have shown in this study that STAT3 is constitutively activated in most of the melanoma cell lines used, which is consistent with a previous report (21). It has been proposed that the mechanisms of the constitutive activation of STAT3 in cancer cells are varied (20). Previous (21) and our present studies show that c-Src activity is involved in the constitutive activation of STAT3 in melanoma cells. Although treatment with JAK inhibitor I for at least 3 h did not affect the tyrosine phosphorylation levels of STAT3 in WM1205Lu cells (Fig. 7B), JAK inhibitor I treatment for 18 h reduced the tyrosine phosphorylation level of STAT3 (data not shown). These results indicate that JAKs, in addition to c-Src, contribute to the basal phosphorylation level of STAT3 in melanoma cells as reported previously (34) but not to the TPA-induced dephosphorylation of STAT3.
The TPA- and PKC-activated PTPase(s) targeting the constitutively activated STAT3 in melanoma cells remain to be identified. In WM1205Lu cells the TPA-induced dephosphorylation was not observed on either STAT1 or STAT5, which are also constitutively activated in the cells (data not shown), indicating that the PKC-activated PTPase(s) preferentially dephosphorylate STAT3. Conversely, our results indicate that the PTPase(s) are activated either directly or indirectly by at least three isoforms of PKC, PKCα, PKCδ, and PKCϵ, suggesting that the PTPase(s) can be regulated by multiple signaling pathways. Further study is required to identify the PKC-activated STAT3-dephosphorylating PTPase(s) and to clarify the regulation mechanism of the PTPase(s). It is also important to examine whether the PTPase(s) play a role in the external signal induced activation-inactivation cycle of STAT3.
The results in Fig. 4B show that the levels of DNA-binding activity of STAT3 between 10 and 30 min after TPA treatment remain at higher levels than those expected from the level of Tyr705 phosphorylation. The apparent dissociation of DNA-binding activity of STAT3 from the level of Tyr705 phosphorylation may be ascribed to the transient increase in the level of Ser727 phosphorylation that contributes to an increase in DNA-binding activity of STAT3 (19).
Constitutively activated STAT3 is found in a variety of cancer cells and is regarded as an attractive molecular target for cancer therapy (39–41), including therapy of melanoma (1, 42, 43). Indeed, we have shown that down-regulation of STAT3 activity by either TPA or siRNAs leads to an efficient growth inhibition of melanoma cells. In addition, it has been shown, using in vivo tumor models, that murine B16 melanoma tumors regress after inhibition of constitutively activated STAT3 by gene therapy with a dominant negative STAT3 (44). Identification of the PKC-dependent STAT3-dephosphorylating PTPase(s) may lead to improved melanoma therapy through modulation of STAT3 activity.
This work was supported in part by Research Grant 19591305 (to M. O.) and the Global Center of Excellence Program “Global Center for Education and Research in Integrative Membrane Biology” (to M. S.) from the Ministry of Education, Culture, Sports, Science, and Technology of Japan.
- TPA
- 12-O-tetradecanoylphorbol-13-acetate
- DMSO
- dimethyl sulfoxide
- DN
- dominant negative
- EMEM
- Eagle's minimal essential medium
- FCS
- fetal calf serum
- IL-6
- interleukin-6
- JAK
- Janus kinase
- PKC
- protein kinase C
- aPKC
- atypical PKC
- cPKC
- classical/conventional PKC
- nPKC
- new/novel PKC
- pS-STAT3
- STAT3 phosphorylated on Ser727
- pY-STAT3
- STAT3 phosphorylated on Tyr705
- PTP
- protein-tyrosine phosphatase
- siRNA
- small interfering RNA
- STAT3
- signal transducer and activator of transcription 3.
REFERENCES
- 1.Miller A. J., Mihm M. C., Jr. (2006) N. Engl. J. Med. 355, 51–65 [DOI] [PubMed] [Google Scholar]
- 2.Markovic S. N., Erickson L. A., Rao R. D., Weenig R. H., Pockaj B. A., Bardia A., Vachon C. M., Schild S. E., McWilliams R. R., Hand J. L., Laman S. D., Kottschade L. A., Maples W. J., Pittelkow M. R., Pulido J. S., Cameron J. D., Creagan E. T. (2007) Mayo Clin. Proc. 82, 364–380 [DOI] [PubMed] [Google Scholar]
- 3.Fecher L. A., Cummings S. D., Keefe M. J., Alani R. M. (2007) J. Clin. Oncol. 25, 1606–1620 [DOI] [PubMed] [Google Scholar]
- 4.Hocker T. L., Singh M. K., Tsao H. (2008) J. Invest. Dermatol. 128, 2575–2595 [DOI] [PubMed] [Google Scholar]
- 5.Halaban R., Ghosh S., Duray P., Kirkwood J. M., Lerner A. B. (1986) J. Invest. Dermatol. 87, 95–101 [DOI] [PubMed] [Google Scholar]
- 6.Becker D., Beebe S. J., Herlyn M. (1990) Oncogene 5, 1133–1139 [PubMed] [Google Scholar]
- 7.Brooks G., Birch M., Hart I. R. (1990) Pigment Cell Res. 3, 98–100 [DOI] [PubMed] [Google Scholar]
- 8.Arita Y., O'Driscoll K. R., Weinstein I. B. (1994) Int. J. Cancer 56, 229–235 [DOI] [PubMed] [Google Scholar]
- 9.Oka M., Kikkawa U. (2005) Cancer Metastasis Rev. 24, 287–300 [DOI] [PubMed] [Google Scholar]
- 10.Akira S., Nishio Y., Inoue M., Wang X. J., Wei S., Matsusaka T., Yoshida K., Sudo T., Naruto M., Kishimoto T. (1994) Cell 77, 63–71 [DOI] [PubMed] [Google Scholar]
- 11.Zhong Z., Wen Z., Darnell J. E., Jr. (1994) Science 264, 95–98 [DOI] [PubMed] [Google Scholar]
- 12.Bromberg J., Darnell J. E., Jr. (2000) Oncogene 19, 2468–2473 [DOI] [PubMed] [Google Scholar]
- 13.Darnell J. E., Jr. (1997) Science 277, 1630–1635 [DOI] [PubMed] [Google Scholar]
- 14.Sasse J., Hemmann U., Schwartz C., Schniertshauer U., Heesel B., Landgraf C., Schneider-Mergener J., Heinrich P. C., Horn F. (1997) Mol. Cell. Biol. 17, 4677–4686 [DOI] [PMC free article] [PubMed] [Google Scholar]
- 15.Horvath C. M., Wen Z., Darnell J. E., Jr. (1995) Genes Dev. 9, 984–994 [DOI] [PubMed] [Google Scholar]
- 16.Bromberg J., Chen X. (2001) Methods Enzymol. 333, 138–151 [DOI] [PubMed] [Google Scholar]
- 17.Levy D. E., Lee C. K. (2002) J. Clin. Invest. 109, 1143–1148 [DOI] [PMC free article] [PubMed] [Google Scholar]
- 18.Bromberg J. F., Wrzeszczynska M. H., Devgan G., Zhao Y., Pestell R. G., Albanese C., Darnell J. E., Jr. (1999) Cell 98, 295–303 [DOI] [PubMed] [Google Scholar]
- 19.Bowman T., Garcia R., Turkson J., Jove R. (2000) Oncogene 19, 2474–2488 [DOI] [PubMed] [Google Scholar]
- 20.Bromberg J. (2002) J. Clin. Invest. 109, 1139–1142 [DOI] [PMC free article] [PubMed] [Google Scholar]
- 21.Niu G., Bowman T., Huang M., Shivers S., Reintgen D., Daud A., Chang A., Kraker A., Jove R., Yu H. (2002) Oncogene 21, 7001–7010 [DOI] [PubMed] [Google Scholar]
- 22.Messina J. L., Yu H., Riker A. I., Munster P. N., Jove R. L., Daud A. I. (2008) Cancer Control 15, 196–201 [DOI] [PubMed] [Google Scholar]
- 23.Hanke J. H., Gardner J. P., Dow R. L., Changelian P. S., Brissette W. H., Weringer E. J., Pollok B. A., Connelly P. A. (1996) J. Biol. Chem. 271, 695–701 [DOI] [PubMed] [Google Scholar]
- 24.Thompson J. E., Cubbon R. M., Cummings R. T., Wicker L. S., Frankshun R., Cunningham B. R., Cameron P. M., Meinke P. T., Liverton N., Weng Y., DeMartino J. A. (2002) Bioorg. Med. Chem. Lett. 12, 1219–1223 [DOI] [PubMed] [Google Scholar]
- 25.Hsu M.-Y., Elder D. E., Herlyn M. (1999) Human Cell Culture, pp. 259–274, Kluwer Academic Publishers, Norwell, MA [Google Scholar]
- 26.Oka M., Hitomi T., Okada T., Nakamura S., Nagai H., Ohba M., Kuroki T., Kikkawa U., Ichihashi M. (2002) Biochem. Biophys. Res. Commun. 294, 1109–1113 [DOI] [PubMed] [Google Scholar]
- 27.Yamamoto N., Mammadova G., Song R. X., Fukami Y., Sato K. (2006) J. Cell Sci. 119, 4623–4633 [DOI] [PubMed] [Google Scholar]
- 28.Oka M., Ogita K., Ando H., Kikkawa U., Ichihashi M. (1995) J. Invest. Dermatol. 105, 567–571 [DOI] [PubMed] [Google Scholar]
- 29.Han J. M., Kim Y., Lee J. S., Lee C. S., Lee B. D., Ohba M., Kuroki T., Suh P. G., Ryu S. H. (2002) Mol. Biol. Cell 13, 3976–3988 [DOI] [PMC free article] [PubMed] [Google Scholar]
- 30.Oka M., Okada T., Nakamura S., Ohba M., Kuroki T., Kikkawa U., Nagai H., Ichihashi M., Nishigori C. (2003) FEBS Lett. 554, 179–183 [DOI] [PubMed] [Google Scholar]
- 31.Kanegae Y., Lee G., Sato Y., Tanaka M., Nakai M., Sakaki T., Sugano S., Saito I. (1995) Nucleic Acids Res. 23, 3816–3821 [DOI] [PMC free article] [PubMed] [Google Scholar]
- 32.Nishizuka Y. (1995) FASEB J. 9, 484–496 [PubMed] [Google Scholar]
- 33.Oka M., Ogita K., Ando H., Horikawa T., Hayashibe K., Saito N., Kikkawa U., Ichihashi M. (1996) J. Cell. Physiol. 167, 406–412 [DOI] [PubMed] [Google Scholar]
- 34.Kreis S., Munz G. A., Haan S., Heinrich P. C., Behrmann I. (2007) Mol. Cancer Res. 5, 1331–1341 [DOI] [PubMed] [Google Scholar]
- 35.Kortylewski M., Heinrich P. C., Mackiewicz A., Schniertshauer U., Klingmüller U., Nakajima K., Hirano T., Horn F., Behrmann I. (1999) Oncogene 18, 3742–3753 [DOI] [PubMed] [Google Scholar]
- 36.Lacreusette A., Nguyen J. M., Pandolfino M. C., Khammari A., Dreno B., Jacques Y., Godard A., Blanchard F. (2007) Oncogene 26, 881–892 [DOI] [PubMed] [Google Scholar]
- 37.Heinrich P. C., Behrmann I., Haan S., Hermanns H. M., Müller-Newen G., Schaper F. (2003) Biochem. J. 374, 1–20 [DOI] [PMC free article] [PubMed] [Google Scholar]
- 38.Kubo M., Hanada T., Yoshimura A. (2003) Nat. Immunol. 4, 1169–1176 [DOI] [PubMed] [Google Scholar]
- 39.Turkson J., Jove R. (2000) Oncogene 19, 6613–6626 [DOI] [PubMed] [Google Scholar]
- 40.Xi S., Gooding W. E., Grandis J. R. (2005) Oncogene 24, 970–979 [DOI] [PubMed] [Google Scholar]
- 41.Jing N., Tweardy D. J. (2005) Anticancer Drugs 16, 601–607 [DOI] [PubMed] [Google Scholar]
- 42.Kortylewski M., Jove R., Yu H. (2005) Cancer Metastasis Rev. 24, 315–327 [DOI] [PubMed] [Google Scholar]
- 43.Smalley K. S., Herlyn M. (2005) Ann. N. Y. Acad. Sci. 1059, 16–25 [DOI] [PubMed] [Google Scholar]
- 44.Niu G., Heller R., Catlett-Falcone R., Coppola D., Jaroszeski M., Dalton W., Jove R., Yu H. (1999) Cancer Res. 59, 5059–5063 [PubMed] [Google Scholar]


