Abstract
Voltage-gated eag-related gene (Erg) K+ channels regulate the electrical activity of many cell types. Data regarding Erg channel expression and function in electrically excitable glucagon and insulin producing cells of the pancreas is limited. In the present study Erg1 mRNA and protein were shown to be highly expressed in human and mouse islets and in α-TC6 and Min6 cells α- and β-cell lines, respectively. Whole cell patch clamp recordings demonstrated the functional expression of Erg1 in α- and β-cells, with rBeKm1, an Erg1 antagonist, blocking inward tail currents elicited by a double pulse protocol. Additionally, a small interference RNA approach targeting the kcnh2 gene (Erg1) induced a significant decrease of Erg1 inward tail current in Min6 cells. To investigate further the role of Erg channels in mouse and human islets, ratiometric Fura-2 AM Ca2+-imaging experiments were performed on isolated α- and β-cells. Blocking Erg channels with rBeKm1 induced a transient cytoplasmic Ca2+ increase in both α- and β-cells. This resulted in an increased glucose-dependent insulin secretion, but conversely impaired glucagon secretion under low glucose conditions. Together, these data present Erg1 channels as new mediators of α- and β-cell repolarization. However, antagonism of Erg1 has divergent effects in these cells; to augment glucose-dependent insulin secretion and inhibit low glucose stimulated glucagon secretion.
Voltage-gated eag-related gene (Erg)2 potassium (K+) channels are part of the larger family of voltage dependent K+ (Kv) channels (1). Three channel isoforms Erg1, Erg2, and Erg3 have been discovered (2, 3), and they differ by their activation and inactivation voltage dependence, gating properties, and pharmacological profile (4–7). Erg channels control cellular activity by controlling the repolarization of the action potential (AP). In atrial cells and ventricular myocytes, Erg regulates plateau formation and AP repolarization, as blocking Erg channels increases AP length (8, 9). These channels are also strongly involved in the pacemaking activity of cardiac cells (10, 11). Interestingly, a rare congenital heart condition, the inherited form of long QT syndrome is caused by mutations of Erg channel genes (9, 12). Erg channels also control the resting membrane potential in various cell types. For example, in neurons of the medial vestibular nucleus, blocking Erg channels produce an increase in AP discharge or in smooth muscle cells, blocking Erg channels mediates depolarization up to 20 mV (13–15). Hormone secretion studies also demonstrated the involvement of Erg channels in the secretion of prolactin from neurons of the anterior pituitary. Thyrotropin-releasing factor decreases Erg current, which depolarizes neurons and thereby stimulates prolactin secretion (16, 17).
In the pancreas, Kv channels and more specifically Kv2.1, regulate insulin secretion by controlling the repolarization of β-cell membrane potential (18–20), although the contribution of this isoform in humans has recently been questioned (21). In α-cells, Kv2.1 and Kv1.4 channels repolarize the membrane potential (22, 23); however, the involvement of Kv channels in the secretion of glucagon is yet to be investigated. One study showed that Erg1, -2, and -3 are expressed in rat α- and β-cells and the rat insulinoma cell line, INS-1, and that they are involved in decreasing membrane potential. Blocking Erg channels with the channel antagonist E4031 increases insulin secretion from INS1 cells (24); however, definitive data regarding the role of Erg channels in insulin and glucagon secretion is limited.
Therefore this study aimed to define the functions of Erg channels in α- and β-cells. We found that Erg1 channels are strongly expressed in pancreatic α- and β-cells. Pharmacological and genetic manipulation combined with whole cell recordings in pancreatic cell lines and primary islet cells determined that Erg1 produces a functional current in α- and β-cells. Blocking Erg1 increased intracellular calcium ([Ca2+]i) in mouse β-cells, but only in a minority of mouse and human α-cells. Secretion studies using isolated mouse islets demonstrated that Erg1 are negative regulators of insulin secretion, but positive regulators of glucagon secretion, suggesting distinct roles for Erg1 in β- and α-cells.
EXPERIMENTAL PROCEDURES
Reagents
Lipofectamine 2000, reagents for qPCR and Fura-2 acetoxymethyl ester (Fura-2 AM), were obtained from Invitrogen. rBeKm1, rErgTx-1, and E4031 were purchased from Alamone Laboratories Ltd. (Jerusalem, Israel). All other compounds were obtained from Sigma-Aldrich.
Cell Culture
α-TC6 cells were cultured in high glucose Dulbecco's modified Eagle's medium supplemented with 10% fetal bovine serum and 100 units/ml penicillin/G sodium, 100 μg/ml streptomycin sulfate, and without sodium pyruvate. Min6 cells were cultured in the same medium with the addition of β-mercaptoethanol.
Islet Isolation and Culture
The MIP-GFP mouse model is a gift from Dr. Manami Hara (University of Chicago). Islets were isolated from 3-month-old (20 g) MIP-GFP CD1 or CD1 mice as previously described (25, 26). The expression of GFP driven by the mouse insulin promoter (MIP) in these mice allows the identification of β-cells via their green fluorescence under UV light (23, 27). GFP-negative cells are presumed to be α- or δ-cells. When using islet cells from CD-1 mice β-cells were identified as larger cells and by their response to glucose. α-Cells were presumed to be smaller and then were confirmed based on their response to low glucose. Islets were dispersed using dispase II and were cultured for 1–3 days before use in RPMI 1640 media supplemented with 10% fetal bovine serum, 100 units/ml penicillin/G sodium, 100 μg/ml streptomycin sulfate, and 11.1 mm glucose at 37 °C and 5% CO2.
Principles of laboratory animal care were followed, and protocols were approved by the University of Toronto Animal Care Committee. Human islets from three healthy donors were provided by James Shapiro (University of Alberta) and the ABCC Human Islet Distribution Program at the University of Alberta. Human islets were isolated following the Edmonton Protocol (28), dispersed using dispase II, and cultured in RPMI 1640 medium supplemented with 11.1 mm glucose, 10% fetal bovine serum, 25 mm HEPES, 2 mm l-glutamine, 100 units/ml penicillin, and 100 μg/ml streptomycin at 37 °C and 5% CO2.
qPCR
Total RNA was isolated using TRIzol reagent following the manufacturer's protocol. Subsequent DNase I treatment was performed to remove any residual DNA contamination. 1–5 μg of the isolated RNA was reverse transcribed using Moloney murine leukemia virus reverse transcriptase. qPCR was performed as described previously (1). Primers were designed using Primer Express version 2.0 software (Applied Biosystems) and sequence specificity confirmed prior to use (Tables 1 and 2). Master mix was aliquoted to a 384-well plate with each well containing 3.475 μl of ultra pure water, 1 μl of 10× PCR buffer (20 mm Tris-HCl pH 8.0, 40 mm NaCl, 2 mm sodium phosphate, 0.1 mm EDTA, 1 mm dithiothreitol, 50% (v/v) glycerol), 0.6 μl of 50 mm MgCl2, 0.2 μl of 10 mm dNTP mix, 0.2 μ1 of 50× 5-carboxy-X-rhodamine (final concentration 0.83 mm), 0.3 μl of 10000× SYBR Green, 0.025 μl of 5 units/μl Platinum Taq Polymerase, and 0.2 μl of 50 μm mixed (forward and reverse) primers. 10 ng of cDNA per well was used as the template for amplification. The real-time PCR protocol employed was as follows: heat activation of polymerase at 95 °C for 3 min, followed by 40 cycles of: 95 °C for 10 s, 65 °C for 15 s, and 72 °C for 20 s. Readings were carried out on an ABI Prism® 7900HT Sequence Detection System (Applied Biosystems) and compared against a standard curve created from mouse genomic DNA and human genomic DNA for human islets. Data were normalized to the expression of β-actin in each sample.
TABLE 1.
qPCR primers for mouse Kir, Kv channel isoforms, and β-actin
| Gene | Channel | Forward sense (5′ → 3′) | Reverse sense (5′ → 3′) | Accession number |
|---|---|---|---|---|
| kcnj11 | Kir6.2 | GACATCCCCATGGAGAATGG | TCGATGACGTGGTAGATGATGAG | NM_010602 |
| kcna1 | Kv1.1 | AGATCGTGGGCTCCTTGTGT | ACGGGCAGGGCAATTGT | NM_010595 |
| kcna2 | Kv1.2 | AGCTGATGAGAGAGATTCCCAGTT | GACTGCCCACCAGAAAGCA | NM_008417 |
| kcna3 | Kv1.3 | TTGTGGCCATCATTCCTTA | CCTGCTGCCCATTACCTTGT | NM_008418 |
| kcna4 | Kv1.4 | TCTACCACAGAGAGACTGAAAATGAAG | TGGACAACTGACTGCGTTTTG | NM_021275 |
| kcna5 | Kv1.5 | TGAGCATTCACTGTAAGATGGATGT | TTGAGTTATCCCTCTGCTGGGTA | NM_145983 |
| kcna6 | Kv1.6 | CCTGGATGAGATGCACGTTT | TTACAAGACCCAGGCATGAAAA | NM_013568 |
| kcna7 | Kv1.7 | CTGGTTGGAGCCACAAGGA | CTGCCACATCTTTTCCCAAGTAC | NM_010596 |
| kcnb1 | Kv2.1 | CGTCATCGCCATCTCTCATG | CAGCCCACTCTCTCACTAGCAA | NM_008420 |
| kcnc1 | Kv3.1 | TGCCCCAACAAGGTGGAA | ATGGCCACAAAGTCAATGATATTG | NM_008421 |
| kcnc3 | Kv3.3 | CGGGCTGCCAGGTATGTG | AGGTGGTGATGGAGATGAGGATAA | NM_008422 |
| kcnc4 | Kv3,4 | TGTTGAAGTCAGTTGAAGGCAAGA | GGTGGGAGGTAGAACCCCAAT | NM_145922 |
| kcnd1 | Kv4.1 | GCTGCTCTCGAAGGGTCAAT | CACGGCTGACAGAGGCAGTA | NM_008423 |
| kcnd3 | Kv4.3 | CCTGCTGCTCCCGTCGTA | GGGTGGCAGGCAGGTTAGA | NM_001039347 |
| kcnf1 | Kv5.1 | TATCAGATGGCCTGGCATGA | ATGCTGAACAGGAGGTTTTATTGAG | NM_201531 |
| kcng1 | Kv6.1 | TGCCCCACTGCTCTATGTCA | AGCGGAGATGCTGGTGAATT | NM_001081134 |
| kcne4 | Kv6.2 | GGGCCCTCTGTTCACTTTAAGAT | TTAAACGGCCCCCTTTGG | NM_021342.1 |
| kcng4 | Kv6.3 | AGTGCATCTTGACCATGTGGAA | GGAGCATGTGTGTGCATCTGT | NM_025734 |
| kcns1 | Kv9.1 | GCCTACACAGCCGAAGAAGAA | ACCAGCAGGCAGGGATTG | NM_008435 |
| kcns2 | Kv9.2 | TGGGACATAAGCCCTAGATTGC | GACACACCATCCTCAAAAGAAAAA | NM_181317 |
| kcns3 | Kv9.3 | AATTGGCTTAGAAGGACCTGCTT | AACTATCACCTAAGGAGCCATGAAA | NM_173417 |
| kcng3 | Kv10.1 | GAGAGCGTGCGGTGACTGT | CAAACTGCTGGGCCTGCTTA | NM_153512 |
| kcnh2 | Kv11.1 | ATGGCTCAGATCCAGGCAGTTA | CAAGGAGAGCGGTCAGGTAATG | NM_013569 |
| kcnh6 | Kv11.2 | ACTGCAATGATGGCTTCTGCGAAC | AGGATGTCCACCTTGCACTCTTCA | NM_001037712.1 |
| kcnh7 | Kv11.3 | AACAGTGCAAATGACGCTGACGAC | TCTTCACCATGGAGTCTGGTTGCT | NM_133207.2 |
| β-actin | CTGAATGGCCCAGGTCTGA | CCCTGGCTGCCTCAACAC | NM_007393 |
TABLE 2.
qPCR primers for human Kir, Kv channel isoforms, and β-actin
| Gene | Channel | Forward sense (5′ → 3′) | Reverse sense (5′ → 3′) | Accession number |
|---|---|---|---|---|
| KCNJ11 | Kir6.2 | GCGCTTTGTGCCCATTGTA | TTGATGGTGTTGCCAAACTTG | NM_000525 |
| KCNA1 | Kv1.1 | GCCAGACCCTCAAAGCTAGTATG | ACCCCGATGAAGAGGAAAAAGA | NM_000217 |
| KCNA2 | Kv1.2 | CTCCAAAGGTCTCCAGATTCTAGGT | GAATATCAGGAGGCCCAATTCTCT | NM_004974 |
| KCNA3 | Kv1.3 | AATTCGGACCTGACTGATGCA | GACAACCTTTTTCGGGTTTCC | NM_002232.3 |
| KCNA4 | Kv1.4 | AAGATTGTCGGGTCCCTGTGT | CTGGCACTGGCAAAGCAA | NM_002233 |
| KCNA5 | Kv1.5 | TGGTGAGCGCTGTGAGATG | GGGTTATCCCTCTGCTGGGTAT | NM_002234.2 |
| KCNA6 | Kv1.6 | GCCATTTGTTTTTTGCCTTTGA | GTTTCAGAACTGCACCCAAAAGAT | NM_002235.3 |
| KCNA7 | Kv1.7 | GAATCACAGAACAATCCTGAACCA | GCCTGTCTGACAGCCTTCCT | NM_031886.2 |
| KCNB1 | Kv2.1 | CCCAGCCACCCCTAGGAA | TGTCTAACAGTGGAATCCATCCA | NM_004975 |
| KCNB2 | Kv2.2 | AGGGCAGTGTGGGCTCTTC | ATGGTAAATGTCTTGCCTACAGTTGT | NM_004770.2 |
| KCNC1 | Kv3.1 | ACCCCAGCGCCAGTGA | CCACGGCCCACCAGAAG | NM_004976.3 |
| KCNC2 | Kv3.2 | AGAGTGGGAGCTCAACCTAACG | CCCAATGGGAATGTTTTTGAAC | NM_153748.1 |
| KCNC3 | Kv3.3 | CCCCAGGCTTTGCAGAAAC | TCACAGGCATCTCACAGCTAATG | NM_004977 |
| KCNC4 | Kv3.4 | CACTGGGCTACGGAGACATGT | CACAGTGCCCCTACCAGCAT | NM_153763.2 |
| KCND1 | Kv4.1 | TTCTCCCTCTTGGGTGACCTT | GAACCTGAGATGATGCCAGATTT | NM_004979.4 |
| KCND2 | Kv4.2 | AAAACAATGACCTTAGTTACTCCATATGG | TGAATGACTATTGATGACTGTGTTAAGTG | NM_012281 |
| KCND3 | Kv4.3 | CCCATTGTACCCCTAGCACTGA | TGCCCCTTTGCTACCTCTTTT | NM_004980 |
| KCNF1 | Kv5.1 | GGCCCCTCAGGCAGAGA | ATGACATGCCTGCCACATCTAC | NM_002236.4 |
| KCNG1 | Kv6.1 | CCCCTATGTGTGTTTCCCTCAA | GGCATGTTATTTGCATGGTGAA | NM_002237.3 |
| KCNG2 | Kv6.2 | AAGCTCTTCGCCTGCGTGTC | CAGCAGCAGCGACACGTAGAAC | NM_012283.1 |
| KCNG4 | Kv6.3 | TCCTGAGCGGGATCCTCAT | CTGAAGCTGCTCCTGCTCCTT | NM_133490.2 |
| KCNV1 | Kv8.1 | GGGAATCCCAAAACTGCTTAGA | TGAAGATGTGCAATTGTTGAAGTCT | NM_014379.2 |
| KCNS1 | Kv9.1 | CTGCGTGTAGCACCCTTATGG | TGGAAGCCGTCGGGTTT | NM_002251.3 |
| KCNS2 | Kv9.2 | CTACGTTAGCCGGGAGGACTT | CACAAGAGGCAGCTCAGCAA | NM_020697.2 |
| KCNS3 | Kv9.3 | GAGCGATCCTGACTCCACAGA | CCAAGGAGGTGGTGTTACAAATG | NM_002252 |
| KCNG3 | Kv10.1 | TCTTCACACATCTCTGGGTTCTGA | CAGCATGACAATGACAAAGAAGTG | NM_172344.1 |
| KCNH2 | Kv11.1 | TGAGGGCATTAGCTGGTCTAACT | GCAGTAAATAGCAGAAAAGTCCTTGA | NM_172057 |
| KCNH6 | Kv11.2 | TGTCAAGGAGTTCATCCGCTTCCA | CTTCAGCACCGCGTTCATGTCAAT | NM_030779 |
| KCNH7 | Kv11.3 | AAACTGCAGACACCACGCATCAAC | TGACCAACAGCAGGATAAGCCAGT | NM_033272 |
| β-Actin | GGCTTGACTCAGGATTTAAAAACTG | ACCGACTGCTGTCACCTTCAC | NM_001101 |
Subcellular Fractionation, Overexpression, and Immunoblotting
Min6 or αTC-6 cells were subjected to subcellular fractionation using the Qproteome cell compartment kit (Qiagen). Differential speed centrifugation of lysates was implemented to obtain the subcellular fractions. The supernatant from the 1000 × g centrifugation contained cytosolic proteins and that from the 6000 × g centrifugation contained membrane proteins.
MIN6 cells were seeded on a 6-well plate and were transfected with 1.6 μg of recombinant human Erg (9) using Lipofectamine 2000 according to the manufacturer's instructions. Total lysates were prepared in lysis buffer (Cell Signaling Technology) supplemented with 1 mm phenylmethylsulfonyl fluoride.
Both fraction and lysate samples were prepared in 2× Laemmli sample buffer (4% SDS, 20% glycerol, 10% 2-mercaptoethanol, 0.004% bromphenol blue, 0.125 m Tris-HCl), separated in a 10% SDS-PAGE gel, transferred to polyvinylidene difluoride membranes, and immunoblotted using 1:200 anti-ERG1 (Chemicon International, 130 kDa) or 1:2000 anti-β-actin (Sigma, 43 kDa) or 1:2500 anti-Tim23 (BD Transduction Laboratories, 23 kDa) antibodies. Detection of ECL (Amersham Biosciences) signal was performed using x-ray film.
siRNA Transfection
MIN6 cells were seeded on 12-well plates and at 80% confluency were transfected with 100 nm scramble siRNAs or siRNAs against mouse kcnh2 (5′-CGCAAACUGUCAUUCCGCAtt, 3′-UGCGGAAUGACAGUUUGCGct, Ambion) using Lipofectamine 2000 (Invitrogen) according to the manufacturer's instructions. After 48 h of transfection, cells were used for RNA isolation followed by real-time PCR or reseeded on coverslips for voltage clamp measurements.
Electrophysiology
Total Kv currents were recorded using a whole cell patch clamp. The pipette solution contained (mm): KCl, 140; CaCl2, 1; MgCl2, 1; HEPES, 10; EGTA, 10, pH 7.3. Bath solution contained (mm): NaCl, 135; KCl, 5.4; CaCl2, 1; MgCl2, 1.2; HEPES, 10; glucose, 2, pH 7.3. Cells were stimulated by a series of 20-mV depolarization steps of 500 ms from a holding potential of −70 mV. An inward tail current protocol was used to record Erg currents. Currents were elicited by a series of 500-ms pulses applied between 40 mV and −120 mV following a 5-s preconditioning step at 50 mV. A 20-s interval was applied between each pulse. Potassium and sodium concentrations were also adjusted respectively to 40 mm and 102 mm for tail current recordings. rBeKm1-sensitive current (Erg1 current) was calculated by subtracting the traces obtained with blocker to recordings performed in control conditions. Then, the potential dependence curve of Erg1 inactivation was obtained by normalizing the Erg1 current to the maximum current and plotted against the applied potential. V½ and slope were defined with a Boltzmann sigmoid function. The access resistance (≤25 mΩ) was carefully monitored during the recordings. For Kv current measurements, steady-state current was analyzed during the last 5% of depolarization. All voltage recordings were amplified (Axopatch 200B, Axon Instruments, Foster City, CA; Heka EPC9, Heka Electronic inc, Mahone Bay, Nova Scotia, Canada) and then digitized and analyzed using pClamp9.0 or Pulse software. The electrophysiological values were not corrected with the junction potential. GFP-positive cells were selected for β-cells recordings. Small GFP-negative cells with a membrane capacity inferior of 3 picofarads (pF) were used for α-cells recordings. Area under the curve (AUC) of Erg1 current was calculated with a trapezoidal integration in Igor Pro software (Wavemetrics, Inc.) over a period of 100 ms following the onset of the Erg1 current. At the end of each recording session, tetraethylammonium (20 mm) was used to block the K+ current to confirm that we were observing the delayed rectifying K+ current (data not shown).
Calcium Imaging
Changes in [Ca2+]i concentrations were assessed using Fura-2 AM. Cells were plated on glass coverslips (diameter: 22 mm; thickness: 0.17 mm) and left in a humidified incubator for 12 h. Before the imaging experiment, cells were loaded with 2 μm Fura-2 AM in a bath solution (0 mm glucose) at 37 °C for 50 min. Cells were washed and placed in a chamber on the microscope stage, perifused with bath solution at 1 ml/min at 37 °C. Experiments were performed using a BX51W1 microscope (Olympus, Tokyo, Japan) with a ×20/0.95 water immersion objective and cooled charge-coupled device camera. Dual excitation at 340/380 nm was used and emission at 510 nm measured (ImageMaster 3 software, Photon Technology International, London, Ontario, Canada). 300-ms exposures were taken every 3 s. AUC of the Fura-2 AM ratio was calculated with a trapezoidal integration in Igor Pro software (Wavemetrics, Inc.) and normalized to the time. Only cells displaying a response to 30 mm KCl solution were included.
Insulin and Glucagon Secretion Assay
Fresh isolated mouse islets (20/vial) were preincubated for 60 and 30 min in a glucose-free Krebs-Ringer HEPES buffer (125 mm NaCl, 5.9 mm KCl, 1.28 mm CaCl2, 5.0 mm NaCO3, 25 mm HEPES, and 0.1% (w/v) bovine serum albumin, KRB). The islets were then incubated for 90 min in 2.7, 11.1, and 20 mm glucose KRB in the presence or absence of Erg channel blockers. Human islets were hand-picked and incubated for 12–24 h in a 37 °C humidified incubator under a 5% CO2 atmosphere. Then, the same insulin secretion protocol described above was used. MIN6 cells were seeded into 24-well plates and incubated for 48–72 h before glucose-stimulated insulin secretion studies were performed. Cells were preincubated for 1 h in glucose-free KRB followed by 1-h secretion in KRB containing 1 mm or 16 mm glucose. The supernatant of the cells was collected and centrifuged at 3000 × g for 5 min to remove cell debris and insulin, and glucagon was measured by radioimmunoassay as described previously (29). The cell pellets were lysed with acid ethanol (75% ethanol containing 1.5% (v/v) HCl). The samples were dried with a centriVap centrifugal vacuum concentrators connected to a cold trap and a pump (Labconco, Kansas City, MO). DNA was redissolved in 50 μl of ultrapure water and quantified with the BioPhotometer Plus spectrophotometer (Eppendorf, Hamburg. Germany). The insulin and glucagon secretion were normalized to DNA content.
Islet Perifusion
100 isolated islets were incubated for 24 h. The day of the experiment, islets were preincubated in low glucose (3 mm) RPMI media for 2 h. The perifusion experiment started with a 3 mm glucose KRB buffer incubation. After 20 min, glucose was increased to 11 mm for 15 min. Then 11 mm glucose KRB with or without rBeKm1 was applied for 13 min. Finally, islets were incubated in KCl (30 mm for 15 min). Aliquots of KRB solution were collected every minute using a flow rate of 1 ml/min. Insulin in the samples was measured using the Linco Research RIA kit and normalized to DNA content.
Statistical Analysis
Grouped results were analyzed using a Student's t test, and a value of p < 0.05 was considered statistically significant. The n values indicate number of independent observations.
RESULTS
Expression of Erg1, -2, and -3 in α-TC6 and MIN6 Cell Lines and Mouse and Human Pancreatic Islets
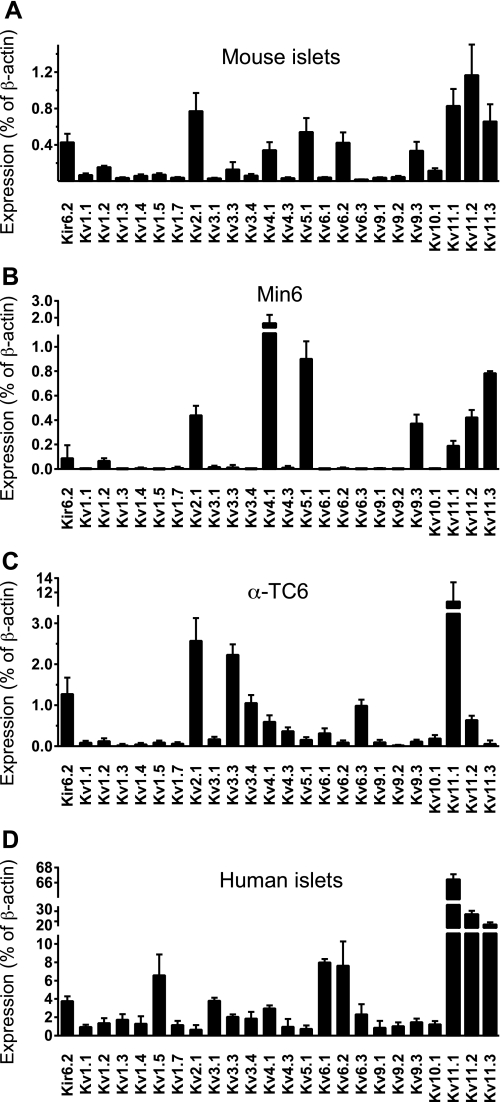
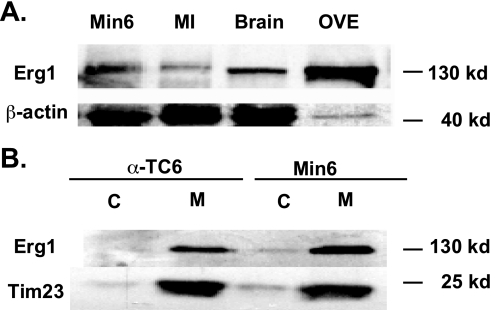
We performed a qPCR profile of Kv channel expression in Min6 and α-TC6 cell lines and in human and mouse islets (Fig. 1). In mouse islets (Fig. 1A), Kv2.1, -4.1, -5.1, -6.2, and -9.3 in addition to Kv11.1–11.3 were highly expressed. Kv11.1, -11.2, and -11.3 correspond to Erg1, -2, and -3, respectively. Similar results were obtained from Min6 cells (Fig. 1B), with the exception of Kv6.2, which was not expressed. α-TC6 cells displayed high expression of Kv2.1, -3.3, -3.4, -4.1, -4.3, -5.1, -6.1, -6.3, and -11.1, with some expression of Kv11.2 (Fig. 1C). Expression of Kv11.1 dominated, as it was almost five times higher than the Kv2.1 expression. In human islets (Fig. 1D), we detected high expression of Kv1.5, -6.1, -6.2, and the Kv11 isoforms. Nevertheless, the Kv11.1 channel isoform was expressed the highest. Because Erg1 was highly expressed at the transcript level in α-TC6, Min6 cells, mouse, and human islets, we confirmed its protein expression by Western blot. A band corresponding to Erg1 channel (130 kDa) was detected in the protein lysates of Min6 cells and mouse islets (Fig. 2A). Subcellular fractionation confirmed that Erg1 was expressed at the plasma membrane in Min6 and α-TC6 cells and was absent from the cytosol (Fig. 2B).
FIGURE 1.
qPCR analysis of Kv and Erg channel isoforms in mouse pancreatic islets (A), Min6 cells (B), α-TC6 (C), and human pancreatic islets (D) (n = 3). Transcript levels were expressed as a percentage of β-actin. Kv2.1 (delayed rectifying potassium channels) and Kir6.2 (KATP channels) transcript levels were measured for comparison with Erg channel isoforms. Error bars represent ±S.E.
FIGURE 2.
Protein expression of Erg1 channel isoform in Min6 cells, α-TC6 cells, mouse islets (MI), and brain. A, Erg1 expression was detected in protein lysate of Min6 (n = 10) and mouse islet (MI, n = 5). Min6 cells overexpressing the human Erg isoform (OVE) and brain lysate (n = 3) were also used as a positive control. β-Actin was used as a loading control. B, expression of the Erg1 channel isoform was detected in the membrane (M) fraction of Min6 (n = 3) cells, and α-TC6 (n = 3) and was absent from the cytosolic fraction (C).
Blockage of Erg1 Current in α-TC6 and MIN6 Cell Lines and Dispersed Mouse α- and β-Cells
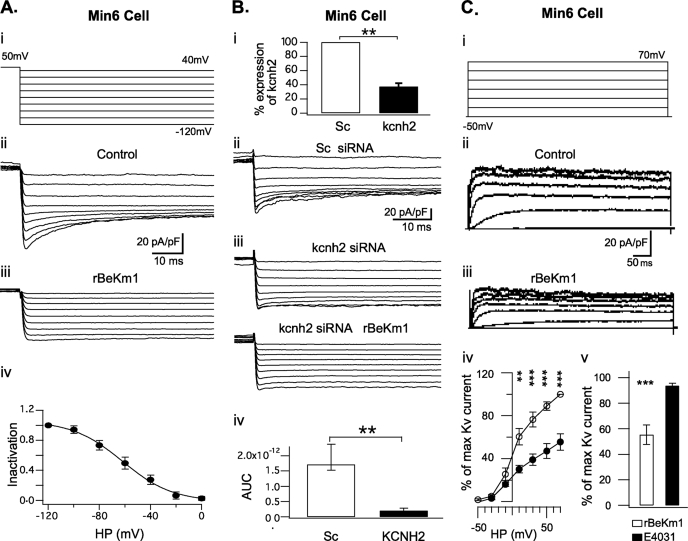
E4031 is reported to block Erg1, -2, and -3 channel isoforms with an EC50 of 100 nm while rBeKm-1 and rErgTx-1 specifically blocks Erg1 with an EC50 of 2 nm and 76 nm, respectively (3, 4, 7, 8, 30, 31). These three antagonists were used to identify Erg channels and define their participation in the total K+ current in Min6 cells, α-TC6 cells, and in dispersed islet β- and α-cells. Electrophysiological whole cell recordings were performed with a high extracellular K+ concentration to amplify Erg currents (9, 24, 30, 32). Min6 cells held at −50 mV were clamped for 5 s to 50 mV. Then, 0.5-s voltage steps were applied from −120 mV to 40 mV and elicited an inward tail current (n = 16; Fig 3, A (ii) and B (ii)). At −120 mV, the maximum tail current amplitude recorded was 28.81 ± 3.11 pA/pF. Tail currents obtained with each ramp were subsequently blocked by 100 nm of rBeKm1 (Fig. 3A (iii); n = 4). In addition, the current voltage relationship of Erg1 was assessed with an inactivation curve obtained by extrapolating the Erg current amplitude from the control and Erg1 channel blocker conditions. This is showing a maximum Erg1 current at −120 mV and its progressive decrease with depolarization (Fig. 3A (iv)). A Boltzmann sigmoid function was used to fit the curve and displayed a V½ of −61.86 ± 6.6 mV and slope of 19.37 ± 2.
FIGURE 3.
Whole cell recordings of Erg1 tail current in Min6 cells. Representative whole cell recording of Erg1 tail current in Min6 cells (A (ii) and B (ii)) obtained with a double pulse tail current protocol (A (i)). Tail currents were completely blocked in presence of 100 nm rBeKm1 (n = 4; A (iii)). The inactivation curve was obtained by normalizing the data to the maximum current and plotted against the applied potential (A (iv), n = 3). Data points represent the mean ± S.E. MIN6 cells were transfected with 100 nm scramble siRNA (Sc) or siRNA against kcnh2 (kcnh2) and tested with the double pulse voltage clamp protocol described above (B (ii and iii)). rBeKm1 was also applied on siRNA kcnh2-transfected cells (B (iii), bottom traces). Quantitative PCR analysis was performed 48 h post transfection and confirmed a substantial decrease of the kcnh2 gene expression of Min6 cells treated with kcnh2 siRNAs (B (i), n = 3, **, p < 0.01 versus Sc). Area under the curve (AUC), including the maximum tail current (−120 mV), was calculated on scramble siRNA Min6 cells over a period of 70 ms (n = 8). A similar calculation was done on siRNA kcnh2-transfected cells and showed a complete loss of the Erg1 current (B (iv), n = 8, **, p < 0.01). Representative whole cell recordings of K+ outward currents recorded in Min6 cells during control condition (C (ii)) and application of rBeKm1 (50 nm, C (iii)). Cells were depolarized for 500 ms with increments of 20 mV from a holding potential of −70 mV (C (i)). I/V curves were obtained by normalizing the data to the maximum current and plotted against the applied potential. Data points represent the mean ± S.E. Control K+ outward currents (○) were compared with K+ current obtained in presence of 50 nm rBeKm1 (•) in Min6 cells (C (iv), n = 6). Bar graphs show the K+ outward current amplitude obtained with 50 nm rBeKm1 and 1 μm E4031 at a potential of 70 mV (C (v)). Error bars represent ±S.E. (**, p < 0.01; ***, p < 0.001).
In Min6 cells, siRNA was used to suppress Erg1 expression. Min6 cells transfected with scramble siRNA were considered as a control group and kcnh2 siRNAs decreased the expression of Erg1 channels. qPCR confirmed that kcnh2 expression was decreased to 37.4 ± 4.63% relative to control (Fig. 3B (i); n = 3). 72 h after transfection, whole cell patch clamp recordings were performed. In the control group, whole cell recordings evidenced Erg1 tail current in 9 of 10 Min6 cells (Fig. 3B (ii); 1.71e−12 ± 0.42 AUC unit). Transfection with kcnh2 siRNA reduced the Erg1 current in 8 of 13 Min6 cells (p < 0.01; Fig. 3B (iii and iv); 1.97e−13 ± 0.87 AUC unit). To address the specificity of rBekm1, this drug was used on Min6 cells treated with kcnh2 siRNA, where it did not further decrease tail current, nor did it elicit any effects on K+ currents, thus, demonstrating the specificity of the antagonist (Fig. 3B (iii); n = 2). In Min6 cells, the outward K+ current was activated above −30 mV (Fig. 3C (ii)). From above 10 mV, rBekm1 (50 nm) decreased the K+ current (p < 0.01; n = 6; Fig. 3C (iii and iv)). Maximal inhibition with rBeKm1 was observed at 70 mV where the K+ current was 55.4 ± 7.67% of the control (p < 0.001; n = 6; Fig. 3C (iv)). Nevertheless, E4031 (1 μm) did not induce any significant decrease in the outward K+ current (Fig. 3C (v)).
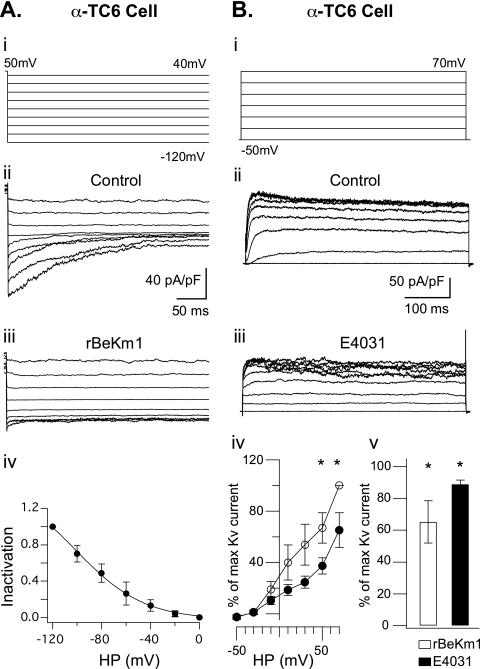
In α-TC6 cells, the double pulse protocol described above elicited an inward tail current (Fig. 4A (ii); n = 7). At −120 mV, the maximum tail current amplitude recorded was 23.07 ± 12.45 pA/pF. This was also blocked by 100 nm rBeKm1 (Fig. 4A (iii); n = 3) or rErgTx-1 (supplemental Fig. S1; n = 3). The current-voltage relationship showed a maximum current at −120 mV and a progressive inactivation of the Erg1 current produced by depolarization (Fig. 4A (iv)). A Boltzmann sigmoid function was fit to the inactivation curve and displayed a V½ of −84.9 ± 10.68 mV and a slope of 11.4 ± 3.4 (Fig. 4A (iv); n = 3). The outward K+ current displayed a similar activation as the previously described cell types. rBeKm1 (50 nm) significantly decreased the outward K+ current from a holding potential above 50 mV (Fig. 4B (iv)). Maximal inhibition was obtained at 70 mV with an outward K+ current at 65.31 ± 13.38% of the control (p < 0.05; n = 8; Fig. 4B (iv)). At this holding potential, E4031 (1 μm) also decreased the outward K+ current (p < 0.05; n = 3; Fig. 4B (iii and iv)).
FIGURE 4.
Whole cell recordings of Erg1 tail current in α-TC6 cells. Representative whole cell recording of Erg1 tail current in α-TC6 cells (A (ii), n = 4) obtained with a double pulse tail current protocol (A (i)). Tail currents were completely blocked in presence of 100 nm rBeKm1 (n = 4; A (iii)). The inactivation curve was obtained by normalizing the data to the maximum current and plotted against the applied potential (A (iv), n = 3). Data points represent the mean ± S.E. Representative whole cell recordings of K+ outward currents recorded in α-TC6 cells during control condition (B (ii)) and application of E4031 (1 μM, B (iii)). Cells were depolarized for 500 ms with increments of 20 mV from a holding potential of −70 mV (B (i)). I/V curves were obtained by normalizing the data to the maximum current and plotted against the applied potential. Data points represent the mean ± S.E. Control K+ outward currents (○) were compared with K+ current obtained in presence of 50 nm rBeKm1 (•) in α-TC6 cells (B (iv); n = 6). Bar graphs show the K+ outward current amplitude obtained with 50 nm rBeKm1 and 1 μm E4031 at a potential of 70 mV (B (v)). Error bars represent ±S.E. (*, p < 0.05).
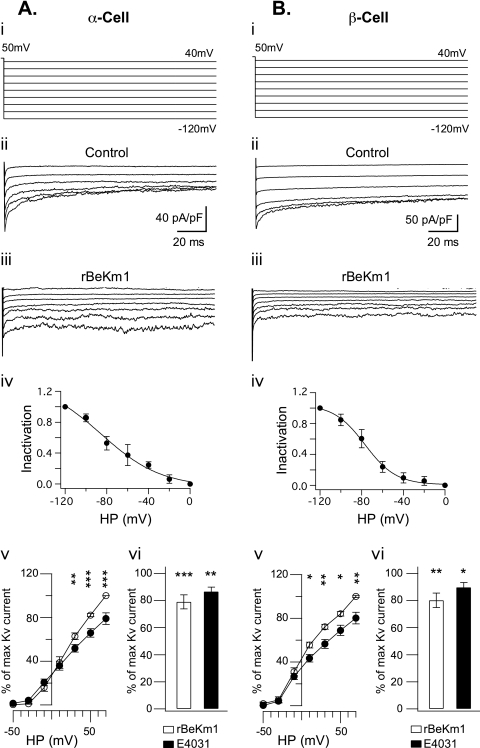
Dispersed mouse islet cells were also recorded with a double pulse protocol (Fig. 5A (i) and B (i)). Tail currents were successfully obtained in α-cells (Fig. 5A (ii); n = 8) and β-cells (Fig. 5B (ii); n = 9). Consistent with data obtained in cell lines, tail currents in α-cells (n = 3) and in β-cells (n = 6) were completely abolished with rBeKm1 (Fig. 5, A (iii) and B (iii)) and ErgTx-1 (supplemental Fig. S1). The voltage dependence of Erg1 current inactivation was established and also showed an inactivation-dependent on depolarization in α- and β-cells. In β-cells, a V½ and slope of −80.86 ± 7.11 and 17.55 ± 6 mV, respectively, characterized the Boltzmann fitting curve (Fig. 5B (iv)). In α-cells, the V½ and slope were, respectively, −75.95 ± 9.04 and 26.5 ± 1.49 mV (Fig. 5A (iv)). The maximum tail currents recorded in α- and β-cells at −120 mV were 48.11 ± 19.64 pA/pF and 80.2 ± 19.54 pA/pF, respectively. In dispersed mouse α-cells, rBekm1 produced a significant decrease in the outward K+ current observed at voltage between 30 and 70 mV (Fig. 5A (v)). Maximal inhibition of 78.98 ± 5.26% of the control current was obtained with a holding potential of 70 mV (p < 0.001, n = 11, Fig. 5A (v)). E4031 also significantly blocked the outward K+ current at a potential of 70 mV (p < 0.01, n = 5, Fig. 5A (vi)). In β-cells, the outward K+ current was also activated from a holding potential of greater than −30 mV and reached a maximum at 70 mV (Fig. 5B (v)). rBeKm1 produced a significant decrease of the outward K+ current starting at a holding potential of 10–70 mV (Fig. 5B (v)). Maximal inhibition of the K+ current was obtained at 70 mV (80.12 ± 5.38% of the control, p < 0.01, n = 9, Fig. 5B (v)). E4031 (1 μm) decreased the K+ current at this holding potential (Fig. 5B (vi)).
FIGURE 5.
Whole cell recordings of Erg1 tail current in mouse α and β-cells. Representative whole cell recording of Erg1 tail current in α-cells (n = 8, A (ii)) and β-cells (n = 9, B (ii)) obtained with a double pulse current protocol (A (i) and B (i)). Tail currents were completely blocked in presence of 100 nm rBeKm1 in α-cells (n = 3, A (iii)) and β-cells (n = 3, B (iii)). The inactivation curve was obtained by normalizing the data to the maximum current and plotted against the applied potential (A (iv) and B (iv), n = 3). Data points represent the mean ± S.E. Only traces corresponding to pulses ranging from −120 and −20 mV are shown. K+ outward current were recorded and I/V curves of K+ outward currents calculated in dispersed α-cells (n = 11, A (v)) and β-cells (n = 9, B (v)) during control condition (○) and application of rBeKm1 (50 nm, •). Data points represent the mean ± S.E. Bar graphs show the K+ outward current obtained with 50 nm rBeKm1 and 1 μm E4031 at a potential of 70 mV (A (vi) and B (vi)). Error bars represent ±S.E. (*, p < 0.05; **, p < 0.01; and ***, p < 0.001).
The Effect of Erg Blockers on the [Ca2+]i in Min6 and α-TC6 Cells, Dispersed Islet β- and α-Cells
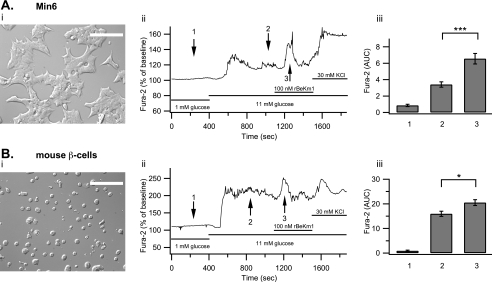
The effect of rBeKm1 on the [Ca2+]i in pancreatic cells was studied to better understand the role of Erg channels in calcium homeostasis. Min6 cells were stimulated with 11 mm glucose, which increased [Ca2+]i from 0.86 ± 0.14 to 3.40 ± 0.32 AUC units. In most of the Min6 cells imaged (93%), rBeKm1 produced an additional [Ca2+]i increase (AUC: 6.55 ± 0.64, p < 0.05) that lasted for 189 ± 8.4 s (Fig. 6A (ii and iii)).
FIGURE 6.
Effect of rBekm1 on [Ca2+]i of Min6 cells and dispersed mouse islet β-cells. Min6 cells on coverslips were studied (A (i)). Representative trace of a Min6 cell studied with the protocol mentioned above (A (ii)). The bar graph shows the average AUC in the presence of 1 mm glucose (1), 11 mm glucose (2), or rBeKm1 (3) (A (iii), n = 15). Pancreatic islets from wild-type CD1 mice were dispersed and seeded on coverslips (B (i)). Representative trace of a β-cell (loaded with Fura-2 AM) perifused with a 1 mm glucose solution and then stimulated with 11 mm glucose. rBekm1 (100 nm) was added after 1100 s. At the end of the experiment, extracellular K+ was increased to 30 mm (B (ii)). The bar graph shows the average Ca2+ signal for 1 mm glucose (1), 11 mm glucose (2), and rBeKm1 (3) (B (iii), n = 6). Error bars represent ±S.E. (*, p < 0.05; ***, p < 0.001). Horizontal bars represent perifusion with the corresponding reagents. Scale bar: 50 μm.
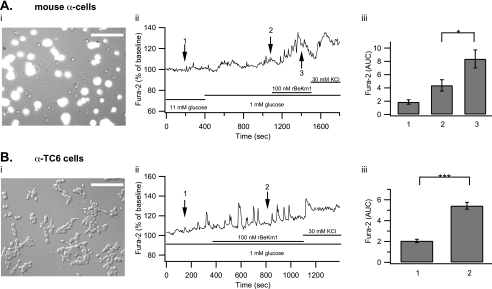
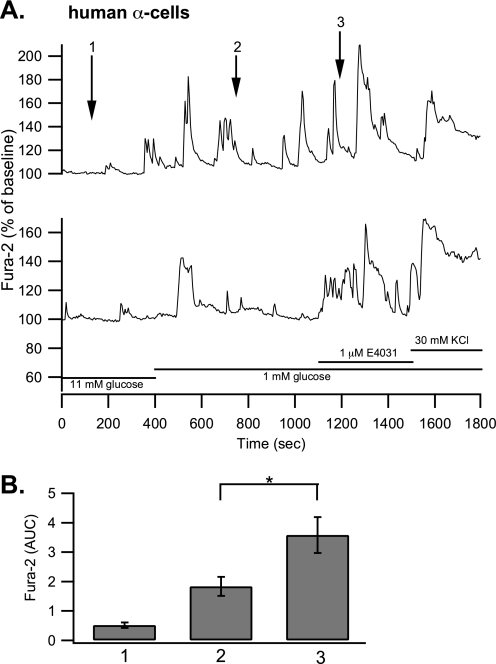
Using the same protocol, mouse β-cells were stimulated with 11 mm glucose, which increased [Ca2+]i from 0.9 ± 0.27 to 15.94 ± 1.05 AUC units. rBeKm1 (100 nm) was applied 700 s after the beginning of the 11 mm glucose stimulation. This Erg1 channel blocker induced an additional [Ca2+]i increase (AUC: 20.5 ± 1.2, p < 0.05), which lasted for 280 ± 34.5 s (Fig. 6B (ii and iii), n = 5). Because the average amount of α-cells (10–18%) is significantly higher than that of δ-cells (5–10%) (33) and δ-cells increase their [Ca2+]i in response to glucose (34, 35), we can suppose that the majority of traces obtained from GFP-negative cells reflect α-cell responses. When α-cells were stimulated with 1 mm glucose, they responded by increasing their [Ca2+]i from 1.87 ± 0.33 to 4.38 ± 0.84 AUC units. Application of rBeKm1 significantly increased the [Ca2+]i in only a minority of α-cells (5 of 15, AUC: 8.36 ± 1.35, p < 0.05; Fig. 7A (ii and iii)). This [Ca2+]i increase was sustained for 371 ± 15 s. A similar effect was found on α-TC6 cells as [Ca2+]i increased from 2.06 ± 0.15 to 5.42 ± 0.33 AUC units when rBeKm1 (100 nm) was applied (n = 19, p < 0.001, Fig. 7B (ii and iii)). Human islets were dispersed and cells were plated on coverslips. Human α-cells were stimulated with a 1 mm glucose solution, which increased [Ca2+]i from 0.5 ± 0.09 to 1.84 ± 0.32 AUC unit. E4031 (1 μm) produced a significant increase of the [Ca2+]i in 8 of 22 α-cells imaged (3.58 ± 0.60, p < 0.05, Fig. 8, A and B). This [Ca2+]i increase was sustained for a period of 327.5 ± 25.36 s.
FIGURE 7.
Effect of rBekm1 on [Ca2+]i in dispersed mouse islet α-cells and α-TC6 cells. Pancreatic islets from CD1 MIP-GFP mice were dispersed and seeded on coverslips. Cells were loaded with Fura-2 AM. The bright field view is superimposed to the GFP signal to allow localization of GFP-negative α-cells (A (i)). A representative trace of an α-cell perifused with 11 mm glucose and then stimulated with a 1 mm glucose solution. rBekm1 (100 nm) was added after 1100 s. At the end of the experiment, extracellular K+ was increased to 30 mm (A (ii)). The bar graph shows the average AUC in the presence of 11 mm glucose (1), 1 mm glucose (2), and rBeKm1 (3) (A (iii), n = 5). α-TC6 cells on a coverslip (B (i)). Representative trace of an α-TC6 cell incubated with rBekm1 (100 nm; B (ii)). The bar graph shows the average AUC in the presence of 1 mm glucose (1) and the rBeKm1 (2) (B (iii), n = 19). Error bars represent ±S.E. (*, p < 0.05; ***, p < 0.001). Horizontal bars represent perifusion with the corresponding reagents. Scale bar: 50 μm.
FIGURE 8.
Effect of E4031 on [Ca2+]i of dispersed human islet α-cells. Two representative traces of two distinct α-cells perifused with 11 mm glucose solution. The cells were stimulated with a 1 mm glucose solution. E4031 (1 μm) was added after 1100 s. At the end of the experiment, extracellular K+ was increased to 30 mm (A). The bar graph shows the average AUC in the presence of 11 mm glucose (1), 1 mm glucose (2), and E4031 (3) (B, n = 8). Error bars represent ±S.E. (*, p < 0.05). Horizontal bars represent perifusion with the corresponding reagents.
The Effect of rBeKm1 and E4031 on the Insulin and Glucagon Secretion of Isolated Islets and Min6 Cells
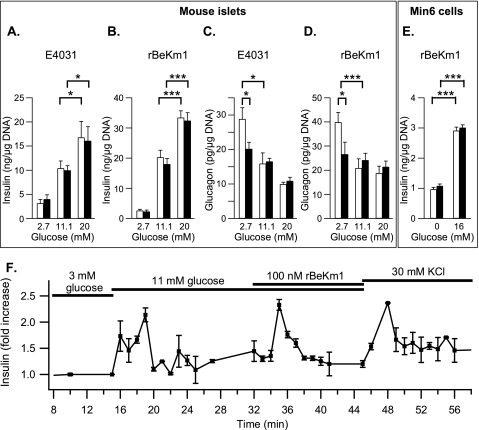
We studied the effect of Erg channel blockers on glucose-stimulated insulin secretion from isolated mouse islets. Insulin secretion was 33.41 ± 2.28 ng/μg DNA following 20 mm glucose stimulation (Fig. 9B, n = 9). E4031 (1 μm) or rBekm1 (100 nm) did not modify basal or glucose-stimulated insulin secretion from mouse islets (Fig. 9, A and B, n = 4 and 7, respectively). Glucose-stimulated insulin secretion from Min6 cells was also not affected by 100 nm rBeKm1 (Fig. 9E, n = 2). To further explore more temporal and dynamic changes in insulin secretion, the effect of rBeKm1 (100 nm) was also assessed by islet perifusion. Interestingly, when rBeKm1 was applied during perifusion with 11 mm glucose, insulin secretion increased over a period of 280 ± 20 s by 2.33 ± 0.1-fold compared with the secretion produced by 11 mm alone (Fig. 9F; n = 3). These data show a transient effect of Erg channel blockade on insulin secretion, which correlated well with the time course of the rBeKm1 effect on [Ca2+]i.
FIGURE 9.
Effect of Erg channel blockers on the glucose-stimulated insulin/glucagon secretion from isolated mouse islets and Min6 cells. CD1 MIP-GFP isolated islets were stimulated with 2.7, 11.1, and 20 mm glucose (A–D) and Min6 cells with 0 or 16 mm glucose (E). Secretion experiments were performed in the presence (dark bars) or in the absence of Erg channel blocker (white bars). The effect of E4031 (1 μm) and rBeKm1 (100 nm) on the glucose-stimulated insulin secretion from mouse isolated islets was determined (A, n = 4; B, n = 9). The effect of rBekm1 on the insulin secretion from Min6 cells was also determined (E; n = 2). The effect of E4031 (1 μm) and rBeKm1 (100 nm) on glucagon secretion from isolated mouse islets was studied (C, n = 8; D, n = 24). Error bars represent ±S.E. (*, p < 0.05; ***, p < 0.001). Representative trace of three islet perifusion experiments showing the rBeKm1 stimulatory effect on the insulin secretion (F). Horizontal bars represent perifusion with the corresponding reagents.
We also used 2.7, 11.1, and 20 mm glucose to study the glucagon secretion from mouse islets. At 2.7 mm glucose, islets secreted 39.8 ± 4.1 pg/μg DNA (Fig. 9D). The glucagon secretion was decreased by ∼50% when the concentration of glucose was increased to 11 mm (p < 0.05, Fig. 9C, n = 8, p < 0.001, and Fig. 9D, n = 23). At 2.7 mm, E4031 (1 μm) decreased glucagon secretion by ∼30% (28.81 ± 3.32 pg/μg DNA to 20.17 ± 1.92 pg/μg DNA; p < 0.05; Fig. 9C; n = 8). At 11.1 and 20 mm glucose, glucagon secretion was unchanged by addition of E4031 (Fig. 9C). This inhibition of glucagon secretion by Erg1,2,3 channel blocker was confirmed with, rBeKm1, which also decreased low-glucose stimulated glucagon secretion from isolated islets from 39.8 ± 4.1 pg/μg DNA to 26.59 ± 5 pg/μg DNA (p < 0.05; Fig. 9D; n = 24). Incubation with rBeKm1 at higher glucose concentrations had no effect on glucagon secretion (Fig. 9D).
DISCUSSION
In pancreatic β-cells, glucose stimulates ATP production, which induces the closure of KATP channels and causes depolarization of the plasma membrane (36–38). The subsequent influx of calcium, which occurs during action potential firing, triggers insulin exocytosis (39–41). Depolarization of the membrane also opens Kv channels, which repolarize the action potentials. We have previously demonstrated that the Kv2.1-delayed rectifying K+ channels are primary mediators of β-cell repolarization and have a predominant role in regulating insulin secretion (19, 20, 42, 43). Recent examination of Kv2.1-null islets, however, suggests an important role for additional Kv channel isoforms in the regulation of insulin secretion (44). Therefore, we performed a qPCR screen of Kv channel isoforms in a β-cell line and primary islets, identifying Erg channels, particularly Erg1, as being highly expressed in these tissues.
Patch clamp electrophysiology, coupled with the use of gene silencing and Erg channel antagonism, clearly demonstrates the functional expression of Erg1 channels in β-cells and Min6 cells. Calcium imaging also provided evidence of a rBeKm1-dependent [Ca2+]i increase in β-cells and Min6 cells. Therefore, these data support an involvement of Erg1 channels in the repolarization of β-cells. Moreover, blocking Erg1 channels translated into increased insulin secretion, confirming Erg1 channel involvement in β-cell physiology. The apparent lack of an effect of Erg1 channel antagonists during a static (90 min) insulin secretion experiment could be explained by the transient effect of the rBeKm1 seen in the perifusion experiment. Furthermore, this suggests the involvement of Erg1 channels in β-cell excitability, and in particularly during the early electrical and secretory responses to glucose stimulation. This is largely in agreement with previous reports (24, 32).
In glucagon-secreting α-TC6 cells and primary mouse islet α-cells, our patch clamp and calcium imaging studies also support a role of Erg1 channels in regulating the membrane potential. To date, only tetraethylammonium-sensitive delayed rectifying K+ channels and “A type” transient outward K+ channels have been identified in mouse α-cells (23, 45, 46). In α-cells it is well known that, even at low glucose, a large proportion of KATP channels are already closed (47–49). Although contentious, it has been proposed that this holds α-cells at an “intermediate” membrane potential that allows regenerative electrical activity and [Ca2+]i increases (36) causing the release of glucagon. Thus it may be thought that inhibition of Erg in the present study will augment that electrical activity at low glucose, increase [Ca2+]i, and enhance glucagon secretion, Indeed Erg1 channel blockage increased [Ca2+]i only transiently in a minority of α-cells. This was insufficient to translate into increased glucagon secretion, but rather resulted in the inhibition of glucagon secretion. Thus, Erg1 may play a different role in pancreatic α-cells than in β-cells. This can be explained in the context of recent experiments suggesting that depolarization of α-cells can inhibit the activity of the Na+ and Ca2+ channels involved in α-cell AP generation, resulting in cessation of glucagon secretion (46, 48, 50, 51). Thus, if inhibition of Erg1 is sufficient to raise the basal membrane potential of α-cells to a point that impairs α-cell AP firing, this would prevent glucagon release. Support for this is suggested by the transient nature of the effect of rBeKm1 on α-cell Ca2+ signaling at low glucose, where Erg1 blockade is initially stimulatory, but then likely depolarizes the cell sufficiently to shut down action potential firing and Ca2+ entry. Therefore, α-cells treated with Erg blockers would progressively display Ca2+- and Na+-inactivated channels and as a consequence would secrete less glucagon compared with the control. These results suggest that Erg1 in α-cells are involved in controlling the resting membrane potential, perhaps in addition to their likely role in AP repolarization.
In conclusion, Erg1 K+ channels appear to be important for α- and β-cell function, although its role in these two cell types appears divergent. Whereas inhibition of Erg1 enhances secretion from β-cells under stimulatory (high glucose) conditions, inhibition of the channel in α-cells inhibits secretion under conditions (low glucose) that are stimulatory to that cell type. This is likely due to the differing mechanisms regulating AP generation in these cells and the potential role of Erg1 in the regulation of membrane potential in the face of low KATP conductance in α-cells. Furthermore, the present work suggests a possible therapeutic mechanism whereby inhibition of one channel sub-type could both raise insulin levels, but lower glucagon levels, which would be seen as highly beneficial to the treatment of diabetes.
Supplementary Material
Acknowledgments
We thank Dr. Robert Tsushima who provided human Erg expression plasmid and Dr. Emma Allister for her comments on the manuscript.
This work was supported by an operating grant from the Canadian Institutes of Health Research (MOP 49521 to M. B. W.).

The on-line version of this article (available at http://www.jbc.org) contains supplemental Fig. S1.
- Erg
- voltage-gated eag-related gene
- AP
- action potential
- MIP
- mouse insulin promoter
- AUC
- area under the curve
- [Ca2+]i
- intracellular calcium
- Fura-2 AM
- Fura-2 acetoxymethyl ester
- qPCR
- quantitative PCR
- GFP
- green fluorescent protein
- siRNA
- small interference RNA
- pF
- picofarad(s).
REFERENCES
- 1.Gutman G. A., Chandy K. G., Grissmer S., Lazdunski M., McKinnon D., Pardo L. A., Robertson G. A., Rudy B., Sanguinetti M. C., Stühmer W., Wang X. (2005) Pharmacol. Rev. 57, 473–508 [DOI] [PubMed] [Google Scholar]
- 2.Bauer C. K., Wulfsen I., Schäfer R., Glassmeier G., Wimmers S., Flitsch J., Lüdecke D. K., Schwarz J. R. (2003) Pflugers Arch. 445, 589–600 [DOI] [PubMed] [Google Scholar]
- 3.Shi W., Wymore R. S., Wang H. S., Pan Z., Cohen I. S., McKinnon D., Dixon J. E. (1997) J. Neurosci. 17, 9423–9432 [DOI] [PMC free article] [PubMed] [Google Scholar]
- 4.Filippov A. K., Kozlov S. A., Pluzhnikov K. A., Grishin E. V., Brown D. A. (1996) FEBS Lett. 384, 277–280 [DOI] [PubMed] [Google Scholar]
- 5.Restano-Cassulini R., Korolkova Y. V., Diochot S., Gurrola G., Guasti L., Possani L. D., Lazdunski M., Grishin E. V., Arcangeli A., Wanke E. (2006) Mol. Pharmacol. 69, 1673–1683 [DOI] [PubMed] [Google Scholar]
- 6.Sanguinetti M. C., Jurkiewicz N. K. (1990) Am. J. Physiol. 259, H1881–H1889 [DOI] [PubMed] [Google Scholar]
- 7.Wettwer E., Scholtysik G., Schaad A., Himmel H., Ravens U. (1991) J. Cardiovasc. Pharmacol. 17, 480–487 [DOI] [PubMed] [Google Scholar]
- 8.Liu S., Rasmusson R. L., Campbell D. L., Wang S., Strauss H. C. (1996) Biophys. J. 70, 2704–2715 [DOI] [PMC free article] [PubMed] [Google Scholar]
- 9.Sanguinetti M. C., Jiang C., Curran M. E., Keating M. T. (1995) Cell 81, 299–307 [DOI] [PubMed] [Google Scholar]
- 10.Royer A., Demolombe S., El Harchi A., Le Quang K., Piron J., Toumaniantz G., Mazurais D., Bellocq C., Lande G., Terrenoire C., Motoike H. K., Chevallier J. C., Loussouarn G., Clancy C. E., Escande D., Charpentier F. (2005) Cardiovasc. Res. 65, 128–137 [DOI] [PubMed] [Google Scholar]
- 11.Zaza A., Micheletti M., Brioschi A., Rocchetti M. (1997) J. Physiol. 505, 677–688 [DOI] [PMC free article] [PubMed] [Google Scholar]
- 12.Moss A. J., Zareba W., Kaufman E. S., Gartman E., Peterson D. R., Benhorin J., Towbin J. A., Keating M. T., Priori S. G., Schwartz P. J., Vincent G. M., Robinson J. L., Andrews M. L., Feng C., Hall W. J., Medina A., Zhang L., Wang Z. (2002) Circulation 105, 794–799 [DOI] [PubMed] [Google Scholar]
- 13.Pessia M., Servettini I., Panichi R., Guasti L., Grassi S., Arcangeli A., Wanke E., Pettorossi V. E. (2008) J. Physiol. 586, 4877–4890 [DOI] [PMC free article] [PubMed] [Google Scholar]
- 14.Schwarz J. R., Bauer C. K. (2004) J. Cell Mol. Med. 8, 22–30 [DOI] [PMC free article] [PubMed] [Google Scholar]
- 15.Yeung S. Y., Greenwood I. A. (2007) Am. J. Physiol. Cell Physiol. 292, C468–C476 [DOI] [PubMed] [Google Scholar]
- 16.Lecchi M., Redaelli E., Rosati B., Gurrola G., Florio T., Crociani O., Curia G., Cassulini R. R., Masi A., Arcangeli A., Olivotto M., Schettini G., Possani L. D., Wanke E. (2002) J. Neurosci. 22, 3414–3425 [DOI] [PMC free article] [PubMed] [Google Scholar]
- 17.Schledermann W., Wulfsen I., Schwarz J. R., Bauer C. K. (2001) J. Physiol. 532, 143–163 [DOI] [PMC free article] [PubMed] [Google Scholar]
- 18.Henquin J. C., Meissner H. P., Preissler M. (1979) Biochim. Biophys. Acta 587, 579–592 [DOI] [PubMed] [Google Scholar]
- 19.MacDonald P. E., Sewing S., Wang J., Joseph J. W., Smukler S. R., Sakellaropoulos G., Wang J., Saleh M. C., Chan C. B., Tsushima R. G., Salapatek A. M., Wheeler M. B. (2002) J. Biol. Chem. 277, 44938–44945 [DOI] [PubMed] [Google Scholar]
- 20.MacDonald P. E., Wheeler M. B. (2003) Diabetologia 46, 1046–1062 [DOI] [PubMed] [Google Scholar]
- 21.Braun M., Ramracheya R., Bengtsson M., Zhang Q., Karanauskaite J., Partridge C., Johnson P. R., Rorsman P. (2008) Diabetes 57, 1618–1628 [DOI] [PubMed] [Google Scholar]
- 22.Barg S., Galvanovskis J., Göpel S. O., Rorsman P., Eliasson L. (2000) Diabetes 49, 1500–1510 [DOI] [PubMed] [Google Scholar]
- 23.Leung Y. M., Ahmed I., Sheu L., Tsushima R. G., Diamant N. E., Hara M., Gaisano H. Y. (2005) Endocrinology 146, 4766–4775 [DOI] [PubMed] [Google Scholar]
- 24.Mühlbauer E., Bazwinsky I., Wolgast S., Klemenz A., Peschke E. (2007) Cell Mol. Life Sci. 64, 768–780 [DOI] [PMC free article] [PubMed] [Google Scholar]
- 25.Lacy P. E., Kostianovsky M. (1967) Diabetes 16, 35–39 [DOI] [PubMed] [Google Scholar]
- 26.Zhang C. Y., Baffy G., Perret P., Krauss S., Peroni O., Grujic D., Hagen T., Vidal-Puig A. J., Boss O., Kim Y. B., Zheng X. X., Wheeler M. B., Shulman G. I., Chan C. B., Lowell B. B. (2001) Cell 105, 745–755 [DOI] [PubMed] [Google Scholar]
- 27.Hara M., Wang X., Kawamura T., Bindokas V. P., Dizon R. F., Alcoser S. Y., Magnuson M. A., Bell G. I. (2003) Am. J. Physiol. Endocrinol. Metab. 284, E177–E183 [DOI] [PubMed] [Google Scholar]
- 28.O'Gorman D., Kin T., Murdoch T., Richer B., McGhee-Wilson D., Ryan E. A., Shapiro J. A., Lakey J. R. (2005) Transplantation 80, 801–806 [DOI] [PubMed] [Google Scholar]
- 29.Salehi A., Chen D., Håkanson R., Nordin G., Lundquist I. (1999) J. Physiol. 514, 579–591 [DOI] [PMC free article] [PubMed] [Google Scholar]
- 30.Korolkova Y. V., Kozlov S. A., Lipkin A. V., Pluzhnikov K. A., Hadley J. K., Filippov A. K., Brown D. A., Angelo K., Strøbaek D., Jespersen T., Olesen S. P., Jensen B. S., Grishin E. V. (2001) J. Biol. Chem. 276, 9868–9876 [DOI] [PubMed] [Google Scholar]
- 31.Gurrola G. B., Rosati B., Rocchetti M., Pimienta G., Zaza A., Arcangeli A., Olivotto M., Possani L. D., Wanke E. (1999) FASEB J. 13, 953–962 [PubMed] [Google Scholar]
- 32.Rosati B., Marchetti P., Crociani O., Lecchi M., Lupi R., Arcangeli A., Olivotto M., Wanke E. (2000) FASEB J. 14, 2601–2610 [DOI] [PubMed] [Google Scholar]
- 33.Gyulkhandanyan A. V., Lu H., Lee S. C., Bhattacharjee A., Wijesekara N., Fox J. E., MacDonald P. E., Chimienti F., Dai F. F., Wheeler M. B. (2008) J. Biol. Chem. 283, 10184–10197 [DOI] [PubMed] [Google Scholar]
- 34.Berts A., Ball A., Dryselius G., Gylfe E., Hellman B. (1996) Endocrinology 137, 693–697 [DOI] [PubMed] [Google Scholar]
- 35.Gomis A., Valdeolmillos M. (1998) Br. J. Pharmacol. 123, 443–448 [DOI] [PMC free article] [PubMed] [Google Scholar]
- 36.Ammälä C., Kane C., Cosgrove K. E., Chapman J. C., Aynsley-Green A., Lindley K. J., Dunne J. M. (1997) Digestion 58, Suppl. 2, 81–85 [DOI] [PubMed] [Google Scholar]
- 37.Rorsman P., Bokvist K., Ammälä C., Eliasson L., Renström E., Gäbel J. (1994) Diabete Metab. 20, 138–145 [PubMed] [Google Scholar]
- 38.Rajan A. S., Aguilar-Bryan L., Nelson D. A., Yaney G. C., Hsu W. H., Kunze D. L., Boyd A. E., 3rd (1990) Diabetes Care 13, 340–363 [DOI] [PubMed] [Google Scholar]
- 39.Sher E., Giovannini F., Codignola A., Passafaro M., Giorgi-Rossi P., Volsen S., Craig P., Davalli A., Carrera P. (2003) J. Bioenerg. Biomembr. 35, 687–696 [DOI] [PubMed] [Google Scholar]
- 40.Satin L. S. (2000) Endocrine 13, 251–262 [DOI] [PubMed] [Google Scholar]
- 41.Valdeolmillos M., Nadal A., Contreras D., Soria B. (1992) J. Physiol. 455, 173–186 [DOI] [PMC free article] [PubMed] [Google Scholar]
- 42.MacDonald P. E., Ha X. F., Wang J., Smukler S. R., Sun A. M., Gaisano H. Y., Salapatek A. M., Backx P. H., Wheeler M. B. (2001) Mol. Endocrinol. 15, 1423–1435 [DOI] [PubMed] [Google Scholar]
- 43.MacDonald P. E., Joseph J. W., Rorsman P. (2005) Philos. Trans. R Soc. Lond. B Biol. Sci. 360, 2211–2225 [DOI] [PMC free article] [PubMed] [Google Scholar]
- 44.Jacobson D. A., Kuznetsov A., Lopez J. P., Kash S., Ammälä C. E., Philipson L. H. (2007) Cell Metab. 6, 229–235 [DOI] [PMC free article] [PubMed] [Google Scholar]
- 45.Göpel S. O., Kanno T., Barg S., Rorsman P. (2000) J. Physiol. 528, 497–507 [DOI] [PMC free article] [PubMed] [Google Scholar]
- 46.Göpel S. O., Kanno T., Barg S., Weng X. G., Gromada J., Rorsman P. (2000) J. Physiol. 528, 509–520 [DOI] [PMC free article] [PubMed] [Google Scholar]
- 47.Bokvist K., Olsen H. L., Høy M., Gotfredsen C. F., Holmes W. F., Buschard K., Rorsman P., Gromada J. (1999) Pflugers Arch. 438, 428–436 [DOI] [PubMed] [Google Scholar]
- 48.Gromada J., Ma X., Høy M., Bokvist K., Salehi A., Berggren P. O., Rorsman P. (2004) Diabetes 53, Suppl. 3, S181–S189 [DOI] [PubMed] [Google Scholar]
- 49.Quoix N., Cheng-Xue R., Mattart L., Zeinoun Z., Guiot Y., Beauvois M. C., Henquin J. C., Gilon P. (2009) Diabetes 58, 412–421 [DOI] [PMC free article] [PubMed] [Google Scholar]
- 50.MacDonald P. E., De Marinis Y. Z., Ramracheya R., Salehi A., Ma X., Johnson P. R., Cox R., Eliasson L., Rorsman P. (2007) PLoS Biol. 5, e143. [DOI] [PMC free article] [PubMed] [Google Scholar]
- 51.Rorsman P., Salehi S. A., Abdulkader F., Braun M., MacDonald P. E. (2008) Trends Endocrinol. Metab. 19, 277–284 [DOI] [PubMed] [Google Scholar]
Associated Data
This section collects any data citations, data availability statements, or supplementary materials included in this article.


