Abstract
Long chain acyl-CoA synthetases (ACSL) and fatty acid transport proteins (FATP) activate fatty acids to acyl-CoAs in the initial step of fatty acid metabolism. Numerous isoforms of ACSL and FATP exist with different tissue distribution patterns, intracellular locations, and substrate preferences, suggesting that each isoform has distinct functions in channeling fatty acids into different metabolic pathways. Because fatty acids, acyl-CoAs, and downstream lipid metabolites regulate various transcription factors that control hepatic energy metabolism, we hypothesized that ACSL or FATP isoforms differentially regulate hepatic gene expression. Using small interference RNA (siRNA), we knocked down each liver-specific ACSL and FATP isoform in rat primary hepatocyte cultures and subsequently analyzed reporter gene activity of numerous transcription factors and performed quantitative mRNA analysis of their target genes. Compared with control cells, which were transfected with control siRNA, knockdown of acyl-CoA synthetase 3 (ACSL3) significantly decreased reporter gene activity of several lipogenic transcription factors such as peroxisome proliferator activation receptor-γ, carbohydrate-responsive element-binding protein, sterol regulatory element-binding protein-1c, and liver X receptor-α and the expression of their target genes. These findings were further supported by metabolic labeling studies that showed [1-14C]acetate incorporation into lipid extracts was decreased in cells treated with ACSL3 siRNAs and that ACSL3 expression is up-regulated in ob/ob mice and mice fed a high sucrose diet. ACSL3 knockdown decreased total acyl-CoA synthetase activity without substantially altering the expression of other ACSL isoforms. In summary, these results identify a novel role for ACSL3 in mediating transcriptional control of hepatic lipogenesis.
Intracellular fatty acids and downstream metabolites affect a host of physiological processes, including transcriptional control of energy metabolism (1, 2). Fatty acids and/or their metabolites regulate hepatic transcription factors such as peroxisome proliferator activation receptors (PPARs),2 carbohydrate-responsive element-binding protein (ChREBP), sterol regulatory element-binding protein (SREBP)-1c, and liver X receptor (LXR)-α (3–7). The effects of fatty acids are partially determined by their chemical structure and intracellular source. For instance, EPA (C20:5) and DHA (C22:6) bind and activate PPAR-α and up-regulate genes involving fatty acid oxidation and gluconeogenesis (8). These polyunsaturated fatty acids also suppress activity of ChREBP, SREBP-1c, and LXR-α through multiple mechanisms (2, 4, 5, 9, 10), whereas saturated fatty acids activate SREBP-1c by recruiting the SREBP-1c co-activator, PPAR-γ co-activator-1β (PGC-1β) (2,11). Also intracellular fatty acids derived from de novo lipogenesis or hydrolysis of triacylglycerol (TAG) or phospholipid can activate these transcription factors. For example, recent evidence suggests that modulating specific pathways, such as de novo fatty acid synthesis or TAG hydrolysis, which supply intracellular fatty acids, regulates gene expression (12, 13). Such evidence that different regulation of these transcription factors by fatty acid type (unsaturated versus saturated) or source (intracellular versus exogenous) implicates that certain proteins or enzymes that control cellular uptake or trafficking of fatty acids and their downstream metabolites could mediate their effects on gene expression.
Acyl-CoA synthetase (ACSL) and fatty acid transport protein (FATP) activate fatty acids to acyl-CoAs in the presence of ATP and CoA. After this initial step, acyl-CoAs enter multiple metabolic pathways for lipid synthesis or β-oxidation (1, 14). FATP, also termed very long chain acyl-CoA synthetase, share 20–40% of sequence similarity with ACSL and have substrate preferences toward very long chain fatty acids (C22–26) but also show activity toward long chain fatty acids (1, 15). Each family of these enzymes has several isoforms that have unique cellular localization patterns, substrate preferences, and enzyme kinetics (1, 14–16). Gain- or loss-of-function studies also suggest unique roles for the individual ACSL and FATP isoforms in fatty acid channeling. Adenovirus-mediated overexpression of ACSL1 in rat primary hepatocytes results in channeling of [1-14C]oleic acid toward diacylglycerol and phospholipid synthesis and away from cholesterol esterification (17). Knockdown of ACSL3 in human hepatocytes decreases [1-14C]oleic acid incorporation to phospholipids for very low density lipoprotein synthesis (18) thus indicating an anabolic role in energy metabolism. Overexpression of ACSL5 in rat hepatoma cell lines increases fatty acid incorporation into TAG with substrate selectivity toward exogenous fatty acids, but not endogenous fatty acids, and without changes in β-oxidation or phospholipid synthesis (19). Differential channeling of fatty acids into diverse metabolic pathways suggest that ACSL and FATP isoforms regulate distinct pools of intracellular lipids.
Based on the differential regulation of ACSL or FATP enzymes on fatty acid channeling and the importance of fatty acids or their downstream metabolites on regulating transcription factors involving energy metabolism, we hypothesized that ASCL or FATP isoforms would differentially regulate hepatic gene expression. Therefore, the aim of this study was to determine which ACSL or FATP isoforms are responsible for modulating the activity of transcription factors in hepatic energy metabolism by utilizing siRNA specifically targeting the predominant ACSL or FATP isoforms expressed in the liver. We found that ACSL3 siRNA-transfected cells uniquely down-regulated PPAR-γ activity. Further characterization revealed that knockdown of ACSL3 decreased the activity of several lipogenic transcription factors, their target gene expression, and rates of de novo lipogenesis. Thus we conclude that ACSL3 mediates hepatic lipogenesis through transcriptional regulation of gene expression.
EXPERIMENTAL PROCEDURES
Materials
Tissue culture plates were from Nunc, and media were obtained from Invitrogen. Rat-tail collagen I was obtained from BD Biosciences. [1-14C]Acetic acid was from PerkinElmer Life Sciences. pSG5-GAL4-hPPAR-γ or pSG5-GAL4-hPPAR-α expression plasmid and a TKMH-UAS-LUC reporter plasmid were provided by Philippe Thuillier (Oregon Health and Science University, Portland, OR). pCMX-hLXR-α expression plasmid and TK-hcyp7a-LXRE(X3)-Luc reporter plasmid were provided by Dr. David Mangelsdorf (University of Texas-Southwestern). For ChREBP measurements, the ACC carbohydrate response element-containing reporter plasmid and pCMVS4-ChREBP expression vector were provided by Dr. Howard Towle (University of Minnesota), and for SREBP1-c analysis, the SRE sequence on the FAS gene and the pCMV-SREBP-1c expression vector, which contains a constitutively activated form of SREBP-1c, were provided by Dr. Timothy Osborne (University of California, Irvine, CA).
Rosiglitazone and T0901317 were obtained from Cayman Chemical. All other chemicals were obtained from Sigma unless otherwise indicated.
Primary Hepatocyte Isolation
Male Sprague-Dawley rats (250–300 g) were maintained on a 12:12-h light:dark cycle and were allowed free access to food before hepatocyte isolation. Hepatocytes were isolated by using the collagenase perfusion method (20), and cell viability, as measured by trypan blue exclusion, was over 90%. Hepatocytes were plated at a density of 0.5 × 10⁶ cells/22-mm well in M199 medium (23 mm HEPES, 26 mm sodium bicarbonate, 10% fetal bovine serum, 50 IU/ml penicillin, 50 μg/ml streptomycin, 100 nm dexamethasone, 100 nm insulin, and 11 mm glucose). Animal protocols were approved by the University of Minnesota Institutional Animal Care and Use Committee.
RNA Interference
Duplexes of siRNA targeting ACSL or FATP isoforms were synthesized by Qiagen and are listed in Table 1. Nonspecific sequence targeted siRNA, which was designed by Qiagen, served as a control. Recombinant siRNA was transfected into primary hepatocytes with 1 μg of siRNA per 0.5 × 10⁶ cells using Effectene reagent (Qiagen) when cells were plated. Transfection media were removed and replaced by M199 media supplemented with 23 mm HEPES, 26 mm sodium bicarbonate, 50 IU/ml penicillin, 50 μg/ml streptomycin, 10 nm insulin, 10 nm dexamethasone, and 5.5 mm glucose unless noted otherwise.
TABLE 1.
Target sequences of siRNA duplexes for ACSL or FATP isoforms
| Target gene | NCBI accession no. | Nucleotide position | siRNA sequences (5′-3′) |
|---|---|---|---|
| bp | |||
| ACSL1 | NM_012820 | 253–273 | CAA GCT CTT GCT GTA CTA CTA |
| ACSL3-a | NM_057107 | 1368–1389 | CTG GGT GGA AAG AGG CGC GTT |
| ACSL3-b | NM_057107 | 2137–2157 | GCC TTC AAG TTG AAA CGT AAA |
| ACSL4 | NM_053623 | 1758–1778 | CAG ATT ATC GAT CGT AAG AAA |
| ACSL5 | NM_053607 | 423–443 | GCC CTA CAA GTG GAT ATC CTA |
| FATP2 | NM_031736 | 1970–1990 | AAG GCA CGA GCT GAT CAA GTA |
| FATP4 | XM_001079409 | 1740–1760 | AAC AAG AAG AAT GCT AGT GAT |
| FATP5 | NM_024143 | 884–904 | CCA AGC TTC GTG CTA ATA TAA |
Reporter Gene Analysis
Hepatocytes were co-transfected with the pSG5-GAL4-hPPAR-γ or pSG5-GAL4-hPPAR-α expression plasmid (50 ng) and a TKMH-UAS-LUC reporter plasmid (250 ng) per 0.5 × 10⁶ cells for measuring PPAR-γ and PPAR-α activity. pCMX-hLXR-α expression plasmid (20 ng) and TK-hCYP7a-LXRE(X3)-Luc reporter plasmid (180 ng per 0.5 × 10⁶ cells) was used for measurement of LXR-α. For ChREBP and SREBP1-c, firefly luciferase reporter driven by ACC carbohydrate response element-containing promoter region (200 ng) and the SRE sequence on the FAS gene (200 ng) were transfected in 0.5 × 10⁶ cells for reporter gene assay. For overexpression of ChREBP and SREBP1-c, pCMVS4-ChREBP and pCMV-SREBP1-c expression vectors were used (20 ng per 0.5 × 10⁶ cells). A Renilla luciferase vector (pRL-SV40, Promega, Madison, WI) was used at a concentration of 20 ng per 0.5 × 10⁶ cells as an internal control for adjusting transfection efficiency of each reporter gene plasmid. Cells were then harvested for luciferase reporter gene assay at 50 h after transfection (Promega), and activity of each transcription factor was expressed as relative luciferase units.
Quantitative Real-time PCR
Total RNA was isolated with TRIzol (Invitrogen) and stored at −80 °C until use. First-strand cDNA was synthesized with the SuperScript III reverse transcriptase and random hexamer primers (Invitrogen). Synthesized cDNAs were mixed with 2× SYBR Green PCR Master Mix (Invitrogen) and subjected to the real-time PCR quantification on an ABI Prism 7700 sequence detection system (Applied Biosystems). Fluorescence data were acquired for 40 cycles with an annealing temperature of 60 °C. Primers for each gene are listed in Table 2. Data were analyzed using the ΔΔCt method, and the mRNA abundance of each gene was normalized to RPL-32.
TABLE 2.
Primer sequences for quantitative reverse transcription-PCR analysis
| Gene | Forward primer | Reverse primer |
|---|---|---|
| ACSL1 | AAC GAT GTA CGA TGG CTT CC | CAT ATG GCT GGT TTG GCT TT |
| ACSL3 | GGG ACT ACA ATA CCG GCA GA | ATA GCC ACC TTC CTC CCA GT |
| ACSL4 | AAA TGC AGC CAA ATG GAA AG | CAC TCG GCA GTT CAC TTC AA |
| ACSL5 | ATC TGC CTC CTG ACA TTT GG | GCT CCT CCC TCA ATC CCT AC |
| FATP2 | CTG CAT GTC TTC TTG GAG CA | GCG TAG GTA AGC GTC TCG TC |
| FATP4 | CAC TGC CTT GAC ACC TCA AA | ACC AGA GCA GAA GAG GGT GA |
| FATP5 | GGA ACT CTA CGG CTC CAC AG | GGC TCT GCC GTC TCT ATG TC |
| FAS | AGG ATG TCA ACA AGC CCA AG | ACA GAG GAG AAG GCC ACA AA |
| SCD-1 | TGT TCG TCA GCA CCT TCT TG | GGA TGT TCT CCC GAG ATT GA |
| ACC-α | ATT GTG GCT CAA ACT GCA GGT | GCC AAT CCA CTC GAA GAC CA |
| ACC-β | CAA AGC CTC TGA AGG TGG AG | GGA CAC TGC GTT CCC ATA CT |
| CD36 | GGC TGT GTT TGG AGG CAT TCT | CAA AAA CTG GGT GAA AAC GGG |
| L-PK | GTA CAG AAA ATC GGC CCA GA | AGG TCC ACC TCA GTG TTT GG |
| SREBP-1C | GGA GCC ATG GAT TGC ACA TT | AGA AGA GAA GCT CTC AGG AG |
| ChREBP | CGG GAC ATG TTT GAT GAC TAT | AAT AAA GGT CGG ATG AGG ATG |
| PPAR-γ1/2 | CGA GAA GGA GAA GCT GTT GG | TCA GCG GGA AGG ACT TTA TG |
| LXR-α | TAC AAC CGG GAA GAC TTT GC | TGC AGA GAA GAT GCT GAT GG |
| PGC-1β | CAA GAA GCG GCG GGG AA | GCT CAT GTG ACC GGA GAG ATT T |
| RPL32 | AAA CTG GCG GAA ACC CAG AG | GCA GCA CTT CCA GCT CCT TG |
| RPL32 (mouse) | AAC CCA GAG GCA TTG ACA AC | ATT GTG GAC CAG GAA CTT GC |
Western Blotting
For measuring protein expression of ACSL3 and AMP kinase (AMPK) phosphorylation, cell monolayers were harvested and lysed in 10 mm Tris-HCl (pH 7.4) containing 150 mm NaCl, 0.1% Triton X-100, and 1% protease inhibitor mixture (Roche Applied Science). Aliquots of total proteins (15–150 μg) were denatured at 100 °C for 10 min in SDS sample loading buffer (50 mm Tris, pH 6.8, 2% SDS, 10% glycerol, 1% bromphenol blue, and 15% β-mercaptoethanol). Samples were then separated by SDS-PAGE using a 7.5% resolving gel and electroblotted to a polyvinylidene difluoride membrane (Millipore). Equal transfer of proteins was confirmed by Ponceau S staining. After transfer, the membrane was blocked in 5% nonfat dry milk in phosphate-buffered saline (pH 7.4) with 1% Tween 20 and then incubated with ACSL3 (Santa Cruz Biotechnology, Santa Cruz, CA), ChREBP (Novus Biologicals), AMPK, phosphorylated AMPK at Thr-172 (Cell Signaling Technology), or β-actin (Sigma) antibodies. The antigens were detected by ECL chemiluminescent assay following incubation with a horseradish peroxidase-linked secondary antibody (Santa Cruz Biotechnology).
Cell Homogenate Preparations for Acyl-CoA Synthetase Activity
Hepatocytes transfected with control or ACSL siRNAs were washed twice with cold phosphate-buffered saline and collected in cold Med I buffer (10 mm Tris, pH 7.4, 250 mm sucrose, 1 mm EDTA, 1 mm dithiothreitol, and protease inhibitor mixture) and homogenized on ice with 10 strokes of a tissue homogenizer (Biospec). Homogenate aliquots were stored at −80 °C until use. Protein concentrations were determined by using the BCA method (Pierce). Acyl-CoA synthetase specific activity was determined by measuring the production of [1-14C]acyl-CoAs in the presence of 175 mm Tris-HCl, pH 7.4, 8 mm MgCl2, 5 mm dithiothreitol, 10 mm ATP, 0.25 mm CoA, and 500 μm [1-14C]palmitate in 0.5 mm Triton X-100, 0.01 mm EDTA. The assay was performed in a total volume of 200 μl at 37 °C for 5 min. The reaction was started by adding 1–2 μg of homogenate protein, terminated with 1 ml of Dole reagent (isopropanol, heptane, 1 m H2SO4, 80:20:2, v/v), and fatty acids were extracted with sequential hexane washes prior to scintillation counting of the aqueous phase containing the acyl-CoAs.
[1-14C]Acetic Acid Labeling and Lipid Extraction
Seventy-two hours after plating or siRNA transfection, hepatocytes were labeled with 1 ml of M199 containing 4.0 and 1.0 μCi of [1-14C]acetic acid for either 15 min or 3 h as indicated in the figure legends. Hepatocytes were washed twice with 1% bovine serum albumin in phosphate-buffered saline at 37 °C, and cellular lipids were extracted (21). Aliquots of the lipid extracts from the cells were separated by TLC on 0.25-mm Silica Gel G plates in hexane:ethyl ether:acetic acid (80:20:1, v/v) together with synthetic lipid standards (Sigma and BioChemika) in parallel. The 14C-labeled lipids in aliquots of the total lipid extracts and lipids scraped from iodine vapor-stained TLC plates were quantified using liquid scintillation counting (LS6000IC, Beckman).
Analysis of Composition of Free Fatty Acids
Fifty hours after plating or siRNA transfection, lipids were extracted (21) and total intracellular free fatty acids were separated by TLC on 0.25-mm silica gel G plates in hexane:ethyl ether:acetic acid (80:20:1, v/v). Isolated free fatty acids were methylated in 3 n methanolic HCl at 100 °C for 90 min. The fatty acids methyl esters were extracted with hexane and subjected to gas chromatography analysis (22).
Statistical Analysis
Data were expressed as means ± S.E. Significance of data were declared at p < 0.05 by Student t test.
RESULTS
ACSL3 siRNA Uniquely Suppresses the Transcriptional Activity of PPAR-γ
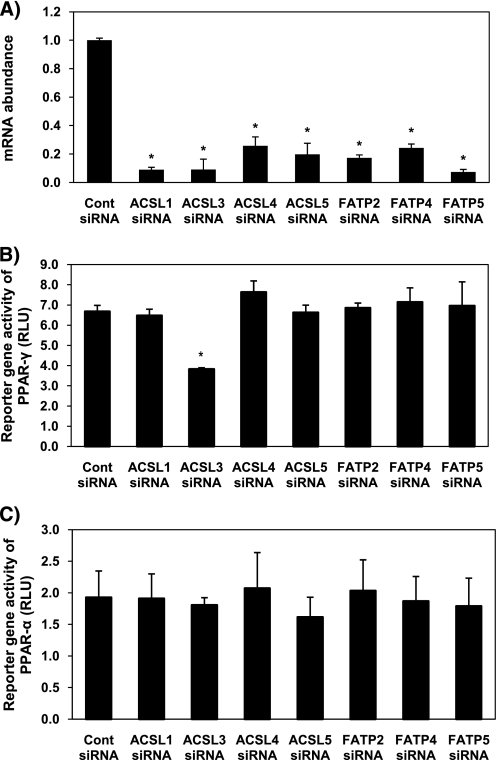
Initial studies were designed to test a minimum of three siRNA sequences to each ACSL or FATP gene expressed in liver for knockdown of at least 70%. Expression of each ACSL and FATP mRNA was successfully suppressed after 24 h compared with control siRNA-transfected cells by at least one of the siRNAs tested (Fig. 1A). Once we verified the efficacy of isoform-specific siRNA, we co-transfected these siRNAs in rat primary hepatocytes with reporter gene plasmids for PPAR-γ or PPAR-α. Of all the siRNA targeting different ACSL or FATP isoforms, ACSL3 siRNA significantly and uniquely suppressed PPAR-γ activity compared with control cells (Fig. 1B). None of the ACSL or FATP siRNAs affected reporter gene activity of PPAR-α (Fig. 1C). Based upon these findings, we sought to further characterize the role of ACSL3 in modulating hepatic gene expression to control energy metabolism.
FIGURE 1.
Knockdown of ACSL and FATP isoforms and their effects on transcriptional activity of PPAR-γ in rat primary hepatocytes. Hepatocytes were plated at 0.5 × 10⁶ cells/22 mm well and transfected with 1 μg of siRNA targeting ACSL1, ACSL3, ACSL4, ACSL5, FATP2, FATP4, or FATP5 per well. A, abundance of mRNA for each ACSL or FATP isoform was quantified 24 h after transfection using quantitative RT-PCR and normalized to RPL-32. B and C, pSG5-GAL4-hPPAR-γ (B) or pSG5-GAL4-hPPAR-α (C) expression plasmids were co-transfected with TK-MH-UAS-Luc reporter plasmids, and 50 h later cells were lysed for reporter gene assays. Values shown are mean ± S.E. from a representative experiment performed in triplicate that was repeated two or three times. Data are expressed relative to the cells transfected with nonspecific targeting siRNA (Cont). *, p < 0.05, when compared with controls.
Effectiveness of ACSL3 siRNA and Lack of Compensation by Other ACSL Isoforms
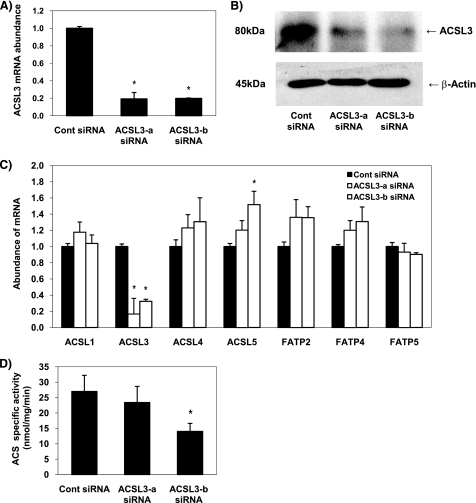
To confirm that the effect of the ACSL3 siRNA was not due to off-target effects, we developed an additional ACSL3 siRNA targeting a different region of ACSL3 mRNA and confirmed its efficacy. Quantitative RT-PCR revealed that the level of ACSL3 mRNA was reduced by >70% in cells transfected with ACSL3 siRNA targeting different regions of the ACSL3 gene (Fig. 2A). Both ACSL3 siRNAs also decreased the level of ACSL3 protein expression at 50 h following transfection (Fig. 2B). Subsequently, we tested whether other ACSL or FATP isoforms had compensational expression in response to knockdown of ACSL3. To test this possibility, mRNA of each ACSL or FATP isoform was analyzed in ACSL3 siRNA-transfected cells after 50 h of transfection, which is the time point that the protein level of ACSL3 is suppressed. Although the expression of ACSL5 mRNA was modestly up-regulated in cells transfected with one of the ACSL3 siRNA (ACSL3-b siRNA), the expressions of the other ACSL or FATP isoforms were not significantly affected by the low expression of ACSL3 (Fig. 2C). These data indicate that the expression of the other isoforms of ACSL or FATP do not compensate for a deficiency of ACSL3. Transfection of ACSL3 siRNAs decreased total acyl-CoA synthetase activity 25 and 60%, respectively (Fig. 2D), when compared with control siRNA-transfected cells. As we observed for the first ACSL3 siRNA, the second ACSL3 siRNA also suppressed PPAR-γ activity by 55% (Fig. 3E).
FIGURE 2.
ACSL3 siRNAs suppress ACSL3 expression and cellular acyl-CoA synthetase activity. A, abundance of mRNA for ACSL3 was quantified 24 h after transfection using quantitative RT-PCR and normalized to RPL-32. B, proteins were harvested at 50 h after transfection and were subjected to Western blotting; expression of β-actin was used as a loading control. C, quantitative RT-PCR analysis of mRNA abundance for ACSL and FATP isoforms at 50 h after transfection. D, at 50 h after transfection, cells were harvested in cold Med-I buffer, and acyl-CoA synthetase activity was determined. Values shown are mean ± S.E. from a representative experiment performed in triplicate that was repeated two or three times and indicated relative to nonspecific target control (Cont). *, p < 0.05, when compared with controls.
FIGURE 3.
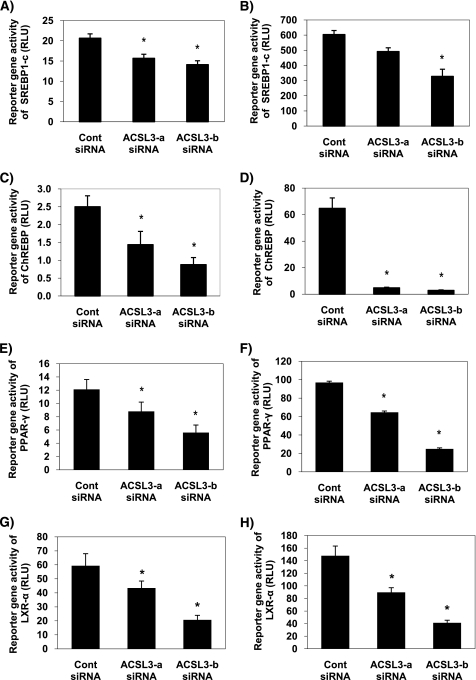
Knockdown of ACSL3 suppresses the activity of lipogenic transcription factors in rat primary hepatocytes. ACSL3-a or ACSL3-b siRNA were transfected in rat primary hepatocytes, and reporter gene activities were quantified after 50 h. A and B, for SREBP, firefly luciferase reporter of SRE sequence on FAS gene were transfected for reporter gene assay. Cells in B were also transfected with pCMV-SREBP1-c, a constitutively active form of SREBP. C and D, firefly luciferase reporter driven by the ACC carbohydrate response element-containing promoter region was transfected for measurement of ChREBP in cells treated with 5 mm (C) and 25 mm glucose (D). E and F, pSG5-GAL4-hPPAR-γ expression plasmids were co-transfected with TK-MH-UAS-Luc reporter plasmids in cells treated with DMSO (E) or 10 μm rosiglitazone (F) for 18 h to determine whether synthetic ligands normalize PPAR-γ. G and H, pCMX-hLXR-α expression plasmid and TK-hcyp7a-LXRE(X3)-Luc reporter plasmid were used for measurement of LXR-α activity in cells treated with DMSO (G) or 15 μm T0901317 (H) for 18 h. Values shown are mean ± S.E. from a representative experiment performed in triplicate that was repeated two or three times. *, p < 0.05 when compared with controls.
ACSL3 siRNAs Decrease the Transcriptional Activity of ChREBP, SREBP1-c, and LXR-α
Although most characterization of PPAR-γ has been reported in adipocytes (2, 23), this transcription factor has also been linked to lipogenesis and lipid accumulation in liver (3, 24, 25). Thus, based on our initial findings that PPAR-γ was suppressed by ACSL3 knockdown, we wanted to further characterize how ACSL3 influenced other transcription factors such as SREBP-1c, LXR-α, and ChREBP, all of which contribute to the regulation of lipogenic gene expression. ACSL3 siRNAs decreased reporter gene activity of SREBP1-c (25 and 30%) and LXR-α (50 and 55%) (Fig. 3, A and G). The reporter gene activity assays for SREBP were performed with reporter plasmids containing sterol regulatory elements, but SREBP itself was not overexpressed. To determine if endogenous SREBP or its subsequent processing were limiting, we overexpressed the constitutively active nuclear form of SREBP-1c in hepatocytes in conjunction with reporter plasmids. However, ACSL3 siRNA-mediated suppression of SREBP reporter gene activity was not overcome by overexpression of SREBP-1c (Fig. 3B). ChREBP is thought to be the primary glucose-responsive transcription factor that governs the expression of glycolytic and lipogenic genes (6, 9). Similar to the other lipogenic transcription factors, ACSL3 knockdown suppressed ChREBP reporter gene activity (Fig. 3C). Additionally, we challenged the cells with high (25 mm) glucose concentrations to stimulate ChREBP activity. ACSL3 siRNAs suppressed ChREBP under high glucose conditions and largely prevented the increase in ChREBP activity following exposure to high glucose. Specifically, control cells exhibited a 25-fold increase in ChREBP activity in response to high glucose, whereas cells with suppressed ACSL3 expression only responded with a 3- to 3.5-fold increase (Fig. 3D). Therefore, ACSL3 appears to inhibit basal ChREBP activity and its glucose-mediated induction. To determine if ligands for these transcription factors can rescue PPAR-γ or LXR-α activity in cells transfected with ACSL3 siRNA, we incubated cells with 10 μm rosiglitazone or 15 μm T0901317, synthetic ligands for PPAR-γ and LXR-α, respectively. Exposure to these ligands increased PPAR-γ (∼8-fold) or LXR-α (∼2.5-fold) activity (Fig. 3, F and H). However, these ligands were unable to restore PPAR-γ or LXR-α activity in response to ACSL3 knockdown.
ACSL3 siRNAs Decrease Lipogenic Gene Expression
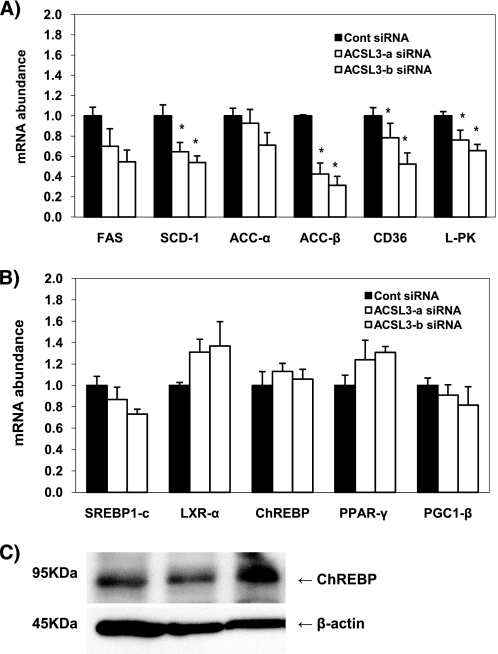
Because the reporter gene assays showed that ACSL3 affects the activity of numerous transcription factors involving lipogenesis, we determined if the expression of lipogenic genes was altered in response to ACSL3 knockdown. Compared with control siRNA-transfected cells, ACSL3 siRNAs down-regulated the expression of numerous genes involved in fatty acid metabolism and, more specifically, lipogenesis, including ACC-β, SCD-1, and L-PK, with a trend for decreased ACC-α and FAS (Fig. 4A). Additionally, the expression of CD36, a known target gene of PPAR-γ, was also decreased. However the expression of the transcription factors ChREBP, LXR-α, SREBP-1c, and PPAR-γ were not changed (Fig. 4B). Because ChREBP showed the most decline in activity following ACSL3 knockdown, we also analyzed protein expression of ChREBP to explore the possibility that protein levels were affected by ACSL3 knockdown. Consistent with mRNA expression, the level of ChREBP protein was unchanged following ACSL3 knockdown (Fig. 4C). These data suggest that the down-regulation of lipogenic gene expression by ACSL3 knockdown was due to the reduced transcriptional activity of these transcription factors rather than changes in their expression. PGC-1β is known to co-activate several lipogenic transcription factors (11, 26), thus, it is possible that ACSL3 may have modulated PGC-1β as a means to down-regulate lipogenic gene expression. However, we did not observe any changes in PGC-1β expression (Fig. 4B). Taken together, these data indicate that ACSL3 mediates lipogenic gene expression through altered transcriptional activity rather than changes in expression of the individual transcription factors or a common co-activator.
FIGURE 4.
ACSL3 knockdown decreases lipogenic gene expression. Rat primary hepatocytes were plated at 0.5 × 10⁶ cells/22-mm well and transfected with 1 μg of siRNA per well. After 50 h of siRNA transfection, total RNA was isolated and mRNA expression of lipogenic genes (A) or transcription factors and co-activators (B) were quantified using quantitative RT-PCR and normalized to RPL-32. C, proteins were harvested at 50 h after transfection and subjected to Western blotting for measurement of ChREBP. From left to right, the lanes represent control, ACSL3-a, and ACSL3-b siRNA, respectively. Values are reported as mean ± S.E. in duplicate from four individual experiments performed and indicated relative to the cells transfected with control siRNA. *, p < 0.05 when compared with controls.
ACSL3 Knockdown Suppresses Lipogenesis
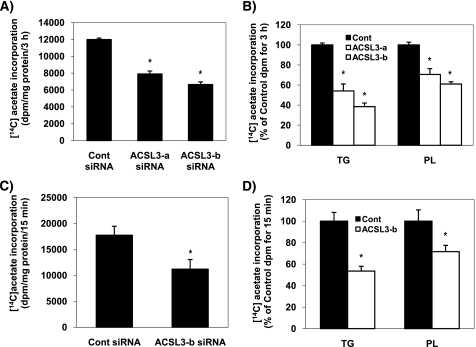
The above results suggest that ACSL3 has a significant role in modulating the expression of lipogenic genes. To determine if the changes of hepatic lipogenic gene expression by ACSL3 knockdown translated to altered rates of lipogenesis, cells were labeled with [1-14C]acetic acid, and the amount of radiolabeled acetic acid converted to total lipids was determined. Compared with cells transfected with the control siRNA, incorporation of [1-14C]acetic acid into total lipids was reduced by ∼40% in ACSL3 siRNA-transfected cells (p < 0.01) (Fig. 5A). Subsequent partitioning of newly synthesized lipids into different types of storage lipids (phospholipid and TG) was also decreased to a similar extent (Fig. 5B). These data indicate that the decreased expression of lipogenic genes results in decreased rates of de novo lipogenesis. Initial rates of de novo lipogenesis measured at 15 min after [1-14C]acetic acid incubation, which is more reflective of utilization of fatty acid derived from de novo lipogenesis rather than lipid turnover, was also decreased in ACSL3 siRNA-transfected cells (Fig. 5, C and D). Thus, ACSL3 knockdown decreased rates of de novo fatty acid synthesis in agreement with the observed changes in lipogenic gene expression.
FIGURE 5.
Knockdown of ACSL3 suppresses de novo lipogenesis. At 72 h after transfection, cells were labeled with 1 μCi of [1-14C]acetic acid per 0.5 × 10⁶ cells for 3 h (A and B) and 15 min (C and D). Lipids were extracted from the cells and quantified as described under “Experimental Procedures.” Data are indicated as mean ± S.E. from a representative experiment performed in triplicate that was repeated three times. *, p < 0.05 when compared with controls.
ACSL3 Knockdown Alters the Composition of Intracellular Free Fatty Acids
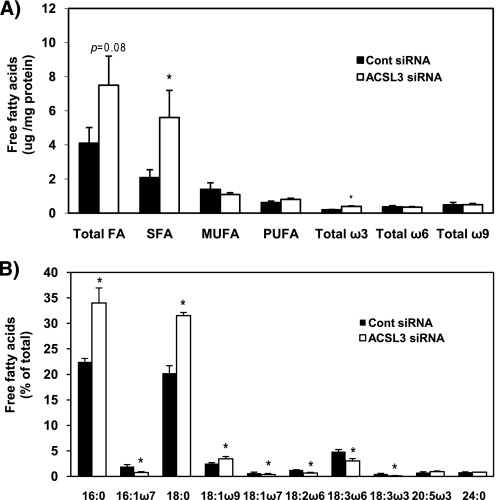
We further analyzed the composition of intracellular free fatty acids to determine how ACSL3 knockdown affects their content and composition in cells. ACSL3 siRNA-transfected cells had 82% more free fatty acids (p = 0.08) and a 1.7-fold increase in saturated fatty acid content compared with control cells (Fig. 6A). The saturated fatty acids C16:0 and C18:0 were increased 50–55% following ACSL3 knockdown and represented the largest changes of any individual free fatty acids (Fig. 6B). In addition, several polyunsaturated fatty acids species were decreased in response to ACSL3.
FIGURE 6.
Composition of total cellular free fatty acids. At 50 h after transfection of siRNAs, lipids were extracted from the cells and free fatty acids were separated by TLC. Methyl esters of fatty acids were quantified by gas chromatography. A, sum of free fatty acids and fatty acid classes was calculated. Amount of total free fatty acids in control siRNA-transfected cells was 4.1 μg/mg of protein. B, composition of each different species of free fatty acids. SFA, saturated fatty acids; MUFA, monounsaturated fatty acids; and PUFA, polyunsaturated fatty acids. Data represent triplicate samples. Data are indicated as mean ± S.E. *, p < 0.05 when compared with controls.
ACSL3 Knockdown Does Not Change AMPK Phosphorylation
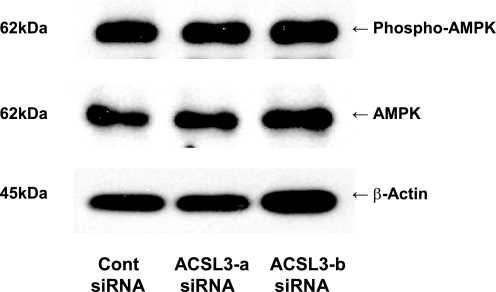
AMPK is a major energy sensor in cells that regulates numerous transcription factors, including many of the lipogenic transcription factors influenced by ACSL3 knockdown (27). The ACSL enzymes utilize the equivalent of two molecules of ATP per reaction and produces AMP, thus lowering the ATP/AMP ratio, which may impact AMPK activation. Recently studies have shown that the acyl-CoA synthetase activity plays a key role in altering AMPK activation (28). Thus, ACSL3 knockdown could potentially alter AMPK activation, which is known to regulate numerous transcription factors to control gene expression (29, 30). However, neither total AMPK nor phosphorylation of AMPK at Thr-172 were changed by ACSL3 knockdown (Fig. 7) indicating that the effects of ACSL3 on lipogenesis were not mediated through AMPK signaling.
FIGURE 7.
ACSL3 siRNA-mediated knockdown does not alter the phosphorylation of AMPK. Total proteins were harvested at 50 h after transfection of siRNAs and were subjected to Western blotting for measuring expression of AMPK and phosphorylated AMPK at Thr-172.
Hepatic ACSL3 Expression Is Increased in ob/ob Mice and High Sucrose-fed Mice
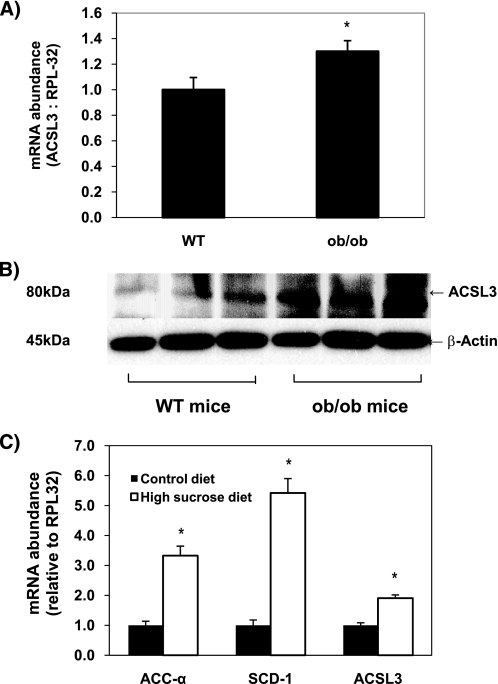
Data from the current study along with previous data on ACSL3 (18, 31, 32) suggest that this enzyme may have a synthetic role in energy metabolism. To gain insight into the in vivo regulation of ACSL3, we measured ACSL3 mRNA and protein from livers of genetically obese (ob/ob) mice, which are known to have high rates of de novo lipogenesis (33). ACSL3 mRNA was increased nearly 30% in 5-week-old ob/ob male mice. An even more robust increase in ACSL3 protein abundance was observed in ob/ob mice compared with wild-type mice (Fig. 8, A and B). Also, compared with C57/BL6 mice fed a chow diet, expression of ACSL3, in parallel with other lipogenic genes, was up-regulated ∼2-fold in mice fed a 45% sucrose diet for 1 week (Fig. 8C). These data further provide evidence that ACSL3 has an integral role in lipogenesis and hepatic energy metabolism.
FIGURE 8.
Expression of ACSL3 is up-regulated in ob/ob mice and C57/BL6 mice fed a high sucrose diet. A and B, expression of ACSL3 was compared in liver tissue of 5-week-old male ob/ob (n = 5) and lean wild-type (WT) C57/BL6 mice (n = 4) fed chow diets. A, total RNA was extracted, and the abundance of mRNA for ACSL3 was quantified using quantitative RT-PCR and normalized to RPL-32. *, p < 0.05 when compared with WT mice. B, total proteins were subjected to Western blot, and expression of β-actin was analyzed as an internal control. C, expression of ACSL3 was compared in liver tissue of 5-week-old male C57/BL6 mice (n = 4 per group) fed AIN-93 diet (control diet) or high sucrose (45%) diet for 1 week. Values are reported as mean ± S.E. and are expressed relative to the mice fed the control diet. *, p < 0.05 when compared with control diet.
DISCUSSION
Previous studies support distinct roles of individual ACSL or FATP isoforms in fatty acid trafficking and partitioning to different metabolic pathways (17, 19, 34). However, the current study focused upon the signaling properties of these enzymes as a means to control hepatic lipid metabolism. Of all the ACSL and FATP isoforms evaluated, ACSL3 siRNA uniquely decreased the activity of PPAR-γ, and further evaluation revealed that it also decreased ChREBP, SREBP1-c, and LXR-α activity and expression of their target genes. We also found that expression of ACSL3 was up-regulated in two different models of enhanced lipogenesis. These data suggest that a unique pool of fatty acids, acyl-CoAs, or downstream metabolites created by ACSL3 act as important signaling molecules to regulate hepatic lipogenesis.
ACSL3 was initially cloned as a predominant ACSL isoform in brain tissue (35), which contains phospholipids that are highly enriched in polyunsaturated fatty acids (36). Based upon these data, it has been predicted that ACSL3 has an active role in phospholipid or eicosanoid metabolism (36). ACSL3 has a broad range of substrate preferences toward C16-C24 fatty acids (35, 37). Although few studies have focused on the physiological function of ACSL3 (16, 35), its localization on lipid droplets or endoplasmic reticulum membranes (31, 32) suggests that this enzyme is likely involved in lipid synthesis. Proteomic analyses have revealed that ACSL3 is located on the surface of lipid droplets and is physically associated with lipid droplets fractions in 3T3-L1 adipocytes (32), human hepatocytes (31), and A431 human epithelial cells (38). In addition, the expression of ACSL3 is correlated with the oleate-induced formation of lipid droplets in conjunction with the increased production of acyl-CoAs (31). Triacsin C, an inhibitor of ACSL1, -3, and -4, decreased the formation of lipid droplets and subsequent lipid species (TAG and cholesterol ester) along with suppression of ACSL3 protein (31). Also triacsin C decreases [1-14C]oleic acid incorporation into TAG by 70% in rat hepatocytes (39). Yao and Ye (18) found that ACSL3 mediates the synthesis of phosphatidylcholine that is necessary for the assembly of very low density lipoprotein in human hepatoma cell lines. Also recent animal studies demonstrated that expression of mRNA of ACSL3 was down-regulated in 48-h-fasted rats (16). Taken as a whole, these data strongly support a synthetic role of ACSL3 in energy metabolism.
Increased rates of de novo lipogenesis in obesity (40), hyperlipidemia (41), fatty liver disease (29), and type 2 diabetes (41) subjects suggests that conversion of surplus carbohydrate to lipids modulates hepatic function and contributes to the development of steatosis, insulin resistance, and dyslipidemia. Fatty acids derived from de novo lipogenesis are preferentially incorporated into storage lipids such as TAG and secreted as very low density lipoprotein rather than mitochondrial oxidation (19, 42). Additionally, an intermediate in de novo fatty acid synthesis, malonyl-CoA, allosterically inhibits carnitine palmitoyl transferase to suppress β-oxidation (43), which may further exacerbate the development of steatosis. Several animal models with alterations of lipogenic enzyme expression or transcription factors also support the etiological role of de novo fatty acid synthesis in metabolic diseases. Transgenic mice that overexpress SREBP-1c in the liver exhibit liver steatosis and have increased lipogenic gene expression (44). Insulin-resistant animals (45, 46) have elevated levels of SREBP-1c, and high levels of SREBP-1c exacerbate insulin resistance through inhibition of insulin receptor substrate-2 signaling in liver (47). Also, a synthetic LXR-α ligand increases hepatic SREBP-1c mRNA levels and increases mRNA abundance of lipogenic enzymes resulting in fatty liver and hypertriglyceridemia (48). In contrast, inhibition of lipogenic transcription factors protects animals from fatty liver and insulin resistance. Liver-specific knockdown of ChREBP in ob/ob mice decreases lipogenic gene expression (e.g. L-PK, ACC, FAS, and SCD-1) and lipid accumulation (e.g. glycerol-3-phosphate acyltransferase) and consequently decreases free fatty acid concentrations and hepatic fat accumulation (49). Also inhibition of ChREBP significantly restores insulin sensitivity in liver as evidenced by normalization of Akt signaling and improves metabolism in skeletal muscle by reducing hyperlipidemia (49). Because our data show that ACSL3 mediates de novo lipogenesis through transcriptional mechanisms, ACSL3 may be a potential therapeutic target for correcting alterations in liver energy metabolism commonly observed in numerous metabolic diseases.
Although our findings show that ACSL3 governs transcriptional control of hepatic energy metabolism, the mechanisms of how ACSL3 elicits these effects are not known. Synthetic ligands were unable to normalize transcriptional activity of LXR and PPAR-γ suggesting that ACSL3 regulates transcriptional control via a ligand-independent mechanism. Additionally, our data do not support a role for AMPK in mediating the effects of ACSL3 on gene expression. Quantification of the intracellular free fatty acid pool revealed that ACSL3 knockdown increased the content of saturated fatty acids and decreased polyunsaturated fatty acids. However, saturated fatty acids have been proposed to increase lipogenesis (11), whereas polyunsaturated fatty acids are potent inhibitors of lipogenic gene expression (50). Thus, it is unlikely that changes in specific free fatty acids can explain the effects of ACSL3 knockdown on hepatic gene expression. Because ACSL3 knockdown resulted in decreased activity of all the lipogenic transcription factors measured, it is logical to suggest that a common co-activator or co-repressor is regulated by changes in a specific pool of metabolites as a result of ACSL3 activity. It is also possible that ACSL3 itself through protein-protein interactions elicits the effects on gene expression. Ongoing characterization of the role of ACSL3 in lipid formation and channeling should further our insights into the mechanism mediating its effects.
In summary we demonstrate for the first time that ACSL3 uniquely regulates lipogenic transcription factors to control hepatic energy metabolism. Our findings, which are in agreement with other studies showing that intracellular lipids pools and fatty acid trafficking have a regulatory role in lipid metabolism through transcriptional regulation (1, 51, 52), suggest that ACSL3 may have an integral role in regulating lipogenesis and, potentially, the development of hepatic steatosis and its co-morbidities.
This work was supported by American Diabetes Association Grant 07-07-JF-43 (to D. G. M.) and the Minnesota Obesity Center.
- PPAR
- peroxisome proliferator-activated receptor
- ACC
- acetyl-CoA carboxylase
- ACSL
- long chain acyl-CoA synthetase
- AMPK
- AMP kinase
- ChREBP
- carbohydrate-responsive element-binding protein
- FAS
- fatty acid synthase
- FATP
- fatty acid transport proteins
- LXR
- liver X receptor
- PGC-1β
- PPAR-γ co-activator-1β
- SREBP
- sterol regulatory element-binding protein
- siRNA
- small interference RNA
- RT
- reverse transcription
- TAG
- triacylglycerol.
REFERENCES
- 1.Mashek D. G., Li L. O., Coleman R. A. (2007) Future Lipidol. 2, 465–476 [DOI] [PMC free article] [PubMed] [Google Scholar]
- 2.Jump D. B., Botolin D., Wang Y., Xu J., Christian B., Demeure O. (2005) J. Nutr. 135, 2503–2506 [DOI] [PubMed] [Google Scholar]
- 3.Zhang Y. L., Hernandez-Ono A., Siri P., Weisberg S., Conlon D., Graham M. J., Crooke R. M., Huang L. S., Ginsberg H. N. (2006) J. Biol. Chem. 281, 37603–37615 [DOI] [PubMed] [Google Scholar]
- 4.Pawar A., Xu J., Jerks E., Mangelsdorf D. J., Jump D. B. (2002) J. Biol. Chem. 277, 39243–39250 [DOI] [PubMed] [Google Scholar]
- 5.Xu J., Teran-Garcia M., Park J. H., Nakamura M. T., Clarke S. D. (2001) J. Biol. Chem. 276, 9800–9807 [DOI] [PubMed] [Google Scholar]
- 6.Stoeckman A. K., Ma L., Towle H. C. (2004) J. Biol. Chem. 279, 15662–15669 [DOI] [PubMed] [Google Scholar]
- 7.Repa J. J., Liang G., Ou J., Bashmakov Y., Lobaccaro J. M., Shimomura I., Shan B., Brown M. S., Goldstein J. L., Mangelsdorf D. J. (2000) Genes Dev. 14, 2819–2830 [DOI] [PMC free article] [PubMed] [Google Scholar]
- 8.Pawar A., Jump D. B. (2003) J. Biol. Chem. 278, 35931–35939 [DOI] [PubMed] [Google Scholar]
- 9.Dentin R., Benhamed F., Pégorier J. P., Foufelle F., Viollet B., Vaulont S., Girard J., Postic C. (2005) J. Clin. Investig. 115, 2843–2854 [DOI] [PMC free article] [PubMed] [Google Scholar]
- 10.Lorente-Cebrián S., Pérez-Matute P., Martínez J. A., Marti A., Moreno-Aliaga M. J. (2006) J. Physiol. Biochem. 62, 61–69 [DOI] [PubMed] [Google Scholar]
- 11.Lin J., Yang R., Tarr P. T., Wu P. H., Handschin C., Li S., Yang W., Pei L., Uldry M., Tontonoz P., Newgard C. B., Spiegelman B. M. (2005) Cell 120, 261–273 [DOI] [PubMed] [Google Scholar]
- 12.Chakravarthy M. V., Pan Z., Zhu Y., Tordjman K., Schneider J. G., Coleman T., Turk J., Semenkovich C. F. (2005) Cell Metab. 1, 309–322 [DOI] [PubMed] [Google Scholar]
- 13.Sapiro J. M., Mashek M. T., Greenberg A. S., Mashek D. G. (2009) J. Lipid Res. 50, 1621–1629 [DOI] [PMC free article] [PubMed] [Google Scholar]
- 14.Mashek D. G., Coleman R. A. (2006) Curr. Opin. Lipidol. 17, 274–278 [DOI] [PubMed] [Google Scholar]
- 15.Watkins P. A. (2008) J. Biol. Chem. 283, 1773–1777 [DOI] [PubMed] [Google Scholar]
- 16.Mashek D. G., Li L. O., Coleman R. A. (2006) J. Lipid Res. 47, 2004–2010 [DOI] [PubMed] [Google Scholar]
- 17.Li L. O., Mashek D. G., An J., Doughman S. D., Newgard C. B., Coleman R. A. (2006) J. Biol. Chem. 281, 37246–37255 [DOI] [PubMed] [Google Scholar]
- 18.Yao H., Ye J. (2008) J. Biol. Chem. 283, 849–854 [DOI] [PubMed] [Google Scholar]
- 19.Mashek D. G., McKenzie M. A., Van Horn C. G., Coleman R. A. (2006) J. Biol. Chem. 281, 945–950 [DOI] [PubMed] [Google Scholar]
- 20.Stoeckman A. K., Towle H. C. (2002) J. Biol. Chem. 277, 27029–27035 [DOI] [PubMed] [Google Scholar]
- 21.Bligh E. G., Dyer W. J. (1959) Can. J. Biochem. Physiol. 37, 911–917 [DOI] [PubMed] [Google Scholar]
- 22.Forsythe C. E., Phinney S. D., Fernandez M. L., Quann E. E., Wood R. J., Bibus D. M., Kraemer W. J., Feinman R. D., Volek J. S. (2008) Lipids 43, 65–77 [DOI] [PubMed] [Google Scholar]
- 23.He Z., Jiang T., Wang Z., Levi M., Li J. (2004) Am. J. Physiol. Endocrinol. Metab. 287, E424–E430 [DOI] [PubMed] [Google Scholar]
- 24.Schadinger S. E., Bucher N. L., Schreiber B. M., Farmer S. R. (2005) Am. J. Physiol. Endocrinol. Metab. 288, E1195–E1205 [DOI] [PubMed] [Google Scholar]
- 25.Westerbacka J., Kolak M., Kiviluoto T., Arkkila P., Sirén J., Hamsten A., Fisher R. M., Yki-Järvinen H. (2007) Diabetes 56, 2759–2765 [DOI] [PubMed] [Google Scholar]
- 26.Hernandez C., Lin J. D. (2009) Cell Metab. 9, 215–216 [DOI] [PubMed] [Google Scholar]
- 27.Winder W. W., Hardie D. G. (1999) Am. J. Physiol. 277, E1–E10 [DOI] [PubMed] [Google Scholar]
- 28.Gauthier M. S., Miyoshi H., Souza S. C., Cacicedo J. M., Saha A. K., Greenberg A. S., Ruderman N. B. (2008) J. Biol. Chem. 283, 16514–16524 [DOI] [PMC free article] [PubMed] [Google Scholar]
- 29.Higuchi N., Kato M., Shundo Y., Tajiri H., Tanaka M., Yamashita N., Kohjima M., Kotoh K., Nakamuta M., Takayanagi R., Enjoji M. (2008) Hepatol. Res. 38, 1122–1129 [DOI] [PubMed] [Google Scholar]
- 30.Kawaguchi T., Osatomi K., Yamashita H., Kabashima T., Uyeda K. (2002) J. Biol. Chem. 277, 3829–3835 [DOI] [PubMed] [Google Scholar]
- 31.Fujimoto Y., Itabe H., Kinoshita T., Homma K. J., Onoduka J., Mori M., Yamaguchi S., Makita M., Higashi Y., Yamashita A., Takano T. (2007) J. Lipid Res. 48, 1280–1292 [DOI] [PubMed] [Google Scholar]
- 32.Brasaemle D. L., Dolios G., Shapiro L., Wang R. (2004) J. Biol. Chem. 279, 46835–46842 [DOI] [PubMed] [Google Scholar]
- 33.Cohen P., Miyazaki M., Socci N. D., Hagge-Greenberg A., Liedtke W., Soukas A. A., Sharma R., Hudgins L. C., Ntambi J. M., Friedman J. M. (2002) Science 297, 240–243 [DOI] [PubMed] [Google Scholar]
- 34.Doege H., Baillie R. A., Ortegon A. M., Tsang B., Wu Q., Punreddy S., Hirsch D., Watson N., Gimeno R. E., Stahl A. (2006) Gastroenterology 130, 1245–1258 [DOI] [PubMed] [Google Scholar]
- 35.Fujino T., Kang M. J., Suzuki H., Iijima H., Yamamoto T. (1996) J. Biol. Chem. 271, 16748–16752 [DOI] [PubMed] [Google Scholar]
- 36.Innis S. M. (2003) J. Pediatr. 143, S1–S8 [DOI] [PubMed] [Google Scholar]
- 37.Van Horn C. G., Caviglia J. M., Li L. O., Wang S., Granger D. A., Coleman R. A. (2005) Biochemistry 44, 1635–1642 [DOI] [PubMed] [Google Scholar]
- 38.Umlauf E., Csaszar E., Moertelmaier M., Schuetz G. J., Parton R. G., Prohaska R. (2004) J. Biol. Chem. 279, 23699–23709 [DOI] [PubMed] [Google Scholar]
- 39.Muoio D. M., Lewin T. M., Wiedmer P., Coleman R. A. (2000) Am. J. Physiol. Endocrinol. Metab. 279, E1366–E1373 [DOI] [PubMed] [Google Scholar]
- 40.Diraison F., Dusserre E., Vidal H., Sothier M., Beylot M. (2002) Am. J. Physiol. Endocrinol. Metab. 282, E46–E51 [DOI] [PubMed] [Google Scholar]
- 41.Vedala A., Wang W., Neese R. A., Christiansen M. P., Hellerstein M. K. (2006) J. Lipid Res. 47, 2562–2574 [DOI] [PubMed] [Google Scholar]
- 42.Gibbons G. F., Bartlett S. M., Sparks C. E., Sparks J. D. (1992) Biochem. J. 287, 749–753 [DOI] [PMC free article] [PubMed] [Google Scholar]
- 43.McGarry J. D., Leatherman G. F., Foster D. W. (1978) J. Biol. Chem. 253, 4128–4136 [PubMed] [Google Scholar]
- 44.Shimano H., Horton J. D., Shimomura I., Hammer R. E., Brown M. S., Goldstein J. L. (1997) J. Clin. Investig. 99, 846–854 [DOI] [PMC free article] [PubMed] [Google Scholar]
- 45.Shimomura I., Matsuda M., Hammer R. E., Bashmakov Y., Brown M. S., Goldstein J. L. (2000) Mol. Cell 6, 77–86 [PubMed] [Google Scholar]
- 46.Tobe K., Suzuki R., Aoyama M., Yamauchi T., Kamon J., Kubota N., Terauchi Y., Matsui J., Akanuma Y., Kimura S., Tanaka J., Abe M., Ohsumi J., Nagai R., Kadowaki T. (2001) J. Biol. Chem. 276, 38337–38340 [DOI] [PubMed] [Google Scholar]
- 47.Ide T., Shimano H., Yahagi N., Matsuzaka T., Nakakuki M., Yamamoto T., Nakagawa Y., Takahashi A., Suzuki H., Sone H., Toyoshima H., Fukamizu A., Yamada N. (2004) Nat. Cell Biol. 6, 351–357 [DOI] [PubMed] [Google Scholar]
- 48.Schultz J. R., Tu H., Luk A., Repa J. J., Medina J. C., Li L., Schwendner S., Wang S., Thoolen M., Mangelsdorf D. J., Lustig K. D., Shan B. (2000) Genes Dev. 14, 2831–2838 [DOI] [PMC free article] [PubMed] [Google Scholar]
- 49.Dentin R., Benhamed F., Hainault I., Fauveau V., Foufelle F., Dyck J. R., Girard J., Postic C. (2006) Diabetes 55, 2159–2170 [DOI] [PubMed] [Google Scholar]
- 50.Nakamura M. T., Cheon Y., Li Y., Nara T. Y. (2004) Lipids 39, 1077–1083 [DOI] [PubMed] [Google Scholar]
- 51.Pinent M., Hackl H., Burkard T. R., Prokesch A., Papak C., Scheideler M., Hämmerle G., Zechner R., Trajanoski Z., Strauss J. G. (2008) Genomics 92, 26–32 [DOI] [PubMed] [Google Scholar]
- 52.Schroeder F., Petrescu A. D., Huang H., Atshaves B. P., McIntosh A. L., Martin G. G., Hostetler H. A., Vespa A., Landrock D., Landrock K. K., Payne H. R., Kier A. B. (2008) Lipids 43, 1–17 [DOI] [PubMed] [Google Scholar]


