

Abstract
The ubiquitin ligase murine double minute clone 2 (MDM2) mediates ubiquitination and degradation of the tumor suppressor p53. The activation and stabilization of p53 by contrast is maintained by enzymes catalyzing p53 phosphorylation and acetylation. Casein kinase 1 (CK1) is one such enzyme; it stimulates p53 after transforming growth factor-β treatment, irradiation, or DNA virus infection. We analyzed whether CK1 regulates p53 protein stability in unstressed conditions. Depletion of CK1 using small interfering RNA or inhibition of CK1 using the kinase inhibitor (D4476) activated p53 and destabilized E2F-1, indicating that steady-state levels of these proteins are controlled by CK1. Co-immunoprecipitation of endogenous CK1 with MDM2 occurred in undamaged cells, indicating the existence of a stable multiprotein complex, and as such, we evaluated whether the MDM2 Nutlin had similar pharmacological properties to the CK1 inhibitor D4476. Indeed, D4476 or Nutlin treatments resulted in the same p53 and E2F-1 steady-state protein level changes, indicating that the MDM2·CK1 complex is both a negative regulator of p53 and a positive regulator of E2F-1 in undamaged cells. Although the treatment of cells with D4476 resulted in a partial p53-dependent growth arrest, the induction of p53-independent apoptosis by D4476 suggested a critical role for the MDM2·CK1 complex in maintaining E2F-1 anti-apoptotic signaling. These data highlighting a pharmacological similarity between MDM2 and CK1 small molecule inhibitors and the fact that CK1 and MDM2 form a stable complex suggest that the MDM2·CK1 complex is a component of a genetic pathway that co-regulates the stability of the p53 and E2F-1 transcription factors.
Introduction
The tumor suppressor protein p53 is a key regulatory protein that prevents proliferation of damaged cells. This central player in maintaining tissue integrity is present at low levels under unperturbed conditions but becomes rapidly stabilized and activated in response to a variety of stimuli such as ionizing radiation, genome instability, DNA damage, transforming growth factor-β, DNA or RNA virus infection, Type I interferons, and overexpressed oncogenes (1). p53 responds to these diverse stresses to regulate many target genes that induce cell cycle arrest, apoptosis, autophagy, senescence, or DNA repair or alter metabolism (2). The primary amino acid sequence of p53 contains many evolutionarily conserved serine, threonine, and lysine residues for which post-translational modifications have a crucial role in p53 stabilization and activation. Most residues that are phosphorylated are targeted by many different kinases in response to various stresses when p53 is activated, although some phosphorylations have been reported to be inhibitory (3).
In unstressed cells, p53 is under the negative regulation of the murine double minute clone 2 (MDM2)3 protein that mediates the ubiquitination and degradation of p53 by the proteasome (4). p53 transcriptionally activates the mdm2 gene, and because MDM2 inhibits p53 activity, this forms a negative feedback loop that tightly regulates p53 function (5). In addition to inactivation of p53-stimulated apoptosis, the oncogenic properties of MDM2 may in part be mediated by an anti-apoptotic activity that converts E2F-1 from a negative to a positive regulator of cell cycle progression by maintaining E2F-1 in a permanent state of growth stimulation (6).
MDM2 has been dissected into multiple functional domains: an N-terminal allosteric hydrophobic pocket that interacts with specific linear peptide docking motifs in proteins such as p53, a nuclear localization signal and a nuclear export signal, an acidic domain that binds the ubiquitin signal in the DNA-binding domain of p53, a C-terminal RING domain that coordinates E3 functions in ubiquitin transfer, an ATP-binding motif that regulates the chaperone functions of MDM2, and a pseudo-substrate motif or lid that regulates its ubiquitin ligase function (7). Reconstitution of the ubiquitin ligase function of MDM2 has demonstrated a two-site docking model for modification of p53. This involves occupation of the N-terminal hydrophobic pocket of MDM2 by a priming ligand (p53) that induces a docking event between the acidic domain of MDM2 and a ubiquitin signal in the DNA-binding domain of p53 (8). Although a similar dual-site docking ubiquitination mechanism by MDM2 operates on the interferon regulatory factor-2 transcription factor (9), it is not clear whether the ubiquitination or chaperone functions of MDM2 dominate on E2F-1 in cells (10).
Upon DNA damage, p53 is post-translationally modified to inhibit interactions with MDM2 and to stabilize protein-protein interactions with transcription factor machinery. Several kinases also phosphorylate MDM2 and modulate interactions with p53 in different conditions. Thus p53 and MDM2 integrate signals of multiple signaling pathways by post-translational modifications. The interaction of both proteins is regulated through their phosphorylation status. CK1 represents a unique group within the superfamily of serine/threonine-specific protein kinases that is ubiquitously expressed in eukaryotic organisms and is evolutionarily conserved. In mammals, seven distinct genes encoding CK1 isoforms (α, β, γ1, γ2, γ3, δ, and ϵ) and their various splice variants are expressed. CK1 activity is regulated by various mechanisms including subcellular compartmentation and, in the case of CK1δ and ϵ, proteolytic cleavage, autophosphorylation, and dephosphorylation of the C terminus. Among the increasing number of CK1 substrates are enzymes, transcription factors, splice factors, cytoskeleton proteins, receptors, membrane-associated proteins, and cell signaling proteins (11).
Several CK1 isoforms, α, δ, and ϵ, have been identified that phosphorylate the N-terminal phosphorylation sites of p53. Upon DNA damage or DNA virus infection, phosphorylation of p53 at the threonine 18 site by CK1δ (12) and the serine 20 site by CK1α (13), respectively, is believed to attenuate the interaction of p53 with its inhibitory counterpart MDM2 and to stabilize the binding of the co-activator p300, thereby activating p53 function. The interplay between p53 and MDM2 on different levels is influenced not only by the phosphorylation status of p53 but also the phosphorylation status of MDM2. Interestingly, CK1δ as well as CK1ϵ have been shown, in normal conditions, to phosphorylate several serine residues within the acidic domain of MDM2, which are involved in the degradation of p53 and the binding to other proteins (14). Taken together, the involvement of CK1, especially CK1δ, in the regulation of p53 and MDM2 functions as well as their interplay suggests an important role of CK1 in modulating the effects of p53 on cell growth and genome integrity.
Because of the phosphorylation of p53 and MDM2 by some CK1 isoforms in normal conditions or after DNA damage, and the link between E2F-1, MDM2, and p53 pathways, we set out to investigate the effects of CK1 depletion or inhibition on the expression of key proteins. Our data indicate that CK1, like MDM2, plays a fundamental role in regulating the steady-state levels of the p53 and E2F1 tumor suppressor proteins. The observation that a small molecule inhibitor of CK1 induces cell death also suggests CK1 might form an attractive target for anti-cancer therapeutics.
EXPERIMENTAL PROCEDURES
Cell Lines and Treatments
All of the experiments were performed with the A375 cell line, which is an adherent human amelanotic malignant melanoma cell line, and/or with HCT116 wt and p53−/− cell lines, which are adherent human colon carcinoma cell lines. The cell stocks were maintained in DMEM or McCoy's 5A, respectively (Invitrogen) supplemented with 10% fetal bovine serum (Autogen Bioclear). A375 cells were treated with x-ray irradiation at a dose of 5 grays using a cabinet x-ray system (Faxitron) and then returned to the incubator for 1–48 h. Untreated controls were included. D4476 (Calbiochem) was transfected using Attractene (Qiagen) into the cells as recommended by the supplier. The cells were treated with 5–40 μm of D4476 (final concentration) for 48 h. Mock transfected, DMSO solvent, and untreated controls were included. Nutlin-3 (Alexis® Biochemicals) was used directly by addition to the cell culture medium at 5 and 10 μm (final concentration) for 24 h. DMSO solvent and untreated controls were included.
Transient Transfection of siRNA
siRNA to specific target genes was obtained from Dharmacon. The genes targeted were CK1α (siGENOME SMARTpool against human CSNK1A1 (NM_001892)), CK1δ (siGENOME SMARTpool against human CSNK1D (NM_001893)), VRK1 (siGENOME SMARTpool against human VRK1 (NM_003384)), and p53 (siGENOME set of 4 siRNA duplexes against human TP53 (NM_000546)). siCONTROL nontargeting siRNA Pool#2 was used as a control. The cells were transfected using LipofectamineTM 2000 (Invitrogen) according to the manufacturer's instructions. The final concentration of siRNA used was 40 nm (or 80 nm when cells were transfected with two different siRNAs). The cells were incubated for 72 h. Lipofectamine (mock transfected) controls and untreated controls (DMEM only) were included.
Western Blotting
The cells were harvested and lysed in urea buffer (7 m urea, 0.1 m dithiothreitol, 0.05% Triton X-100, 25 mm NaCl, 20 mm HEPES-KOH, pH 7.6, 5 mm NaF, 2 mm Na3VO4, 2.5 mm Na4P2O7, 1× protease inhibitor mixture). Proteins (20 or 40 μg of lysate) were resolved by denaturing gel electrophoresis using 10 or 15% polyacrylamide gels in SDS running buffer. The proteins were transferred to Hybond-C Extra nitrocellulose membranes (Amersham Biosciences). The membranes were blocked in 5% (w/v) nonfat dried milk (Marvel) or 3% (w/v) bovine serum albumin for 1 h at room temperature and then incubated overnight at 4 °C with primary antibody (Table 1). The membranes were incubated with the appropriate horseradish peroxidase-conjugated secondary antibody (DAKO; Santa Cruz Biotechnology) for 1 h at room temperature. The proteins were detected by incubation with ECL reagent. The membranes were blotted dry and exposed to x-ray film (SLS), which was then developed (x-ray imaging equipment; Fuji).
TABLE 1.
Different primary antibodies used for Western Blotting and co-immunoprecipitation
| Target protein | Clone | Primary antibody type | Supplier |
|---|---|---|---|
| β-Actin | AC-15 | Mouse monoclonal | Sigma (A5441) |
| CK1α | C-19 | Goat polyclonal | Santa Cruz Biotechnology (SC-6477) |
| E2F-1 | KH95 | Mouse monoclonal | Santa Cruz Biotechnology (SC-251) |
| MDM2 | 2A10 | Mouse monoclonal | From Borek Vojtesekb |
| p21 | EA10 | Mouse monoclonal | Calbiochem (OP64) |
| pRB | G3–245 | Mouse monoclonal | BD Biosciences Pharmingen (554136) |
| p53 | DO1 | Mouse monoclonal | From Borek Vojtesekb |
| p53 | CM1a | Rabbit polyclonal | From Borek Vojtesekb |
| IRF1 | 20 | Mouse monoclonal | BD Biosciences (612047) |
a Used only for immunoprecipitation step of p53.
b Department of Experimental Oncology, Masaryk Memorial Cancer Institute, Brno, Czech Republic.
Co-immunoprecipitation from Cell Lysates
The cells were harvested and lysed in co-immunoprecipitation buffer (50 mm HEPES-NaOH, pH 7.2, 150 mm NaCl, 0.5% Tween 20, 1× protease inhibitor mixture). The lysates were precleared by incubation with Sepharose CL 4B (Sigma-Aldrich) and protein G-SepharoseTM 4 FastFlow (GE Healthcare) at 4 °C with gentle rotation for 40 min. Two μg of primary antibody (Table 1) was incubated with 500 μg of protein in the precleared lysate in a final volume of 200 μl for 2 h at 4 °C with gentle rotation. Two types of negative control were included: no antibody with precleared lysate and antibody with co-immunoprecipitation buffer only. Fifteen μl of protein G-Sepharose was then added to the above samples and incubated for 1 h at 4 °C with gentle rotation. Supernatant (flow-through) was collected, and the beads were washed four times with 500 μl of co-immunoprecipitation buffer. Fifty μl of 4× SDS sample buffer containing 0.2 m dithiothreitol was then added to the beads, the samples were boiled at 95 °C for 5 min, and the eluate was collected. The samples were analyzed by Western blotting.
Cell Cycle Analysis
Treated cells were trypsinized, pelleted, and resuspended in 300 μl of PBS. The PBS cell suspensions were mixed gently with 5 ml of ice-cold ethanol 70% and incubated at 4 °C overnight. Fixed cells were rehydrated in PBS for 10 min at room temperature and then pelleted by centrifugation. The cells were resuspended in 300 μl of PBS containing 50 μg/ml propidium iodide (Sigma) and 100 μg/ml RNase A (Sigma-Aldrich). Cell cycle profiles were obtained (from more than 10,000 cells) using a BD FACSAria II SORP flow cytometer (BD Biosciences) and analyzed with BD FACSDiva 6 and FlowJo7 software.
RESULTS
CK1α Depletion Using siRNA Activates p53
We had recently reported the co-purification of vaccinia-related kinase 1 (VRK1) and casein kinase 1 (CK1) in a screen for virus-induced p53 serine 20 kinases; CK1 was identified as a selective virus-induced kinase targeting p53 (13). To determine whether endogenous CK1α or VRK1 plays a role in regulating p53/MDM2 pathways in cycling cells, we transfected A375 cells with isoform-specific siRNA against CK1α (CSNK1A1 gene) or VRK1, which reduced the level of CK1α or VRK1, respectively, by 3-fold (Fig. 1). Interferon regulatory factor-1 levels were assessed to evaluate whether siRNA treatment triggered the up-regulation of this positive transcription factor for genes involved in immune response, cell growth regulation, and apoptosis in mammalian cells that can affect the p53 signaling pathway. The down-regulation of CK1α protein triggered p53, MDM2, and p21 increase, alongside a dephosphorylation of pRB (Fig. 1). These changes were not observed after treating cells with siRNA to VRK1 (Fig. 1).
FIGURE 1.
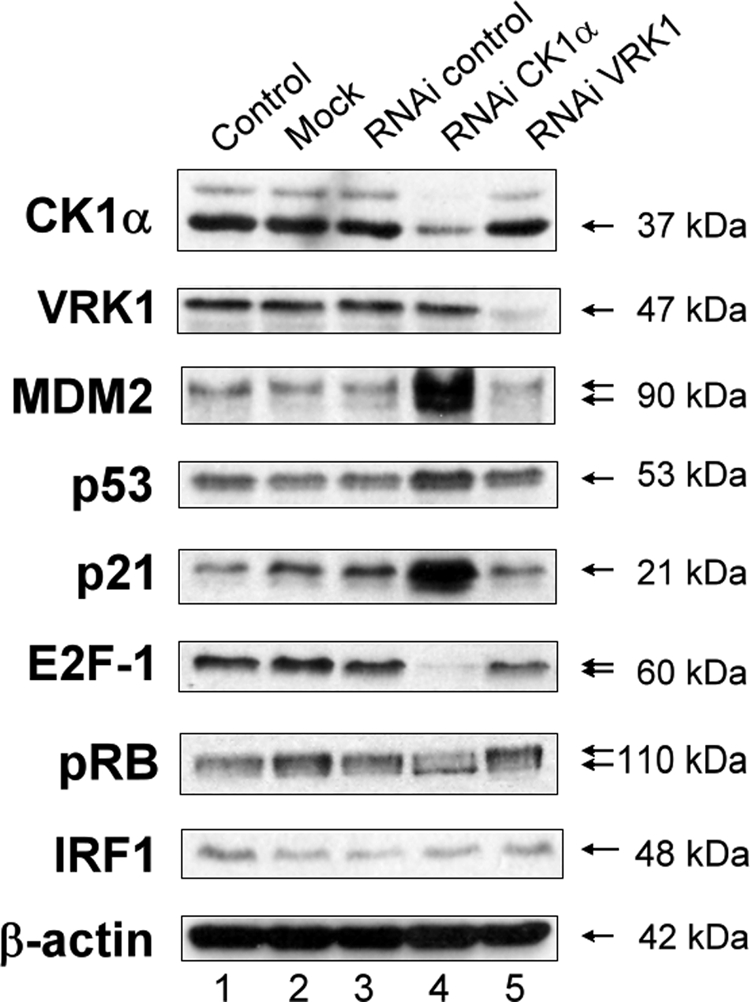
Effects of CK1α depletion using siRNA on p53 protein stability. A375 cells were transfected with control siRNA (40 nm; lane 3), CK1α-specific siRNA (40 nm; lane 4), or VRK1-specific siRNA (40 nm; lane 5) for 72 h. A mock transfected control (lane 2) and an untreated control (DMEM only; lane 1) were included. The protein levels were determined by Western blotting with antibodies against the indicated proteins. RNAi, RNA interference.
The previously documented ability of CK1 to induce MDM2 phosphorylation, which might control MDM2 ubiquitination activity (14), suggested that our results could be due to a disruption between MDM2 and p53 binding after CK1α depletion, leading to an increase of p53 and thus of the p53-inducible gene products MDM2 and p21. p21 is known for inhibiting cyclin·cyclin-dependent kinase complexes and thus can explain the dephosphorylated status of pRB when p21 increased. Furthermore, CK1α depletion after siRNA treatment led to a significant decrease of E2F-1 (Fig. 1), which might be explained by disruption of the stabilizing binding between E2F-1 and MDM2, which has been shown to displace other ubiquitin ligases from E2F-1 (15).
CK1 Inhibition Using a Specific Kinase Inhibitor Activates p53
To evaluate whether CK1α kinase activity was generating these protein level changes in p53 and E2F-1, we analyzed cell cycle targets using a specific kinase inhibitor. There are three main chemical inhibitors of CK1 that can be used, one of which, D4476, shows a more pronounced specificity for CK1 at low concentrations (16). Upon increasing the addition of D4476 to A375 cells, there was a dose-dependent reduction in E2F-1 protein levels (Fig. 2A), slightly more pronounced with 20 μm D4476. Interestingly, pRB simultaneously showed a decrease in its phosphorylation status (Fig. 2B). A dose-dependent increase in p53, MDM2, and p21 protein levels was also observed (Fig. 2A). These increases were especially pronounced with a concentration of 40 μm D4476 (Fig. 2A, lane 7 versus lane 1).
FIGURE 2.

A CK1 inhibitor leads to a dose-dependent increase of p53 function and a decrease of E2F-1 protein levels. A375 cells were transfected with increasing concentrations (10–60 μm) of the CK1 inhibitor D4476 for 48 h (lanes 4–7). A DMSO solvent control (lane 2), a mock transfected control (lane 3), and an untreated control (DMEM only; lane 1) were included. A, cell lysates were examined by Western blotting with antibodies against the indicated proteins. B, ratio of hyperphosphorylated pRB (upper band on the blot)/hypophosphorylated pRB (lower band) is defined by changes in mobility in SDS-PAGE (26) and was quantified using Scion Image software.
CK1δ siRNA Treatment Does Not Activate p53
Because the D4476 drug has been shown to efficiently inhibit at least the delta isoform of CK1, we decided to check whether or not the depletion of CK1 by siRNA treatment triggers the same effects as CK1α siRNA treatment. CK1δ depletion did not generate any increase of p53 or MDM2 protein levels (Fig. 3, lane 4 versus lane 3). Only p21 levels did increase significantly (Fig. 3). Thus we can hypothesize that the effects from D4476 treatment on A375 cells described above are CK1α-specific. Nevertheless it is possible that CK1δ siRNA treatment did not trigger what we expected because CK1δ expression is too low in this cell line. But in this latter case, it means that D4476 effects in the A375 cell line should be indeed mainly because of CK1α inhibition.
FIGURE 3.

Lack of effect of CK1δ depletion on p53 protein stability. A375 cells were transfected with control siRNA (40 nm; lane 3) or CK1δ-specific siRNA (40 nm; lane 4) for 72 h. A mock transfected control (lane 2) and an untreated control (DMEM only; lane 1) were included. Protein levels were determined by Western blotting with antibodies against the indicated proteins.
CK1α Depletion Using siRNA Has the Same Physiological Effect on p53 and E2F-1 Proteins as Ionizing Radiation
We studied changes in protein levels after the physiological stress of DNA damage induced by ionizing radiation. As expected, levels of p53 rose after exposure to 5 Grays of x-ray as did levels of MDM2, which is probably p53-dependent because of the feedback loop between MDM2 and p53 (Fig. 4A, lanes 1 and 2). Transactivation of p53 led also to an increasing up-regulation of p21; E2F-1 levels decreased 24 h after treatment (Fig. 4A, lanes 1 and 2). As for CK1α, the protein levels were not affected by ionizing radiation over a time course experiment (data not shown). This result favors the interpretation that CK1α promoter does not present a p53-responsive element, unlike CK1δ (11).
FIGURE 4.

CK1α depletion using siRNA displays a synergistic effect with ionizing radiation on E2F-1 destabilization. A375 cells were transfected with control or CK1α-specific siRNA (40 nm; lanes 5–8) for 72 h and treated with (even-numbered lanes) or without (odd-numbered lanes) 5-gray x-ray and cultured for a further 24 h. A mock transfected control (lanes 3 and 4) and an untreated control (DMEM only; lanes 1 and 2) were included. A, protein levels were determined by Western blotting with antibodies against the indicated proteins. B, quantification of different protein levels were determined with Scion Image software and normalized against β-actin protein level measured for each different blot. RNAi, RNA interference.
Next, we tested whether CK1α siRNA can cooperate with DNA damage to increase the p53, MDM2, and p21 protein levels and decrease the E2F-1 protein level (Fig. 4A, lanes 7 and 8, and B). A375 cells were transfected with control siRNA or CK1α siRNA for 72 h, followed either by a treatment with 5-Gray x-ray or control exposure, and cultured for a further 24 h. Interferon regulatory factor-1 levels were also assessed for the same reason as explained above. The results showed that p53 and MDM2 protein levels were increased after x-ray in the siRNA controls. These protein levels were also increased after CK1α siRNA treatment without x-ray treatment (slightly more than above) but were not further increased after x-ray treatment. By contrast, the decrease of E2F-1 protein level was two times more pronounced after x-ray than without in cells transfected with CK1α-specific siRNA. These data suggest that inhibition of CK1α expression followed by x-ray treatment shows a synergistic effect on E2F-1 levels.
E2F-1 Decrease Following CK1α siRNA or D4476 Treatment Is p53-independent
To determine whether E2F-1 decrease and MDM2 increase following CK1α siRNA treatment are dependent on the presence of p53, we first transfected A375 cells with both isoform-specific siRNA against CK1α and isoform-specific siRNA against p53. CK1α siRNA treatment triggered the same protein level changes as described above. p53 siRNA treatment alone triggered a decrease of p21 protein level but no change in E2F-1 and MDM2 protein levels (Fig. 5, A). Both siRNAs together reduced the level of CK1α and p53 by 3-fold compared with controls (Fig. 5, A). The results show that the p21 and MDM2 increases after CK1α siRNA treatment were abolished when p53 was also attenuated. This implies that the MDM2 and p21 increases after CK1α siRNA treatment seem to be entirely dependent on p53 transactivation. The E2F-1 decrease after CK1α siRNA treatment was partially abrogated when p53 was also depleted by siRNA, however p53 was only partially depleted by this treatment. To establish p53 dependence more clearly, we compared protein levels from HCT116 wt and HCT116 p53−/− cells, following D4476 treatment (Fig. 5, B and C). In HCT116 wt cells (Fig. 5B), the p53, MDM2, p21, and E2F-1 protein levels were affected in the same manner as in A375 cells after D4476 treatment (Fig. 2A), which indicated that these effects are not cell type-dependent. In HCT116 p53−/− cells after D4476 treatment, E2F-1 protein levels still decreased in a dose-dependent manner (Fig. 5C). All of these data suggest that the stabilization of E2F-1 observed when CK1α is present is p53-independent. This stabilization effect could operate by at least two different mechanisms: a direct effect of CK1α on E2F-1 and/or an indirect effect of CK1α mediated through MDM2.
FIGURE 5.

E2F-1 protein decrease following CK1α depletion using siRNA or D4476 treatment is p53-independent. A, A375 cells were transfected with control siRNA (80 nm; lane 3), CK1α-specific siRNA (40 and 40 nm of siRNA control; lane 4), p53-specific siRNA (40 and 40 nm of siRNA control; lane 5), or both CK1α and p53 siRNA (40 nm each; lane 6) for 72 h. A mock transfected control (lane 2) control and an untreated control (DMEM only; lane 1) were included. Protein levels were determined by Western blotting with antibodies against the indicated proteins. B and C, HCT116 wt (B) and HCT116 p53−/− (C) cells were transfected with increasing concentrations (5–40 μm) of the CK1 inhibitor D4476 for 72 h. A DMSO solvent control, an untreated control (DMEM only), and a mock transfected control were included. The protein levels were determined by Western blotting with antibodies against the indicated proteins. RNAi, RNA interference.
CK1α Forms a Stable Multiprotein Complex with MDM2 in Cells
MDM2 has been shown to interact with the CK1δ isoform, which phosphorylates the latter on serine residues 240, 242, and 246 in the acidic domain (14). However, transfected MDM2 has been shown not to bind to CK1α by immunoprecipitation (17). After DNA damage, p53 has also been shown to bind CK1δ and CK1ϵ isoforms (18) and to be phosphorylated at some sites by CK1α (13) and by CK1δ (12). To confirm the interaction spectrum of endogenous CK1α with our different key proteins p53, MDM2, and E2F-1, we tested whether endogenous CK1α co-immunoprecipitated with endogenous MDM2, p53, and E2F-1. Surprisingly, the three endogenous proteins showed significant binding to endogenous CK1α (Fig. 6, A and B, lower panels, lane 6, and C, lane 8). Although CK1α seemed to bind nonspecifically to the beads to some extent (Fig. 6, C, lower panel, lane 4, and A, lower panel, lane 2, respectively), with E2F-1 or MDM2 antibody bound to the beads, the co-immunoprecipitated CK1α band was more pronounced. Thus there appears to be stable complexes between CK1α and p53, between CK1α and MDM2, and also between CK1α and E2F-1 in unstressed A375 cells.
FIGURE 6.

A protein-protein interaction in cells between CK1α and MDM2. A–C, A375 cells analyzed by immunoprecipitation using antibodies to MDM2 (A), p53 DO1 (B), or E2F-1 (C). Co-immunoprecipitation was determined by Western blotting with anti-CK1α (A–C) and antibodies against the immunoprecipitated proteins (MDM2 (A), p53 CM1 (B), and E2F-1 (C)). No antibody immunoprecipitation controls (No Ab IP, lanes 1 and 2 (A and B) and lanes 3 and 4 (C)) and immunoprecipitation controls without lysate (lanes 3 and 4 (A and B) and lanes 5 and 6 (C)) were included. The flow-through (FT) and the final eluate (E) were analyzed, along with the original lysate and the pre-cleared lysate (lanes 1 and 2 (C)).
CK1α Inhibition or Depletion Using siRNA Displays the Same Effects as Nutlin-3 Treatment in wt Cells but Not in p53−/− Cells
We set out to determine whether these modifications following inhibition of CK1α expression or activity are similar to the effects induced by other known p53 activating molecules to identify the mechanism of action of CK1α. The first target we considered was MDM2 because of its previously documented link with CK1. Treatment of A375 cells (Fig. 7A) or HCT116 wt cells (Fig. 7B, lanes 1–4) with Nutlin-3 affected the MDM2, p53, p21, and E2F-1 protein levels and phosphorylation status of pRB in the same manner as CK1 inhibitor or siRNA treatment. Nutlin-3 molecule binds in the p53-binding pocket of MDM2 and displaces p53 from the complex. This results in p53 stabilization and p21 and MDM2 induction. Nutlin-3 affected the E2F-1 protein levels to the same extent as CK1α siRNA treatment. It has been shown recently that Nutlin inhibits the binding between MDM2 and E2F-1, which promotes the increased ubiquitination and subsequent proteosomal degradation of E2F-1 by other ubiquitin ligases (19). Thus we can conclude that CK1α, through MDM2 phosphorylation activity or interaction, in normal conditions, may promote the binding of MDM2 with p53 and E2F-1. In the context of HCT116 p53−/− cells (Fig. 7B, lanes 5–8), Nutlin-3 treatment did not affect the E2F-1 protein level in the same way that D4476 treatment did in the absence of p53 (Fig. 5C). This result highlights an interesting difference between the two drugs.
FIGURE 7.

Nutlin-3 modulates the levels of MDM2-binding proteins p53 and E2F-1. A375 (A), HCT116 wt (B, lanes 1–4), and HCT116 p53−/− (B, lanes 5–8) cells were treated for 24 h with 5 or 10 μm Nutlin-3 (lanes 3 and 4, respectively). A DMSO solvent control (lane 1) and an untreated control (DMEM only; lane 2) were included. The cell lysates were examined by Western blotting with antibodies against the indicated proteins.
D4476 Treatment Induces Apoptotic Cell Death of A375 Cells (Measured by Accumulation of a Sub-G0/G1 Cell Population)
After CK1α siRNA or D4476 treatment, A375 cells were observed to be proliferating slower, if at all, compared with controls, as if the treatment induced cell cycle arrest or apoptosis. To test this hypothesis, we stained the DNA of D4476-treated A375 cells with propidium iodide and analyzed the cell cycle distribution by flow cytometry (Fig. 8A). Cell cycle distribution profiles indicated that, upon increasing the addition of the drug to A375 cells, the incidence of a sub-G1 fraction (less than normal diploid DNA content) increased, implying a possible apoptotic effect of the CK1 inhibitor D4476 on cells. Interestingly, cell cycle distribution profiles upon Nutlin-3 treatment exhibited, to a smaller extent, an increase of the sub-G1 fraction (Fig. 8B). Moreover, Nutlin-3 was shown to display pro-apoptotic activity in mantle cell lymphoma (20), highlighting another common point between D4476 and Nutlin-3 treatment.
FIGURE 8.

Analysis of the effects of the CK1-specific inhibitor D4476 and MDM2 inhibitor Nutlin-3 on cell cycle distribution of A375 melanoma cells. A, A375 cells were transfected with increasing concentrations (10–40 μm) of the CK1 inhibitor D4476 for 72 h. A DMSO solvent control, an untreated control (DMEM only), and a mock transfected control (only the last one is shown here) were included. B, A375 cells were treated for 24 h with 5 or 10 μm Nutlin-3. A DMSO solvent control and an untreated control were included. The cells were fixed in ethanol and then stained with propidium iodide. Cell DNA contents were determined by FACS and analyzed with FlowJo7 software.
Apoptotically Induced Cell Death Following D4476 Treatment Is p53- independent
Taking into account the increase of a sub-G1 cell population following CK1 inhibition, we tested whether this protection against apoptotic events was p53-dependent or -independent in the same manner as previously, using HCT116 wt and p53−/− cells. As with A375 profiles (Fig. 8), upon increasing the addition of D4476, HCT116 wt cell cycle distribution profiles showed the appearance of a sub-G1 fraction (Fig. 9A). Interestingly, this apoptotic cell population was still observed in HCT116 cells in which p53 is absent (Fig. 9B). These findings suggest that the CK1 antagonist D4476 might be an effective agent in cancer cells with or without wild type p53, as has been suggested previously for Nutlin-3 (20). However, p53−/− and wt cells displayed different cell cycle profiles after Nultin-3 treatment (Fig. 10). Indeed in both HCT116 cell lines, only a slight increase of a sub-G0/G1 population was observed, especially in p53−/− cells. However, wt cell profiles (Fig. 10A) displayed a large increase in a G0/G1 cell population after Nutlin-3 treatment.
FIGURE 9.

Analysis of the effects of the CK1-specific inhibitor D4476 on cell cycle distribution of HCT116 wt and p53−/− cells. HCT116 wt (A) and HCT116 p53−/− (B) cells were transfected with increasing concentrations (10–40 μm) of the CK1 inhibitor D4476 for 72 h. A DMSO solvent control, an untreated control (DMEM only), and a mock transfected control (only the last one is shown here) were included. The cells were fixed in ethanol then stained with propidium iodide. Cell DNA contents were determined by FACS and analyzed with FlowJo7 software.
FIGURE 10.

Analysis of the effects of the MDM2 inhibitor Nutlin-3 on cell cycle distribution of HCT116 wt and p53−/− cells. HCT116 wt (A) and HCT116 p53−/− (B) cells were treated for 24 h with 5 or 10 μm Nutlin-3. A DMSO solvent control and an untreated control (DMEM only) were included. The cells were fixed in ethanol then stained with propidium iodide. The cell DNA contents were determined by FACS and analyzed with FlowJo7 software.
DISCUSSION
p53 tumor suppressor is a short lived transcription factor that is stabilized and activated in response to a wide variety of cellular stresses such as DNA damage. The oncoprotein MDM2 is a critical regulator of p53 that acts by mediating the ubiquitination and proteasome-dependent degradation of p53. The ability of MDM2 to modulate p53 levels is tightly regulated through a variety of protein-protein interactions and post-translational modifications such as phosphorylation in response to a range of cellular stresses.
Our recent data highlighted that CK1α is the major enzyme that catalyzes serine 20 site phosphorylation of p53 in DNA virus-infected cells. This suggests a previously undefined role for CK1α in linking the p53 checkpoint pathway to the cellular response to DNA virus infection (13). Moreover, several serine residues of MDM2 have been shown to be phosphorylated by CK1δ under normal conditions (14), and this phosphorylation is required for efficient MDM2-mediated p53 degradation. The present study investigates the link between CK1α and the p53-MDM2 pathway in cycling cells to further our understanding of the role of CK1α in regulating p53/MDM2/E2F-1 signal transduction pathways.
The data presented in our current report indicate that blocking MDM2 with Nutlin-3 or depleting/inhibiting CK1α generated the same effects: an increase in the p53, MDM2, and p21 protein levels and a decrease in the E2F-1 protein level (Table 2). Furthermore, the CK1 inhibitor D4476 or Nutlin-3 treatment led to the accumulation of an apoptotic sub-G0/G1 cell population. Based on the findings reported in this manuscript and other studies, we propose that one possible molecular mechanism through which the p53/MDM2 association is regulated would be due to the recruitment of protein kinases, such as CK1α studied in this report or CK1δ, which is known to phosphorylate the acidic domain of MDM2 in unstressed conditions (14). The down-regulation of p53 under normal conditions prevents the triggering of apoptosis but also prevents p21 from inhibiting cyclin·CDK complexes that phosphorylate pRB, thereby releasing E2F-1 and promoting cell cycle progression. Based on this model (Fig. 11), the inhibition of CK1α would be expected to lead to the dephosphorylation of MDM2, which in turn would lead to an increase of p53, MDM2, and p21 protein levels and consequently would trigger apoptosis (Figs. 8–10).
TABLE 2.
Summary of protein level changes in response to the main different conditions tested and on the different cell lines, A375 and/or HCT116: CK1α siRNA treatment, D4476 treatment, Nutlin-3, and x-ray
| CK1α siRNA | X-ray | D4476 | Nutlin-3 | D4476 on p53−/− cells | Nutlin-3 on p53−/− cells | |
|---|---|---|---|---|---|---|
| p53 | ↑ | ↑ | ↑ | ↑ | – | – |
| p21 | ↑ | ↑ | ↑ | ↑ | – | – |
| MDM2 | ↑ | ↑ | ↑ | ↑ | ↓ | → |
| E2F-1 | ↓ | ↓ | ↓ | ↓ | ↓ | → |
FIGURE 11.
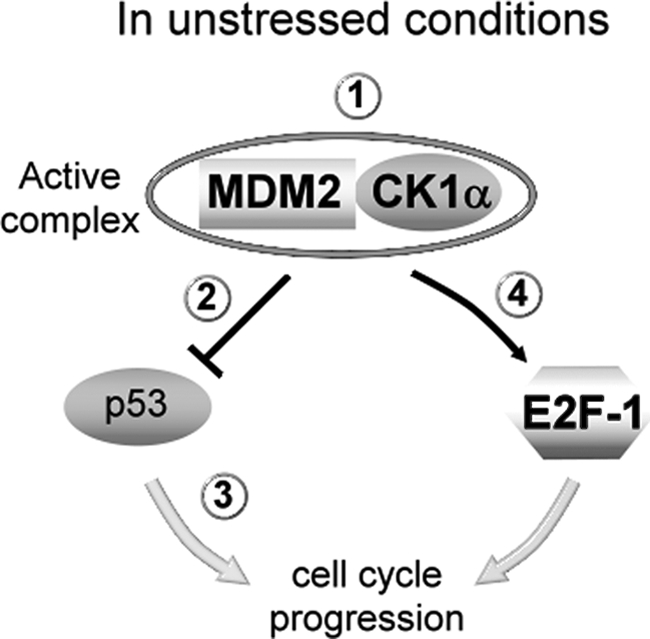
The MDM2 and CK1α complex form a genetic signal that regulates p53 and E2F-1 protein stability. Under normal conditions, CK1α interacts with MDM2 (condition 1), which promotes its binding to p53 and leads to p53 ubiquitination and degradation (condition 2) but also to inhibition of transactivation of p53 targets, p21 for example (condition 3). This is supported by our data: Nutlin-3 or CK1 depletion/inhibition stabilize p53 and p21, suggesting a pharmacologically similar interaction between p53 and the MDM2·CK1α complex. The interaction between MDM2 and CK1α should also allow the binding between E2F-1 and MDM2, an interaction that has been shown to prevent the degradation of E2F-1 by other E3-ligases (condition 4). This is also supported by the same data, but it is yet to be determined whether the MDM2-CK1α interaction and in turn whether CK1 binding to E2F-1 is phosphorylation-dependent or kinase docking-dependent. Under normal conditions, these phosphorylation or docking events mediated by CK1α therefore promote cell cycle progression. After DNA damage, the loss of the complex between MDM2 and CK1α could explain the destabilization of E2F-1. Alternatively, the MDM2·CK1α complex might be inactivated post-translationally, for example by changes in phosphorylation status. In addition, the destabilization of E2F-1 might be partly due to a loss of binding between CK1α and E2F-1.
Our results also suggest that CK1α interacts with MDM2 and that both the CK1 inhibitor D4476 and Nutlin-3 down-regulate E2F-1 protein levels. In a previous study (19), the loss of E2F-1 following Nutlin treatment seemed to be mediated by its increased ubiquitination and subsequent proteosomal degradation. MDM2 increases the E2F-1 protein half-life by inhibiting the ubiquitination of E2F-1 by displacing the E3 ubiquitin ligase SCFSkp2 from E2F-1 (15). We can venture the hypothesis that phosphorylation of MDM2 by CK1α should allow its binding with E2F-1, which is thus protected against degradation. Because the phosphorylation of MDM2 by CK1α appears to permit the binding of MDM2 with both p53 and E2F-1, we can infer that p53 and E2F-1 bind to the same MDM2-binding pocket. Indeed it was previously demonstrated that MDM2 shows a direct association with a region of E2F-1 that shares a substantial similarity with the MDM2-binding domain of p53 (21).
CK1α was also shown to interact with E2F-1, and destabilization of E2F-1 following CK1α siRNA treatment or inhibition was shown to be p53-independent. We can also hypothesize that CK1α in complex with MDM2 may also phosphorylate E2F-1, which should result in E2F-1 stabilization, in a similar way as phosphorylation of E2F-1 by ATM/ATR and Chk1/Chk2 kinases after DNA damage (22). Under these conditions, the inhibition of CK1α would be expected to lead to a decrease of E2F-1 protein levels, which is consistent with our findings. Finally, we can speculate that the observed simultaneous destabilization of E2F-1 after CK1 siRNA treatment or inhibition was mediated indirectly by the dephosphorylation of MDM2, as well as maybe directly by the dephosphorylation of E2F-1 itself, thus explaining the synergistic effect of CK1α siRNA treatment and ionizing radiation on E2F-1 level. Finally, the CK1 antagonist D4476 treatment induced apoptosis in cancer cells with or without the presence of p53, which is reminiscent of a previous report where Nutlin-3 was shown to generate a similar response in mantle cell lymphoma (20). Because D4476 treatment down-regulated E2F-1 protein level in a p53-independent manner, we can suggest that the apoptotic effect of CK1 inhibition is due to the loss of E2F-1.
The binding between p53 and CK1 highlighted in this study should allow the phosphorylation of p53 at some sites, such as threonine 18 after DNA damage (12) and serine 20 after DNA virus infection (13). It was also proposed that the interaction of CK1 with the multiprotein docking sites in the DNA-binding domain of p53 allows its subsequent binding to and phosphorylation of serine 20 and/or threonine 18 sites within the N-terminal transactivation domain of p53. We therefore postulate that under normal conditions, CK1 can bind to p53 but can only fully bind to and phosphorylate p53 after damage triggered by different stresses. Moreover, the acidic domain of MDM2 has been suggested to be hypophosphorylated in response to ionizing radiation, which contributes to p53 stabilization (23).
Therefore, CK1 may act as a key switch; in normal conditions (Fig. 11), CK1 promotes p53 degradation and inhibition by MDM2, but after DNA damage, CK1 phosphorylates p53, which leads to a disruption of MDM2·p53 complexes and thus p53-mediated tumor suppression consequences on the cells. It appears that CK1 or other kinases are recruited into specific complexes under different conditions, which can influence the substrate selectivity of the kinase. CK1α docking to MDM2 should phosphorylate or maintain MDM2 in a form that favors MDM2 activity. Thus CK1α and MDM2 could form a complex that can induce a genetic signal that controls the transcription factors E2F-1 and p53 (Fig. 11). For a better understanding of p53/MDM2 pathways, we need to determine how the MDM2·CK1 complex evolves after DNA damage and other stresses and resolve how CK1α is converted from an inhibitor of p53 to an activator of p53. Because the CK1 signaling pathway seems to coordinate p53/MDM2/E2F-1 in normal conditions as well as in response to various stresses applied to cells, CK1 could be an interesting target in the fight against cancer.
More interestingly, the CK1 inhibitor D4476 was shown to be efficient not only in tumor cells with wild type p53 but also in p53-null cells. Indeed, the importance of p53-independent functions that are essential for controlling tumorigenesis has recently been taken into consideration (24). For instance, MDM2 can influence apoptosis through its control of E2F-1. Thus MDM2 inhibition could increase the efficiency of cancer drug treatment, even in cells lacking p53. Another interesting point is that CK1α has been directly involved in regulating the p53 pathway by phosphorylation of MDMX, a recently identified homolog of MDM2 that can bind to p53 and inhibit its transcription function but that is not able to promote p53 ubiquitination or degradation (17). Because the MDMX/p53 interaction appears not to be disrupted efficiently by Nutlin-3 (25), developing a CK1 inhibitor against both MDM2 and MDMX could be a very attractive proposition. The next challenge will also be the generation of inhibitors specifically designed to inhibit one of the CK1 isoforms and to prevent the interaction of a CK1 isoform with defined substrates such as MDM2 and MDMX, without affecting its ability to phosphorylate and interact with regulatory proteins of other cellular pathways.
Acknowledgment
We thank Elisabeth Freyer (Flow Cytometry Facility, Medical Research Council Human Genetics Unit, Edinburgh, UK) for technical assistance with both the FACS machine and FlowJo7 software.
Footnotes
- MDM2
- murine double minute clone 2
- CK1
- casein kinase 1
- D4476
- 4[4-(2,3-dihydro-benzo[1,4]dioxin-6-yl)-5-pyridin-2-yl-1-H-imidazol-2-yl]benzamidine
- Nutlin-3
- (±)-4-[4,5-Bis(4-chlorophenyl)-2-(2-isopropoxy-4-methoxy-phenyl)-4,5-dihydro-imidazole-1-carbonyl]-piperazin-2-one
- VRK1
- vaccinia-related kinase 1
- siRNA
- small interfering RNA
- wt
- wild type
- DMEM
- Dulbecco's modified Eagle's medium
- DMSO
- dimethyl sulfoxide
- PBS
- phosphate-buffered saline
- FACS
- fluorescence-activated cell sorter.
REFERENCES
- 1.Lavin M. F., Gueven N. (2006) Cell Death Differ. 13, 941–950 [DOI] [PubMed] [Google Scholar]
- 2.Harms K., Nozell S., Chen X. (2004) Cell. Mol. Life Sci. 61, 822–842 [DOI] [PMC free article] [PubMed] [Google Scholar]
- 3.Toledo F., Wahl G. M. (2006) Nat. Rev. Cancer 6, 909–923 [DOI] [PubMed] [Google Scholar]
- 4.Marine J. C., Francoz S., Maetens M., Wahl G., Toledo F., Lozano G. (2006) Cell Death Differ. 13, 927–934 [DOI] [PubMed] [Google Scholar]
- 5.Iwakuma T., Lozano G. (2003) Mol. Cancer Res. 1, 993–1000 [PubMed] [Google Scholar]
- 6.Loughran O., La Thangue N. B. (2000) Mol. Cell. Biol. 20, 2186–2197 [DOI] [PMC free article] [PubMed] [Google Scholar]
- 7.Worrall E. G., Wawrzynow B., Worrall L., Walkinshaw M., Ball K. L., Hupp T. R. (2009) J. Chem. Biol. 2, 113–129 [DOI] [PMC free article] [PubMed] [Google Scholar]
- 8.Wallace M., Worrall E., Pettersson S., Hupp T. R., Ball K. L. (2006) Mol. Cell 23, 251–263 [DOI] [PubMed] [Google Scholar]
- 9.Pettersson S., Kelleher M., Pion E., Wallace M., Ball K. L. (2009) Biochem. J. 418, 575–585 [DOI] [PubMed] [Google Scholar]
- 10.Stevens C., Pettersson S., Wawrzynow B., Wallace M., Ball K., Zylicz A., Hupp T. R. (2008) FEBS J. 275, 4875–4886 [DOI] [PubMed] [Google Scholar]
- 11.Knippschild U., Gocht A., Wolff S., Huber N., Löhler J., Stöter M. (2005) Cell Signal. 17, 675–689 [DOI] [PubMed] [Google Scholar]
- 12.Sakaguchi K., Saito S., Higashimoto Y., Roy S., Anderson C. W., Appella E. (2000) J. Biol. Chem. 275, 9278–9283 [DOI] [PubMed] [Google Scholar]
- 13.MacLaine N. J., Oster B., Bundgaard B., Fraser J. A., Buckner C., Lazo P. A., Meek D. W., Höllsberg P., Hupp T. R. (2008) J. Biol. Chem. 283, 28563–28573 [DOI] [PMC free article] [PubMed] [Google Scholar]
- 14.Winter M., Milne D., Dias S., Kulikov R., Knippschild U., Blattner C., Meek D. (2004) Biochemistry 43, 16356–16364 [DOI] [PubMed] [Google Scholar]
- 15.Zhang Z., Wang H., Li M., Rayburn E. R., Agrawal S., Zhang R. (2005) Oncogene 24, 7238–7247 [DOI] [PubMed] [Google Scholar]
- 16.Rena G., Bain J., Elliott M., Cohen P. (2004) EMBO Rep. 5, 60–65 [DOI] [PMC free article] [PubMed] [Google Scholar]
- 17.Chen L., Li C., Pan Y., Chen J. (2005) Mol. Cell. Biol. 25, 6509–6520 [DOI] [PMC free article] [PubMed] [Google Scholar]
- 18.Knippschild U., Milne D. M., Campbell L. E., DeMaggio A. J., Christenson E., Hoekstra M. F., Meek D. W. (1997) Oncogene 15, 1727–1736 [DOI] [PubMed] [Google Scholar]
- 19.Ambrosini G., Sambol E. B., Carvajal D., Vassilev L. T., Singer S., Schwartz G. K. (2007) Oncogene 26, 3473–3481 [DOI] [PubMed] [Google Scholar]
- 20.Tabe Y., Sebasigari D., Jin L., Rudelius M., Davies-Hill T., Miyake K., Miida T., Pittaluga S., Raffeld M. (2009) Clin. Cancer Res. 15, 933–942 [DOI] [PMC free article] [PubMed] [Google Scholar]
- 21.Martin K., Trouche D., Hagemeier C., Sørensen T. S., La Thangue N. B., Kouzarides T. (1995) Nature 375, 691–694 [DOI] [PubMed] [Google Scholar]
- 22.Iaquinta P. J., Lees J. A. (2007) Curr. Opin. Cell Biol. 19, 649–657 [DOI] [PMC free article] [PubMed] [Google Scholar]
- 23.Blattner C., Hay T., Meek D. W., Lane D. P. (2002) Mol. Cell. Biol. 22, 6170–6182 [DOI] [PMC free article] [PubMed] [Google Scholar]
- 24.Bouska A., Eischen C. M. (2009) Trends Biochem. Sci 34, 279–286 [DOI] [PubMed] [Google Scholar]
- 25.Popowicz G. M., Czarna A., Rothweiler U., Szwagierczak A., Krajewski M., Weber L., Holak T. A. (2007) Cell Cycle 6, 2386–2392 [DOI] [PubMed] [Google Scholar]
- 26.Mittnacht S., Weinberg R. A. (1991) Cell 65, 381–393 [DOI] [PubMed] [Google Scholar]