Abstract
Glioblastomas (GBMs) are the most frequent and malignant brain tumors in adults. Glucocorticoids (GCs) are routinely used in the treatment of GBMs for their capacity to reduce the tumor-associated edema. Few in vitro studies have suggested that GCs inhibit the migration and invasion of GBM cells through the induction of MAPK phosphatase 1 (MKP-1). Macrophage migration inhibitory factor (MIF), an endogenous GC antagonist is up-regulated in GBMs. Recently, MIF has been involved in tumor growth and migration/invasion and specific MIF inhibitors have been developed on their capacity to block its enzymatic tautomerase activity site. In this study, we characterized several glioma cell lines for their MIF production. U373 MG cells were selected for their very low endogenous levels of MIF. We showed that dexamethasone inhibits the migration and invasion of U373 MG cells, through a glucocorticoid receptor (GR)- dependent inhibition of the ERK1/2 MAPK pathway. Oppositely, we found that exogenous MIF increases U373 MG migration and invasion through the stimulation of the ERK1/2 MAP kinase pathway and that this activation is CD74 independent. Finally, we used the Hs 683 glioma cells that are resistant to GCs and produce high levels of endogenous MIF, and showed that the specific MIF inhibitor ISO-1 could restore dexamethasone sensitivity in these cells. Collectively, our results indicate an intricate pathway between MIF expression and GC resistance. They suggest that MIF inhibitors could increase the response of GBMs to corticotherapy.
Introduction
Glioblastomas (GBMs)3 are the most frequent primitive cerebral tumor in adults. These highly invasive cancers are prone to infiltrate the surrounding brain parenchyma at considerable distance from the main tumor mass (1). This unavoidably leads to local recurrence and death despite combined surgery, irradiation, and chemotherapy (2, 3).
Glucocorticoids (GCs) are routinely used in the treatment of GBMs as they dramatically reduce the tumor-associated edema. There is growing evidence that GCs also inhibit glioma cell proliferation in vitro and tumor growth in vivo (reviewed in Ref. 4). The capacity of GCs to alter migration and invasion in gliomas has received less attention (5, 6). However, dexamethasone was reported to inhibit cell migration and invasion by opposing epidermal growth factor-induced enhancement of urokinase-type plasminogen activator and urokinase-type plasminogen activator receptor in squamous cell carcinoma cells (7), by modulating matrix metalloproteinase activity in vascular smooth muscle cells (8), by enhancing α1β1 integrin expression in human gastric carcinoma cells (9), and by altering the cytoskeleton of human neurobastoma cells (10). In gliomas, the exact mechanisms of this inhibition are yet largely unknown. Bauman et al. (5) showed that dexamethasone inhibits the migration/invasion of several glioma cell lines (C6, U251, U373, and A172) and that it enhances the inhibition induced by irradiation. Lin et al. (6) recently showed that dexamethasone decreases matrix metalloproteinase-2 secretion and inhibits invasion of U87 MG glioma cells through MAPK phosphatase 1 (MKP-1) induction.
Macrophage migration inhibitory factor (MIF) is one of the most up-regulated transcripts in GBMs (11, 12). MIF was initially described as a proinflammatory cytokine acting as an endogenous antagonist of GCs (13, 14). More recently, MIF has been shown to promote prostate cancer, lung adenocarcinoma, and proliferation and migration/invasion of neuroblastoma cells (15–17). In addition, specific MIF inhibitors have been developed on their capacity to block the enzymatic tautomerase activity site of the MIF peptide (18).
MIF and GCs have been shown to interact in several pathways: the AP-1 pathway (19, 20), the NF-κB pathway (21), and the ERK1/2 MAPK pathway (22). The ERK1/2 MAPK pathway has been linked to cell proliferation (reviewed in Ref. 23), migration and invasion (24, 25), and is particularly active in malignant gliomas through the epidermal growth factor receptor (for a review see Ref. 26). GCs have been shown to inhibit the ERK1/2 MAPK pathway by induction of MKP-1 and annexin A1 (ANXA1) expression (27) and phosphorylation of ANXA1 (28). Reciprocally, MIF activates the ERK1/2 MAP kinase pathway through phosphorylation of ERK1/2 following endocytosis or binding with CD74, the recently described MIF receptor (29), and overrides the GC-induced inhibition of the ERK1/2 MAPK pathway (22). In addition, MIF inhibits the induction of MKP-1 induced by GCs in macrophages (27, 30).
In this study, we tested the hypothesis that: 1) MIF and GCs exert opposite effects in GBMs, 2) their antagonism is mainly transduced by the ERK1/2 MAPK pathway, and 3) specific MIF inhibitors can increase the glioma cell response to GCs. We characterized several glioma cell lines for their MIF production and selected the U373 MG cell line for its very low MIF expression. U373 MG cells were treated with GCs and MIF, alone or in combination, and their effects on proliferation, migration, and invasion were analyzed. The mechanisms underlying the MIF-GCs antagonism were studied with particular emphasis on the ERK1/2 MAPK pathway, MKP-1, and ANXA1. Finally, we used the Hs 683 cell line, which produces high levels of MIF to test if the specific MIF inhibitor ISO-1 could increase the effects of GCs on glioma cells.
EXPERIMENTAL PROCEDURES
Cell Culture and Reagents
The human glioblastoma cells U373 MG were obtained from the European Collection of Cell Cultures (ECACC; C89081403). Human glioma cell lines U87 MG, T98G, and Hs 683 were obtained from the American Type Culture Collection (ATCC; HTB-14, CRL-1690, and HTB-138). The human glioma cell line LN-18 was obtained by courtesy of the Laboratory of Tumor Biology and Genetics, Neurosurgery Service, Centre Hospitalier Universitaire Vaudois (CHUV), Lausanne, Switzerland. The U87 MG, U373 MG, and T98G cells were routinely cultured in minimal essential medium + Glutamax®-I, containing 10% fetal bovine serum, penicillin (100 units/ml), and streptomycin (100 μg/ml), nonessential amino acids (0.1 mm), sodium pyruvate (1 mm), and sodium bicarbonate (1.5 g/liter). Hs 683 and LN-18 cells were routinely maintained in DMEM + 4.5 g/liter glucose + Glutamax®-I, containing 10% fetal bovine serum, penicillin (100 units/ml), streptomycin (100 μg/ml), nonessential amino acids (0.1 mm), and sodium bicarbonate (1.5 g/liter). Before treatment, cells were grown in DMEM/F-12 without phenol red, containing penicillin (100 units/ml) and streptomycin (100 μg/ml), nonessential amino acids (0.1 mm), sodium pyruvate (1 mm), and glutamine (2 mm) and 5% charcoal-treated fetal bovine serum for 24 to 48 h. For treatment, the medium was changed for DMEM/F-12 without phenol red, without fetal calf serum, and with 0.5% bovine serum albumin. Cells were maintained in a humidified incubator at 37 °C with 5% CO2. All culture reagents were purchased from Invitrogen. We used recombinant mouse MIF from R&D Systems Inc., Minneapolis, MN (1978-MF/CF), and recombinant human MIF, purified from Escherichia coli as previously described (31). Dexamethasone (D-1756), RU 486 (M 8046), and PD 98059 (P-215) were from Sigma. MIF antagonist ISO-1 (475837) was from Calbiochem, Darmstadt, Germany.
Semi-quantitative End Point PCR
3.5 × 10⁴ cells were grown in a 12-well culture plate for 24 h. Total RNA was extracted with the High Pure Isolation Kit (Roche Diagnostics GmbH, Mannheim, Germany) according to the manufacturer's protocol. Primers for human MIF, CD74, GR, MKP-1, and ANXA1 genes (GenBank) were chosen using the primer design software Primer Express™ (PerkinElmer Life Sciences). We conducted BLASTn (National Center for Biotechnology Information, Bethesda, MD) searches against dbEST and the nonredundant set of GenBank, EMBL, and DDBJ data base sequences to confirm the total gene specificity of the nucleotide sequences chosen for the primers. RT-PCR were performed starting with 10 ng of total RNA and using the GeneAmp Thermostable rTth reverse transcriptase RNA PCR kit (PerkinElmer Life Sciences). Characteristics of primers and RT-PCR are described in Table 1. PCR products were resolved on 10% polyacrylamide gels (Bio-Rad) and analyzed using a Fluor-S MultiImager (Bio-Rad) after gelstar staining (Molecular Probes, Eugene, OR). Specific mRNA levels were expressed as the ratio of specific transcripts/28 S rRNA. The experiment was repeated at least 2 times in duplicate.
TABLE 1.
RT-PCR characteristics
| Gene and accession number | Primers (forward and reverse) | Initial denaturation | PCR cycles |
Final elongation | Number of cycles | Expected size | ||
|---|---|---|---|---|---|---|---|---|
| Denaturation | Annealing | Elongation | ||||||
| MIF | 5′-GAACCGCTCCTACAGCAAGCT-3′ | 95 °C | 94 °C | 60 °C | 72 °C | 72 °C | 35 (U373 MG) | 121 bp |
| NM_002415 | 5′-GCGAAGGTGGAGTTGTTCCA-3′ | 2 min | 15 s | 30 s | 15 s | 2 min | 28 (other) | |
| CD74 | 5′-TGACCAGCGCGACCTTATCT-3′ | 95 °C | 94 °C | 52 °C | 72 °C | 72 °C | 38 | 223 bp |
| NM_00102515 | 5′-GTTCTCCAGCTGCAGGTTCT-3′ | 2 min | 15 s | 30 s | 15 s | 2 min | ||
| GR | 5′-TGATAGCTCTGTTCCAGACTCAAC-3′ | 95 °C | 94 °C | 60 °C | 72 °C | 72 °C | 26 | 269 bp |
| X03225 | 5′-AGGGTAGAGTCATTCTCTGCTCAT-3′ | 2 min | 15 s | 20 s | 20 s | 2 min | ||
| MKP-1 | 5′-CCTGACAGCGCGGAATCT-3′ | 95 °C | 94 °C | 50 °C | 72 °C | 72 °C | 30 | 221 bp |
| NM_004417 | 5′-TCCTCCACAGGGATGCTC-3′ | 2 min | 15 s | 20 s | 15 s | 2 min | ||
| ANXA1 | 5′-TGAGCCCCTATCCTACCTTCAATC-3′ | 95 °C | 94 °C | 68 °C | 72 °C | 72 °C | 20 | 209 bp |
| NM_000700.1 | 5′-TCAAGGTGACCTGTAAGGGCTTC-3′ | 2 min | 15 s | 20 s | 10 s | 2 min | ||
| 28 S rRNA | 5′-GTTCACCCACTAATAGGGAACGTGA-3′ | 95 °C | 94 °C | 66 °C | 72 °C | 72 °C | 15 | 212 bp |
| U13369 | 5′-GATTCTGACTTAGAGGCGTTCAGT-3′ | 2 min | 15 s | 20 s | 10 s | 2 min | ||
ELISA
50,000 cells were grown in a 6-well culture plate for 24 h. 100 μl of conditioned media was tested for human MIF using the DuoSet ELISA Development kit according to the manufacturer's protocol (DY289, R&D Systems). MIF protein quantities were normalized to the amount of total DNA per well, as measured by fluorimetric DNA titration according Labarca and Paigen (32). ELISA was repeated twice in duplicate.
Paraffin Immunohistochemistry
Sections (4 μm-thick) were cut from formalin-fixed, paraffin-embedded tissue. They were hydrated through graded alcohols and incubated in H2O2 (0.3% 15 min). Sections were autoclaved for 11 min at 126 °C in citrate buffer (pH 6) for antigen retrieval. They were incubated with primary Abs directed against MIF (monoclonal, mAB289 diluted 1:3000, R&D Systems) and anti-GR (monoclonal, NCL-GCA diluted 1:25, Novocastra Laboratories Ltd., Newcastle upon Tyne, United Kingdom) for 1 h at room temperature, followed by secondary Ab (K 4007 HRP mouse 3,3′-diaminobenzidine, K 4011 HRP rabbit 3,3′-diaminobenzidine, ENVISION Systems, DAKO, Glostrup, Denmark) for 30 min at room temperature. Positivity was visualized with 3,3′-diaminobenzidine (Dako). Negative controls were obtained by omitting the primary Abs. For MIF, pellets of U373 MG cells were used as an additional negative control.
MIF Genotype
Two MIF promoter polymorphisms (−173 G to C transition and seven copies of the CATT repeat) are associated with increased MIF expression and strongly associated with protein production. These genotypes were determined in U373 MG, U87 MG, T98G, LN-18, and Hs 683 cells by isolating genomic DNA from 1 × 10⁶ subconfluent cells using DNA Nucleospin Tissue (740952.250, Macherey-Nagel, Duren, Germany) and genotyping as described previously (33, 34).
Cortisol Quantification
Cells were plated in a 6-well tissue culture plate (70,000 cells per well) as described above. Treatments were started 24 h after plating. Conditioned media were collected after 24 h. Cortisol was quantified by the electrochemiluminescence immunoassay “ECLIA” technique, on Modular Analytics E170 (Roche Diagnostics GmbH).
Cell Proliferation Assay
Cells were plated in a 96-well tissue culture plate (625, 1,250, or 2,500 cells per well). Cell proliferation was performed after 48 h using the MTT kit as described by the manufacturer (Roche Diagnostics GmbH). The experiment was repeated at least eight times in duplicate. The data were expressed as mean ± S.E. and analyzed by paired t test; p < 0.05 (two-tailed) was considered statistically significant. Statistical analysis was performed using the Prism 4.0 software (GraphPad, San Diego, CA).
Modified Boyden Chamber Assay
Modified Boyden chamber assay was conducted in 24-well Transwell culture plates (Transwell® Permeable Support, 3422, Corning Inc., Corning, NY) containing microporous membranes (8.0 μm) coated with collagen IV (collagen from human placenta, 27663, Sigma) for the invasion assay. Cells (8 × 10⁴ for the migration assay; 2.5 × 10⁴ for the invasion assay) were added to the upper chamber containing serum-free medium (DMEM/F-12 without phenol red with 0.1% bovine serum albumin) and transmigration toward a serum gradient (DMEM/F-12 without phenol red with 1% bovine serum albumin and 1.5% fetal bovine serum for migration assay or 20% fetal bovine serum for invasion assay) continued for 6 h for the migration assay and 24 h for the invasion assay. Recombinant mMIF (50 ng/ml) and ISO-1 (100 or 1000 μm) were added to the lower compartment; dexamethasone (1 and 10 μm), RU 486 (10 μm), and/or PD 98059 (25 μm) were added to the cells in the upper chamber. The filters were then fixed in methanol for 20 min and stained with Giemsa for 30 min. The cells at the upper surface of the filters were wiped away with a cotton swab. Quantification of the invasion assay was performed by counting the number of cells at the lower surface of the filters (9 fields at 100-fold magnification). Data were expressed as average numbers of cells per treatment per ×100 fields ± S.E. and were analyzed by a two-tailed paired t test; p < 0.05 was considered statistically significant. Statistical analysis was performed using the Prism 4.0 software (GraphPad).
Western Blot Analysis
Cells samples were lysed with RIPA lysis buffer (50 mm Tris-HCl, pH 7.4, 150 mm NaCl, 1% Nonidet P-40, 1% Triton X-100, 1% sodium deoxycholate, 0.1% SDS, 5 mm iodoacetamide, 2 mm phenylmethylsulfonyl fluoride) then kept at −20 °C. Protein concentration was determined by using a DC protein assay kit (Bio-Rad). 5 to 10 μg of whole cell extracts were resolved on 10% SDS-PAGE. Proteins were transferred onto polyvinylidene difluoride membranes, then immunolabeled with the appropriate primary Abs and HRP-linked secondary Abs at the concentration recommended by the manufacturer. Immunocomplexes were visualized by a chemiluminescence reaction with ECL Western blotting substrate (Pierce) and scanned with a luminescent image analyzer LAS-4000 (Fujifilm). Protein loading was controlled by glyceraldehyde-3-phosphate dehydrogenase or total ERK1/2 MAPK immunodetection. Abs used were: rabbit anti-phospho-p44/42 MAPK Ab (ERK1/2) (number 9101, Cell Signaling Technology), rabbit anti-p44/42 MAPK Ab (number 9102, Cell Signaling Technology), anti-ANXA1 Ab (610067, BD Transduction), rabbit anti-glyceraldehyde-3-phosphate dehydrogenase Ab (number 2275-PC-1, R&D Systems), rabbit anti-MKP1 Ab (sc1199, Santa Cruz Biotechnology), mouse anti-GR Ab (NCL-GCA, Novocastra Laboratories Ltd.), goat anti-mouse IgG HRP linked Ab (number 7076, Cell Signaling Technology), and goat anti-rabbit IgG HRP-linked Ab (number 7074, Cell Signaling).
RESULTS
U373 MG Glioma Cells Express Very Low Levels of MIF and Have No Endogenous Production of Cortisol
RT-PCR, ELISA, and immunohistochemistry were used to characterize the expression of MIF in U373 MG, Hs 683, U87 MG, LN-18, and T98G glioma cell lines. U373 MG cells expressed very low baseline levels of MIF mRNA and protein in contrast to all other glioma cell lines (Table 2). Furthermore, exogenous dexamethasone at 1 and 10 μm did not increase MIF production by U373 MG cells (data not shown).
TABLE 2.
Characterization of U373 MG, Hs 683, U87 MG, LN-18, and T98G glioma cell lines
MIF promoter polymorphisms were determined by PCR and nucleotide sequencing.
| Cell line | MIF status |
CD74 status | Cortisol secretionc | GR status | ||||
|---|---|---|---|---|---|---|---|---|
| mRNA levela | Intracellular protein | Protein secretionb | −173 G/C single nucleotide polymorphism | Number of CATT repeats | ||||
| pg/ml/μg of DNA | ||||||||
| U373 MG | Low | −d,e | 0 | CC | 6 | −a | no secretion | +a,d,e |
| Hs 683 | High | +d,e | 54 | GC | 6 | +a | no secretion | +a,d,e |
| U87 MG | High | +d | 350 | GC | 6 | +a | NDf | +a,d |
| LN-18 | High | +d | 90 | GG | 6 | −a | ND | +a,d |
| T98G | High | +d | 145 | GC | 6 | +a | ND | +a,d |
a MIF, CD74, and GR expression was assessed by RT-PCR.
b MIF, CD74, and GR expression was assessed by ELISA.
c The endogenous cortisol production was assessed by ECLIA testing.
d MIF, CD74, and GR expression was assessed by immunohistochemistry.
e MIF, CD74, and GR expression was assessed by Western Blot.
f ND, not determined.
MIF production has been linked to MIF promoter polymorphism on −173 G/C and 5′-CATT repeats. Using nucleotide sequencing, we found that Hs 683, T98G, and U87 MG have a common −173 GC genotype, whereas U373 MG shows a unique homozygote −173 CC genotype and LN-18 has a homozygote −173 GG genotype. All cell lines show 6 CATT repeats (see Table 2). The ECLIA showed that U373 MG cells did not produce any endogenous cortisol, neither at baseline, nor after exposure to dexamethasone (1 or 10 μm) or MIF (50 or 250 ng/ml) (Table 2).
Dexamethasone Decreases the Proliferation, Migration, and Invasion of U373 MG Glioma Cells through a GR-dependent Mechanism and Inhibits the ERK1/2 MAP Kinase Pathway
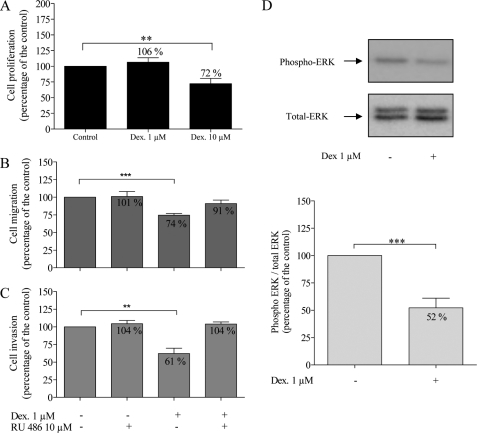
Dexamethasone (10 μm) significantly decreased U373 MG cell proliferation to 72% of control values (p = 0.0077), whereas it had no effect at 1 μm (Fig. 1A). Flow cytometry analysis showed no induction of apoptosis in U373 MG cells by dexamethasone at 1 and 10 μm (see supplementary data). Using the modified Boyden chamber migration and invasion assays, we showed that dexamethasone (1 μm) decreased cell migration to 74% of control values (Fig. 1B, p < 0.0001, r = 0.9573) and cell invasion to 61% of control values (Fig. 1C, p = 0.0015, r = 0.8498).
FIGURE 1.
Effects of dexamethasone (Dex) (1 and 10 μm) and RU 486 (10 μm) on U373 MG cells. Cell proliferation (A, n = 15) was evaluated after 48 h using the MTT assay. Migration (B, n = 7) and invasion (C, n = 5) were assessed using the modified Boyden chamber assays as described under “Experimental Procedures.” Representative Western blot of phospho-ERK1/2 and total ERK1/2 (D) and quantification of Western blot analysis (ratio of phospho-ERK1/2/total ERK1/2) (n = 9). *, p < 0.05; **, p < 0.01; ***, p < 0.005. Results are expressed as mean ± S.E. (error bars).
We used RU 486, a glucocorticoid receptor (GR) antagonist, to test whether the effects of dexamethasone on migration and invasion were mediated through interaction with GR. RU 486 at 10 μm did not modify the migration or invasion capacity of U373 MG cells when given alone but reversed the inhibition of dexamethasone on migration (74 to 91%, Fig. 1B) and invasion (61 to 104%, Fig. 1C), indicating that dexamethasone effects are GR-dependent.
We further tested if dexamethasone effects on U373 MG cells were mediated through the ERK1/2 MAPK pathway. Using Western blot, we found that dexamethasone decreased ERK1/2 phosphorylation 2-fold after 24 h (p = 0.0027) (Fig. 1D).
MIF Enhances the Proliferation, Migration, and Invasion of U373 MG Glioma Cells through a CD74-independent and Enzymatic Site-dependent Activation of ERK1/2 MAPK Pathway
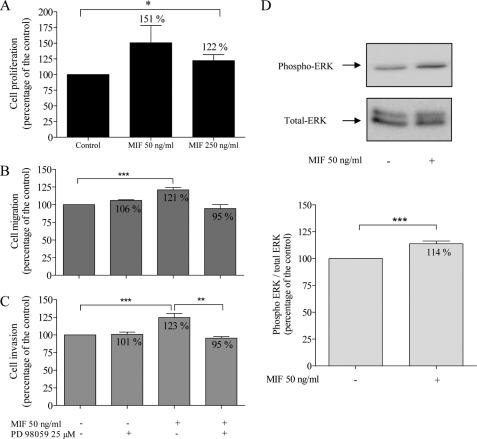
With the MTT proliferation assay, we showed that 50 and 250 ng/ml of MIF increased U373 MG cell proliferation, respectively, to 151 and 122% of control values (p = 0.0222, one-tailed analysis) (Fig. 2A).
FIGURE 2.
Effects of MIF (50 and 250 ng/ml) and PD 98058 (25 μm), a specific inhibitor of MEK1/2 phosphorylation, on U373 MG cells. Cell proliferation (A, n = 10) was evaluated after 48 h using the MTT assay. Migration (B, n = 7) and invasion (C, n = 5) were assessed using the modified Boyden chamber assay. Representative Western blot of phospho-ERK1/2 and total ERK1/2 (D) and quantification of Western blot analysis (ratio of phospho-ERK1/2/total ERK1/2) (n = 12). **, p < 0.01; ***, p < 0.005. Results are expressed as mean ± S.E. (error bars).
We further tested the MIF effects on migration and invasion. MIF increased U373 MG cell migration to 121% of control values (Fig. 2B, p < 0.0001, r = 0.9827) and also enhanced U373 MG invasion to 123% of the control (Fig. 2C, p = 0.0002, r = 0.9776).
We used PD 98059, a specific inhibitor of MEK1/2 phosphorylation to test if MIF effects on cell migration and invasion were mediated through the ERK1/2 MAPK pathway. Used alone, PD 98059 (25 μm) did not modify U373 MG cell migration (106% of control value, Fig. 2B) or invasion (101% of control value, Fig. 2C) but it overrode the stimulatory effect of MIF on cell migration (Fig. 2A) and invasion (Fig. 2B, p = 0.079). Moreover, MIF (50 mg/ml) induced ERK1/2 phosphorylation after 24 h (p = 0.0019) (Fig. 2D).
CD74 has been proposed as a potential membrane receptor for MIF, capable of promoting the activation of the ERK1/2 MAPK pathway. However, we surprisingly found no expression of CD74 in U373 MG cells by immunohistochemistry and RT-PCR, in basal conditions and after treatment with dexamethasone or MIF (Table 2 and Fig. 3).
FIGURE 3.
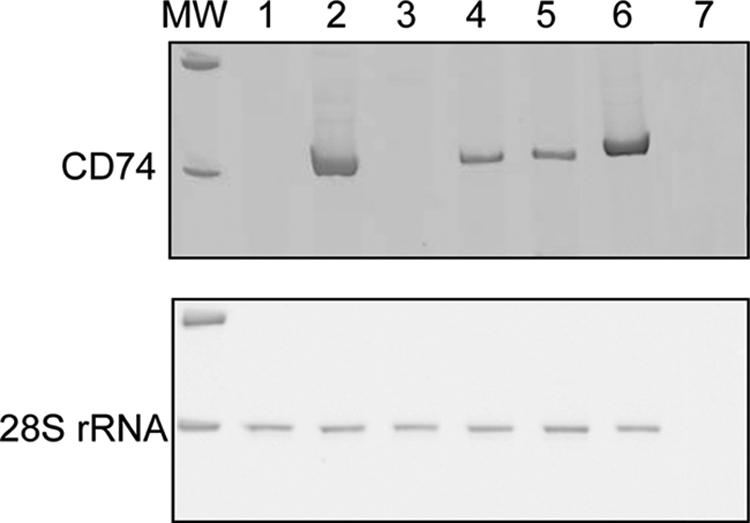
Expression of CD74 in U373 MG cells. RT-PCR for CD74 and 28 S in U373 MG cells (1), U87 MG cells (2), LN-18 cells (3), T98G cells (4), and Hs 683 cells (5). A sample of human glioblastoma (6) was used as positive control. H2O (7) was used as negative control (MW, molecular weight).
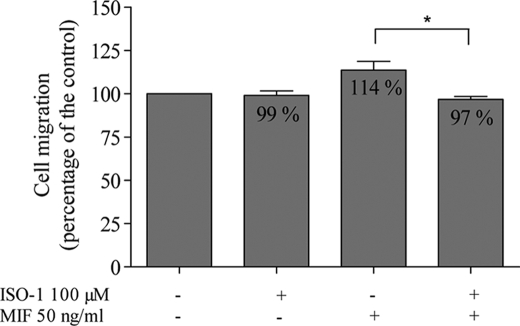
Some of the biological activities of MIF have been linked to its enzymatic site and have led to the synthesis of ISO-1, a specific inhibitor of the enzymatic site (35). Used alone at 100 μm, ISO-1 did not modify the migration of U373 MG cells. When added to MIF (50 ng/ml), ISO-1 completely abolished the stimulatory effect of MIF (Fig. 4, p = 0.0299, one-tailed analysis), suggesting that the effect of MIF on migration depends on its catalytic site.
FIGURE 4.
Effects of MIF (50 ng/ml) and ISO-1 (100 μm), a specific inhibitor of the enzymatic site of MIF, on migration of U373 MG cells (n = 3), assessed using the modified Boyden chamber assay. *, p < 0.05. Results are expressed as mean ± S.E. (error bars).
MIF Antagonizes the Dexamethasone-induced Inhibition of Migration and Invasion of U373 MG Glioma Cells through a MKP-1 and ANXA1-independent Mechanism
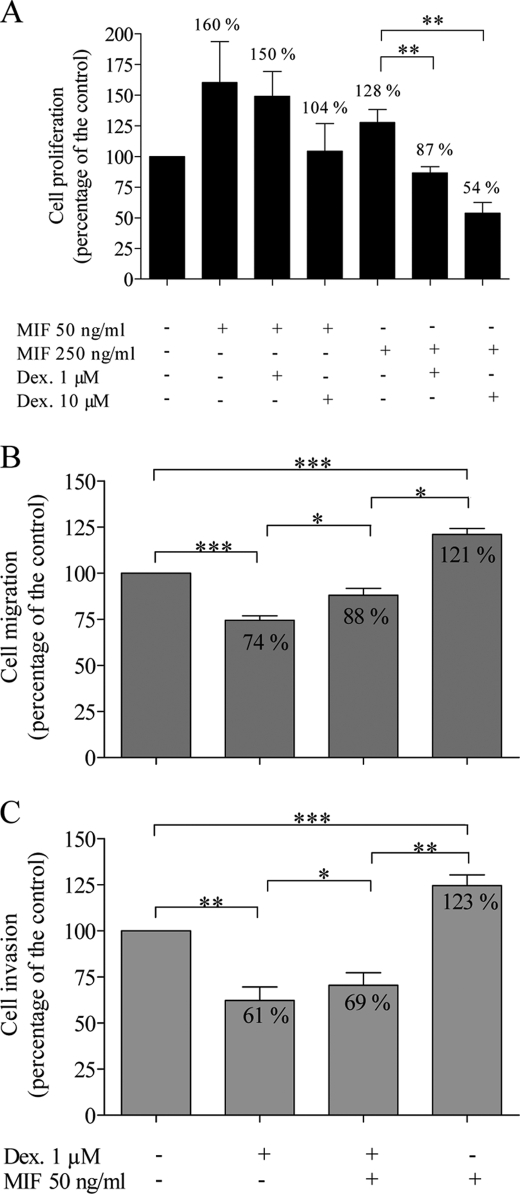
Dexamethasone at 1 (p = 0.0065) and 10 μm (p = 0.0015) abolished the stimulation of U373 MG cell proliferation induced by MIF at 250 ng/ml (Fig. 5A).
FIGURE 5.
Effects of dexamethasone (Dex 1 and 10 μm) and MIF (50 and 250 ng/ml) on U373 MG cells. Cell proliferation (A, n = 8) was evaluated after 48 h using the MTT assay. Migration (B, n = 7) and invasion (C, n = 5) were assessed using the modified Boyden chamber assay. *, p < 0.05; **, p < 0.01; ***, p < 0.005. Results are expressed as mean ± S.E. (error bars).
When MIF at 50 ng/ml was added to dexamethasone at 1 μm, U373 MG cell migration reaches 88% of controls (Fig. 5B). This value significantly differs from cell migration in the presence of MIF alone (121%) (p = 0.0496, r = 0.9909) or dexamethasone alone (74%) (p = 0.0276, r = 0.9762). Similarly, in the presence of MIF and dexamethasone, cell invasion reached an intermediate value at 69% of the control, differing significantly from values with MIF alone (123%) (p = 0.004, r = 0.7585) or with dexamethasone alone (61%) (p = 0.0262, r = 0.9891) (Fig. 5C).
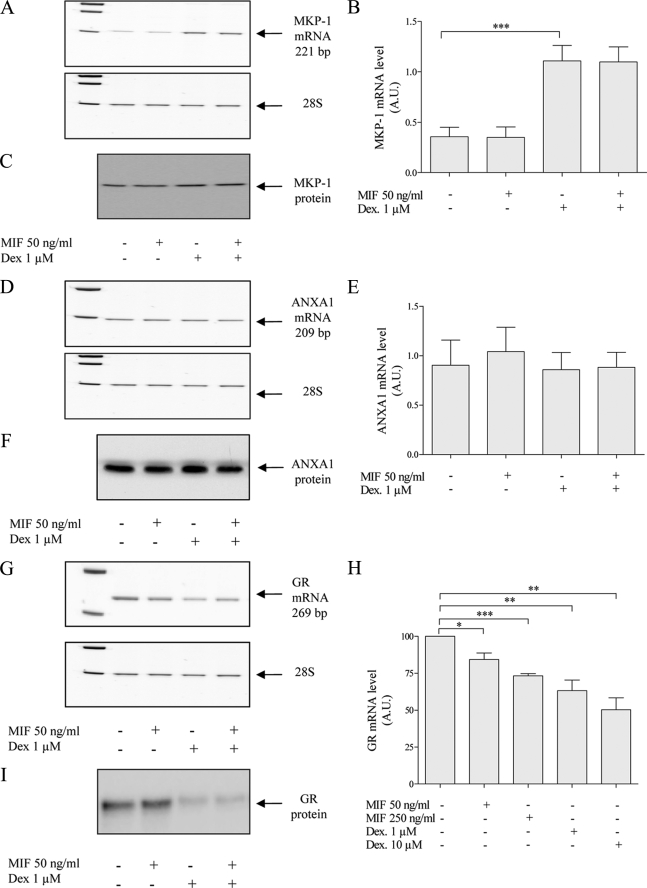
We have shown that MIF and GCs both act on the ERK1/2 MAPK pathway and modify ERK1/2 phosphorylation in opposite directions (see above). In inflammatory models, MKP-1 and ANXA1 have been proposed to be the targets of the MIF-GCs antagonism. Dexamethasone at 1 μm strongly enhanced the MKP-1 mRNA level (p = 0.0002) (Fig. 6, A and B), but did not modify protein expression after 24 h (Fig. 6C). By contrast, MIF at 50 ng/ml did not modify the basal expression levels of MKP-1 mRNA and protein levels and could not overcome the dexamethasone-induced MKP-1 overexpression. Furthermore, we did not observe any modification of the mRNA and protein levels of ANXA1 following treatment with dexamethasone (1 μm), MIF (50 ng/ml), or a combination (Fig. 6, D–F).
FIGURE 6.
Effects of dexamethasone (Dex) (1 and 10 μm) and MIF (50 and 250 ng/ml) on MKP-1, ANXA1, and GR mRNA and protein expression in U373 MG cells. A, D, and G, representative gels of RT-PCR products. B, E, and H, quantification of RT-PCR products normalized with the level of 28 S rRNA (n = 5 for MKP-1, n = 3 for ANXA1, n = 4–7 for GR). C, F, and I, representative Western blot of MKP-1, ANXA1, and GR. *, p < 0.05; **, p < 0.01; ***, p < 0.005. A.U., arbitrary units. Results are expressed as mean ± S.E. (error bars).
Because the effects of dexamethasone on U373 MG glioma cell migration and invasion are GR-dependent, we tested whether dexamethasone and MIF could modulate their GR expression. The GR mRNA level was down-regulated by dexamethasone at 1 (p = 0.0359, r = 0.21) and 10 μm (p = 0.0095, r = 0.26) (Fig. 6, G–I). Furthermore, dexamethasone decreased the protein level of GR. MIF also decreased the GR mRNA at 50 (p = 0.0192, r = 0.95) and 250 ng/ml (p = 0.0091, r = 0.94) but did not modulate the GR at the protein level.
ISO-1 Sensitizes the Hs 683 Glioma Cell Line to the Inhibitory Effects of GCs on Migration and Invasion
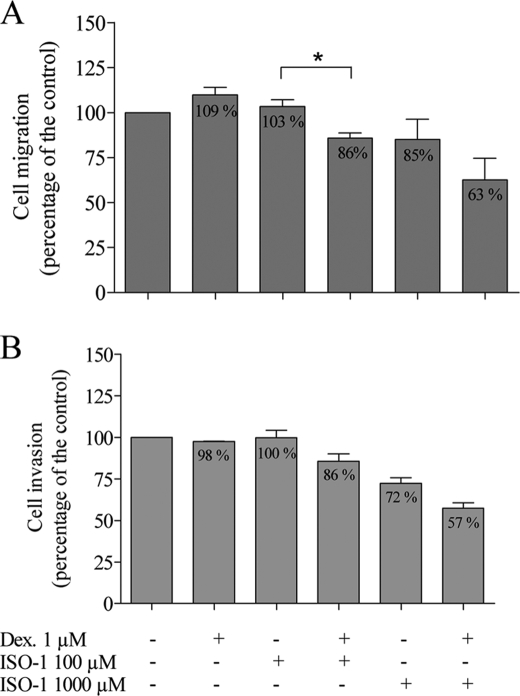
We tested the effects of dexamethasone on migration and invasion of the Hs 683 glioma cells, which produce endogenous MIF (Table 2). Dexamethasone did not exert any effect on the migration and invasion capacity of these cells (109 and 98% of the control, respectively) (Fig. 7). The MIF inhibitor ISO-1 had no effect on Hs 683 glioma cells at 100 μm but inhibited their migration and invasion at the dose of 1000 μm (85 and 72% of the control, respectively). Furthermore, when used in combination with 1 μm dexamethasone, ISO-1-sensitized Hs 683 glioma cells to the inhibitory effects of GCs on migration (86% with ISO-1 at 100 μm and 63% with ISO-1 at 1000 μm) and invasion (86% with ISO-1 at 100 μm and 57% with ISO-1 at 1000 μm).
FIGURE 7.
Effects of dexamethasone (Dex) (1 μm) and ISO-1 (100 μm and 1000 μm) on migration and invasion of Hs 683 cells. Migration (A, n = 3–9) and invasion (B, n = 3–9) were assessed using the modified Boyden chamber assay. Results are expressed as mean ± S.E. (error bars).
DISCUSSION
Glucocorticoids are routinely used in the treatment of glioblastomas either preoperatively, postoperatively, or in the course of radiotherapy. The benefit of their use has been associated with their capacity to reduce the tumor-associated edema (4). Very few in vitro studies have suggested that GCs can inhibit the migration and invasion of various glioma cell lines (5) and that this effect is linked to the induction of MKP-1 (6). Our results extend these observations to the glioma cell line U373 MG and suggest that the underlying mechanism involves a GR-dependent inhibition of the ERK1/2 MAPK pathway. This pathway is particularly active in GBMs due to frequent epidermal growth factor receptor amplification and/or mutation (36).
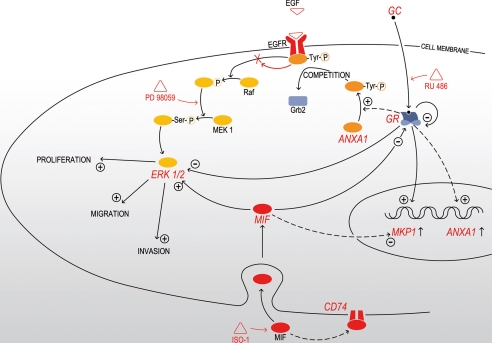
On the contrary, MIF has been shown to stimulate the growth and invasion of prostate carcinoma (15), lung adenocarcinoma (16), and neuroblastoma cells (17). We previously reported that MIF is highly expressed in GBMs (12). Here, we studied the effects of MIF on proliferation, migration, and invasion of glioma cell lines and its potential antagonism to GCs (summarized in Fig. 8). After characterization of several glioma cell lines, we selected U373 MG for its very low MIF production, and showed that exogenous MIF stimulates U373 MG cell proliferation, migration, and invasion through activation of the ERK1/2 MAPK pathway. CD74 has been proposed as a MIF cell surface receptor transducing ERK1/2 phosphorylation (29, 37). Surprisingly, U373 MG cells do not express CD74. This suggests that MIF could act by endocytosis, as previously described in NIH3T3 fibroblasts (38) or could use a different cell surface receptor, as CXCR2 and CXCR4, which have recently been identified as functional receptors for the MIF (39, 40). We are currently investigating those hypotheses in the U373 MG cell line.
FIGURE 8.
Mechanisms of MIF-GCs interactions in U373 MG glioma cells (continuous arrows) and inflammatory models (dashed arrows). GCs decrease cell proliferation, migration, and invasion through a GR-dependent mechanism and inhibit the ERK1/2 MAPK pathway by enhancing the expression of MKP-1 and ANXA1. MIF enhances cell proliferation, migration, and invasion through the enzymatic site-dependent activation of the ERK1/2 MAPK after endocytosis or interaction with CD74. Both GCs and MIF down-regulate the expression of GR. RU 486 is a GR antagonist, PD 98059 is a specific inhibitor of MEK1/2 phosphorylation, and ISO-1 is a specific inhibitor of the enzymatic site of MIF. EGFR, epidermal growth factor receptor.
The MIF protein presents an enzymatic site with tautomerase activity, for which potential substrates are actively searched (18). In this study, the stimulatory effects of MIF on glioma cells could be blocked by a specific inhibitor of MIF tautomerase activity, ISO-1 (35). Whether this inhibition is directly linked to MIF enzymatic properties or is dependent on other non-enzymatic activities involving the MIF catalytic site (protein conformation, receptor exposure) is still unknown. Mutations that block selectively the enzymatic activity of MIF variously affect MIF functions (41–43). One such mutation study has shown that the P2S mutant form of MIF keeps its in vitro anti-GC properties (44). Recently, a genetic approach consisting in the creation of a tautomerase-null knock-in mouse supported a role for protein-protein interactions rather than tautomerase activity (45).
In this study, GCs and MIF exerted an opposite modulation of the ERK1/2 MAPK pathway. These effects could be consistently shown at 24 h (sustained activation) but not always in shorter time intervals (data not shown). The lability of ERK1/2 activation and its dependence on various factors such as pH, temperature, volume, salt concentration, and cell stress has already been emphasized by others and may account for the lack of reproducibility at early time intervals (38). However, the persistence of GCs and MIF effects on the ERK1/2 MAPK pathway beyond 24 h has important implications as ERK1/2 MAPK activation subsides after 90 min in physiological conditions and as the temporal pattern of activation (i.e. transient versus sustained) has been reported to orientate the cell response (46).
Here we show that GCs can reduce the expression of their own receptor in the U373 MG cell line. This observation has been made in other cell lines as well (47). Interestingly, we found that MIF reduces GR transcription, although there was no change at the GR protein level. We are currently investigating the possibility that MIF could affect GR by post-translational changes, such as phosphorylation. Classically, GR is phosphorylated after combining with its ligand and it is this phosphorylation process that determines the specificity of the linkage to the target promoter, the interaction with co-factors, the intensity and duration of the signaling, and GR stability (48, 49).
Because most GBMs produce MIF abundantly (12), it was important to investigate whether an anti-MIF strategy could increase the inhibitory effects of GCs on glioma cell migration/invasion. Our observations with the Hs 683 cell line suggest that GC resistance is related to MIF production and that ISO-1 can sensitize glioma cells to GC inhibitory effects. These experiments will have to be extended to in vivo models of tumor xenografts as there are important potential applications for the treatment of human gliomas. Indeed, current adjuvant treatments such as radiotherapy and chemotherapy are mainly targeting proliferating cells. Continuous efforts are made to identify new molecules that could act on the invasive tumor component, which is typically slow or nonproliferating (50). ISO-1, in combination with GCs, could be a valuable adjunct to the current therapeutic arsenal used in glioblastomas.
Supplementary Material
Acknowledgments
We thank Olivier Hougrand and Marie-Rose Pignon for precious technical assistance. We also thank Dr. Françoise Luyckx from Clinical Chemistry, CHU Sart Tilman, Liège, for cortisol quantification.
This work was supported in part by Framework Programme 6-NOE (FP6) Grant LSHM-CT-2004-512040 (EMBIC), the Fonds de la Recherche Scientifique Médicale, the Fonds National de la Recherche Scientifique (F.N.R.S., Belgium), Swiss National Science Foundation Grant 310000-118266, the Fonds spéciaux de la Recherche, the Centre Anticancéreux près l'Université de Liège, the Fonds Léon Fredericq (University of Liège), the Fonds Social Européen, the Fonds d'Investissements de la Recherche Scientifique (CHU, Liège, Belgium), and the Interuniversity Attraction Poles Programme-Belgian Science Policy (Brussels, Belgium).

The on-line version of this article (available at http://www.jbc.org) contains supplemental data and Fig. S1.
- GBMs
- glioblastomas
- GCs
- glucocorticoids
- MIF
- macrophage migration inhibitory factor
- MKP-1
- MAPK phosphatase 1
- ANXA1
- annexin A1
- GR
- glucocorticoid receptor
- MAPK
- mitogen-activated protein kinase
- MEK
- mitogen-activated protein kinase/extracellular signal-regulated kinase
- ERK
- extracellular signal-regulated kinase
- ECLIA
- electrochemiluminescence immunoassay
- DMEM
- Dulbecco's modified Eagle's medium
- RT
- reverse transcriptase
- ELISA
- enzyme-linked immunosorbent assay
- Ab
- antibody
- HRP
- horseradish peroxidase
- MTT
- 3-(4,5-dimethylthiazol-2-yl)-2,5-diphenyltetrazolium bromide.
REFERENCES
- 1.Giese A., Bjerkvig R., Berens M. E., Westphal M. (2003) J. Clin. Oncol. 21, 1624–1636 [DOI] [PubMed] [Google Scholar]
- 2.Stupp R. (2007) Ann. Oncol. 18, Suppl. 2, ii69– ii70 [DOI] [PubMed] [Google Scholar]
- 3.Brandes A. A. (2003) Semin. Oncol. 30, 4–9 [DOI] [PubMed] [Google Scholar]
- 4.Piette C., Munaut C., Foidart J. M., Deprez M. (2006) Acta Neuropathol. 112, 651–664 [DOI] [PubMed] [Google Scholar]
- 5.Bauman G. S., MacDonald W., Moore E., Ramsey D. A., Fisher B. J., Amberger V. R., Del Maestro R. M. (1999) J. Neurooncol. 44, 223–231 [DOI] [PubMed] [Google Scholar]
- 6.Lin Y. M., Jan H. J., Lee C. C., Tao H. Y., Shih Y. L., Wei H. W., Lee H. M. (2008) Eur. J. Pharmacol. 593, 1–9 [DOI] [PubMed] [Google Scholar]
- 7.Shiratsuchi T., Ishibashi H., Shirasuna K. (2002) J. Cell. Physiol. 193, 340–348 [DOI] [PubMed] [Google Scholar]
- 8.Pross C., Farooq M. M., Angle N., Lane J. S., Cerveira J. J., Xavier A. E., Freischlag J. A., Law R. E., Gelabert H. A. (2002) J. Surg. Res. 102, 57–62 [DOI] [PubMed] [Google Scholar]
- 9.Murakami N., Fukuchi S., Takeuchi K., Hori T., Shibamoto S., Ito F. (1998) J. Cell. Physiol. 176, 127–137 [DOI] [PubMed] [Google Scholar]
- 10.Casulari L. A., Dondi D., Maggi R., Demissie M., Piccolella M., Piva F. (2006) Braz. J. Med. Biol. Res. 39, 1233–1240 [DOI] [PubMed] [Google Scholar]
- 11.Markert J. M., Fuller C. M., Gillespie G. Y., Bubien J. K., McLean L. A., Hong R. L., Lee K., Gullans S. R., Mapstone T. B., Benos D. J. (2001) Physiol. Genomics 5, 21–33 [DOI] [PubMed] [Google Scholar]
- 12.Munaut C., Boniver J., Foidart J. M., Deprez M. (2002) Neuropathol. Appl. Neurobiol. 28, 452–460 [DOI] [PubMed] [Google Scholar]
- 13.Bacher M., Metz C. N., Calandra T., Mayer K., Chesney J., Lohoff M., Gemsa D., Donnelly T., Bucala R. (1996) Proc. Natl. Acad. Sci. U.S.A. 93, 7849–7854 [DOI] [PMC free article] [PubMed] [Google Scholar]
- 14.Calandra T., Bernhagen J., Metz C. N., Spiegel L. A., Bacher M., Donnelly T., Cerami A., Bucala R. (1995) Nature 377, 68–71 [DOI] [PubMed] [Google Scholar]
- 15.Meyer-Siegler K. L., Iczkowski K. A., Leng L., Bucala R., Vera P. L. (2006) J. Immunol. 177, 8730–8739 [DOI] [PubMed] [Google Scholar]
- 16.Rendon B. E., Roger T., Teneng I., Zhao M., Al-Abed Y., Calandra T., Mitchell R. A. (2007) J. Biol. Chem. 282, 29910–29918 [DOI] [PubMed] [Google Scholar]
- 17.Ren Y., Chan H. M., Fan J., Xie Y., Chen Y. X., Li W., Jiang G. P., Liu Q., Meinhardt A., Tam P. K. (2006) Oncogene 25, 3501–3508 [DOI] [PubMed] [Google Scholar]
- 18.Rosengren E., Bucala R., Aman P., Jacobsson L., Odh G., Metz C. N., Rorsman H. (1996) Mol. Med. 2, 143–149 [PMC free article] [PubMed] [Google Scholar]
- 19.Kleemann R., Hausser A., Geiger G., Mischke R., Burger-Kentischer A., Flieger O., Johannes F. J., Roger T., Calandra T., Kapurniotu A., Grell M., Finkelmeier D., Brunner H., Bernhagen J. (2000) Nature 408, 211–216 [DOI] [PubMed] [Google Scholar]
- 20.De Bosscher K., Vanden Berghe W., Haegeman G. (2003) Endocr. Rev. 24, 488–522 [DOI] [PubMed] [Google Scholar]
- 21.Daun J. M., Cannon J. G. (2000) Am. J. Physiol. Regul. Integr. Comp. Physiol. 279, R1043–R1049 [DOI] [PubMed] [Google Scholar]
- 22.Mitchell R. A., Metz C. N., Peng T., Bucala R. (1999) J. Biol. Chem. 274, 18100–18106 [DOI] [PubMed] [Google Scholar]
- 23.Roux P. P., Blenis J. (2004) Microbiol. Mol. Biol. Rev. 68, 320–344 [DOI] [PMC free article] [PubMed] [Google Scholar]
- 24.Huang C., Jacobson K., Schaller M. D. (2004) J. Cell Sci. 117, 4619–4628 [DOI] [PubMed] [Google Scholar]
- 25.Reddy K. B., Nabha S. M., Atanaskova N. (2003) Cancer Metastasis Rev. 22, 395–403 [DOI] [PubMed] [Google Scholar]
- 26.Kapoor G. S., O'Rourke D. M. (2003) Neurosurgery 52, 1425–1434 [DOI] [PubMed] [Google Scholar]
- 27.Roger T., Chanson A. L., Knaup-Reymond M., Calandra T. (2005) Eur. J. Immunol. 35, 3405–3413 [DOI] [PubMed] [Google Scholar]
- 28.Croxtall J. D., Choudhury Q., Flower R. J. (2000) Br. J. Pharmacol. 130, 289–298 [DOI] [PMC free article] [PubMed] [Google Scholar]
- 29.Leng L., Metz C. N., Fang Y., Xu J., Donnelly S., Baugh J., Delohery T., Chen Y., Mitchell R. A., Bucala R. (2003) J. Exp. Med. 197, 1467–1476 [DOI] [PMC free article] [PubMed] [Google Scholar]
- 30.Aeberli D., Yang Y., Mansell A., Santos L., Leech M., Morand E. F. (2006) FEBS Lett. 580, 974–981 [DOI] [PubMed] [Google Scholar]
- 31.Bernhagen J., Mitchell R. A., Calandra T., Voelter W., Cerami A., Bucala R. (1994) Biochemistry 33, 14144–14155 [DOI] [PubMed] [Google Scholar]
- 32.Labarca C., Paigen K. (1980) Anal. Biochem. 102, 344–352 [DOI] [PubMed] [Google Scholar]
- 33.Baugh J. A., Chitnis S., Donnelly S. C., Monteiro J., Lin X., Plant B. J., Wolfe F., Gregersen P. K., Bucala R. (2002) Genes Immun. 3, 170–176 [DOI] [PubMed] [Google Scholar]
- 34.Berdeli A., Mir S., Ozkayin N., Serdaroglu E., Tabel Y., Cura A. (2005) Pediatr. Nephrol. 20, 1566–1571 [DOI] [PubMed] [Google Scholar]
- 35.Lubetsky J. B., Dios A., Han J., Aljabari B., Ruzsicska B., Mitchell R., Lolis E., Al-Abed Y. (2002) J. Biol. Chem. 277, 24976–24982 [DOI] [PubMed] [Google Scholar]
- 36.Kapoor G. S., O'Rourke D. M. (2003) Cancer Biol. Ther. 2, 330–342 [DOI] [PubMed] [Google Scholar]
- 37.Leng L., Bucala R. (2006) Cell Res. 16, 162–168 [DOI] [PubMed] [Google Scholar]
- 38.Lue H., Kapurniotu A., Fingerle-Rowson G., Roger T., Leng L., Thiele M., Calandra T., Bucala R., Bernhagen J. (2006) Cell Signal. 18, 688–703 [DOI] [PubMed] [Google Scholar]
- 39.Bernhagen J., Krohn R., Lue H., Gregory J. L., Zernecke A., Koenen R. R., Dewor M., Georgiev I., Schober A., Leng L., Kooistra T., Fingerle-Rowson G., Ghezzi P., Kleemann R., McColl S. R., Bucala R., Hickey M. J., Weber C. (2007) Nat. Med. 13, 587–596 [DOI] [PubMed] [Google Scholar]
- 40.Schwartz V., Lue H., Kraemer S., Korbiel J., Krohn R., Ohl K., Bucala R., Weber C., Bernhagen J. (2009) FEBS Lett. 583, 2749–2757 [DOI] [PMC free article] [PubMed] [Google Scholar]
- 41.Hermanowski-Vosatka A., Mundt S. S., Ayala J. M., Goyal S., Hanlon W. A., Czerwinski R. M., Wright S. D., Whitman C. P. (1999) Biochemistry 38, 12841–12849 [DOI] [PubMed] [Google Scholar]
- 42.Swope M., Sun H. W., Blake P. R., Lolis E. (1998) EMBO J. 17, 3534–3541 [DOI] [PMC free article] [PubMed] [Google Scholar]
- 43.Onodera S., Kaneda K., Mizue Y., Koyama Y., Fujinaga M., Nishihira J. (2000) J. Biol. Chem. 275, 444–450 [DOI] [PubMed] [Google Scholar]
- 44.Bendrat K., Al-Abed Y., Callaway D. J., Peng T., Calandra T., Metz C. N., Bucala R. (1997) Biochemistry 36, 15356–15362 [DOI] [PubMed] [Google Scholar]
- 45.Fingerle-Rowson G., Kaleswarapu D. R., Schlander C., Kabgani N., Brocks T., Reinart N., Busch R., Schütz A., Lue H., Du X., Liu A., Xiong H., Chen Y., Nemajerova A., Hallek M., Bernhagen J., Leng L., Bucala R. (2009) Mol. Cell. Biol. 29, 1922–1932 [DOI] [PMC free article] [PubMed] [Google Scholar]
- 46.Vojtek A. B., Der C. J. (1998) J. Biol. Chem. 273, 19925–19928 [DOI] [PubMed] [Google Scholar]
- 47.Oakley R. H., Cidlowski J. A. (1993) Crit. Rev. Eukaryot. Gene Expr. 3, 63–88 [PubMed] [Google Scholar]
- 48.Ismaili N., Garabedian M. J. (2004) Ann. N.Y. Acad. Sci. 1024, 86–101 [DOI] [PubMed] [Google Scholar]
- 49.Ortí E., Hu L. M., Munck A. (1993) J. Biol. Chem. 268, 7779–7784 [PubMed] [Google Scholar]
- 50.Giese A., Loo M. A., Tran N., Haskett D., Coons S. W., Berens M. E. (1996) Int. J. Cancer 67, 275–282 [DOI] [PubMed] [Google Scholar]
Associated Data
This section collects any data citations, data availability statements, or supplementary materials included in this article.


