

Abstract
Loss of neurotransmitter receptors, especially glutamate and dopamine receptors, is one of the pathologic hallmarks of brains of patients with Huntington disease (HD). Transgenic mice that express exon 1 of an abnormal human HD gene (line R6/2) develop neurologic symptoms at 9–11 weeks of age through an unknown mechanism. Analysis of glutamate receptors (GluRs) in symptomatic 12-week-old R6/2 mice revealed decreases compared with age-matched littermate controls in the type 1 metabotropic GluR (mGluR1), mGluR2, mGluR3, but not the mGluR5 subtype of G protein-linked mGluR, as determined by [3H]glutamate receptor binding, protein immunoblotting, and in situ hybridization. Ionotropic α-amino-3-hydroxy-5-methyl-4-isoxazolepropionic acid and kainate receptors were also decreased, while N-methyl-d-aspartic acid receptors were not different compared with controls. Other neurotransmitter receptors known to be affected in HD were also decreased in R6/2 mice, including dopamine and muscarinic cholinergic, but not γ-aminobutyric acid receptors. D1-like and D2-like dopamine receptor binding was drastically reduced to one-third of control in the brains of 8- and 12-week-old R6/2 mice. In situ hybridization indicated that mGluR and D1 dopamine receptor mRNA were altered as early as 4 weeks of age, long prior to the onset of clinical symptoms. Thus, altered expression of neurotransmitter receptors precedes clinical symptoms in R6/2 mice and may contribute to subsequent pathology.
Huntington disease (HD) is an autosomal dominantly inherited progressive neuropsychiatric disease that starts in midlife and inevitably leads to death. The disease mutation consists of an unstable expanded CAG trinucleotide repeat in the 5′ coding region of the gene that encodes a stretch of polyglutamines (1). HD is thus a member of a family of CAG repeat disorders causing progressive neurodegenerative diseases such as spinobulbar muscular atrophy, several of the spinocerebellar degenerations, and dentatorubropallidoluysian atrophy (2). The protein product of the HD gene, huntingtin, is a protein thought to be normally found in the cytoplasm and whose function remains unknown. Its ubiquitous expression throughout the nervous system and peripheral tissues offers no obvious explanation for the preferential neuronal degeneration in striatum and certain layers of cerebral cortex that occurs in HD (3–5). Huntingtin appears to be associated with cytoskeletal elements and the endosomal system (6, 7). The expanded polyglutamine stretch has been proposed to confer toxic effects via several different mechanisms (8–10), but the critical deleterious effects of expanded huntingtin have yet to be identified.
Transgenic mice expressing exon 1 of the human HD gene with an expanded CAG repeat develop a progressive neurological phenotype (11). Under the control of the human HD promoter, transgenic mice (line R6/2) express part of the human HD gene with CAG repeat lengths of 141 to 157 (normal < 35). In humans, repeat lengths of >70 invariably produce the juvenile onset HD phenotype characterized by early onset, rigidity, dystonia, tremor, and myoclonus. R6/2 mice develop normally, but around 6 weeks of age show loss of brain and body weight, and, around 9–11 weeks, develop many of the features of juvenile HD including irregular gait, abrupt shuddering movements, stereotypic grooming movements, resting tremor, and epileptic seizures (11, 12).
Although R6/2 mice demonstrate an abnormal neurological phenotype, in most respects the brains of these mice appear normal. The striata of symptomatic 12-week-old R6/2 mice have normal immunohistochemical staining for GAD65, GAD67, calbindin, neuropeptide Y, somatostatin, nitric oxide synthase, choline acetyltransferase, vasoactive intestinal peptide, calretinin, and parvalbumin. Presynaptic neurite markers that have been found to be normal in R6/2 mouse striata by immunohistochemistry include synaptophysin, GAP-43, neurofilament, α-synuclein, and tyrosine hydroxylase (S. W. Davies, unpublished data).
Some aberrant features have been described in R6/2 mouse brains, however. In addition to a clear reduction in brain weight, neuronal intranuclear inclusions (NII) are seen in striatal neurons of transgenic mice at 4.5 weeks (24). NII are immunopositive for huntingtin and ubiquitin and are never observed in control mice brains. In control mice, huntingtin immunoreactivity is located in the cytoplasm and not the nucleus. NII have also been described in human HD brain biopsy material (13, 14) and in another CAG repeat disease, Machado-Joseph disease (15). Despite the discovery of NII in R6/2 mice, the mechanism of neuropathogenesis by which the mutant human HD gene causes symptoms remains unknown.
Many changes in neurotransmitter receptors have been identified in HD striatum including decreases in glutamate, dopamine (DA), γ-aminobutyric acid (GABA), and muscarinic cholinergic receptors (mAChR) (16–20). Furthermore, glutamate has been postulated to play a role in the pathogenesis of HD because intrastriatal injections of glutamate receptor agonists, particularly those acting at the N-methyl-d-aspartate (NMDA) receptor, reproduce neuropathological features of HD (21–23). HD brains demonstrate reduced glutamate receptors (GluRs) although this loss may represent generalized neuronal loss (19, 20). MRI spectroscopy shows increased levels of striatal glutamate/glutamine and lactate in HD patients suggesting that glutamatergic function and abnormalities in energy metabolism may combine to produce pathology (24, 25).
To explore the role of glutamate in the development of symptoms in transgenic mice, we examined GluRs in the brains of asymptomatic (4 and 8 week old) and symptomatic (12 week old) R6/2 mice and age-matched littermate controls by using receptor binding autoradiography, immunoblotting for receptor proteins, and in situ hybridization. In addition to GluRs, we analyzed other neurotransmitter receptors known to be affected in HD, namely, GABA, mACh, and DA receptors.
MATERIALS AND METHODS
Receptor Binding.
All studies were performed on coded samples by experimenters blinded to genotype. For all studies, transgenic R6/2 mice were compared with age-matched littermate controls. Brains were rapidly frozen in liquid isopentane. Sections (12 μm) containing striatum and cortex were thaw mounted onto polylysine coated glass slides, kept at −70°C, and thawed 1 h prior to use. For glutamate and GABA receptor studies, slides underwent a prewash in assay buffer for 30 min at 4°C and were then dried under a stream of cool air. Slides were then incubated for 45 min in [3H]ligand in the presence or absence of displacers. Conditions were as follows: Assay: concentration of [3H]ligand [specific activity (s.a.)]; assay buffer, displacers present in the incubation assay, nonspecific “blank” condition. α-Amino-3-hydroxy-5-methyl-4-isoxazolepropionic acid (AMPA) receptors: 20 nM [3H]AMPA (s.a. 52.3 Ci/mmol; 1 Ci = 37 GBq); 50 mM Tris⋅HCl + 2.5 mM CaCl2 + 30 mM potassium thiocyanate, pH 7.2 (Tris⋅HCl/CaCl2/KSCN); displacers, none; blank, 1 mM glutamate (26). Kainate receptors: 80 nM [3H]kainate (s.a. 58 Ci/mmol); 50 mM Tris acetate, pH 7.2; displacers, none; blank, 1 mM kainate (27). NMDA receptors: 100 nM [3H]glutamate (s.a. 49 Ci/mmol); 50 mM Tris-acetate, pH 7.4; displacers, none; blank, 1 mM NMDA (27). Group I metabotropic GluRs: 100 nM [3H]glutamate (s.a. 49 Ci/mmol); Tris⋅HCl/CaCl2/KSCN; displacers, 100 μM NMDA and 10 μM AMPA; blank, 2.5 μM quisqualate (28). Group II metabotropic GluRs (mGluRs): 100 nM [3H]glutamate (s.a. 49 Ci/mmol); Tris⋅HCl/CaCl2/KSCN; displacers, 100 μM NMDA, 10 μM AMPA, and 2.5 μM quisqualate; blank, 1 mM glutamate (29). GABAA receptors: 40 nM [3H]GABA (s.a. 29.05 Ci/mmol); Tris⋅HCl + 2.5 mM CaCl2, pH 7.4; displacers, 100 μM baclofen; blank, 100 μM isoguvacine (30). GABAB receptors: 40 nM [3H]GABA (s.a. 29.05 Ci/mmol); Tris⋅HCl + 2.5 mM CaCl2 pH 7.4; displacers, 100 μM isoguvacine; blank, 100 μM baclofen (30).
All [3H]ligands were obtained from New England Nuclear. After incubation in [3H]ligand, slides were subjected to three rapid washes in cold buffer, one rapid wash in glutaraldehyde/acetone (2.5% vol/vol), and quickly dried under a stream of warm air. Slides were apposed to tritium-sensitive film (Hyperfilm 3H, Amersham) with calibrated radioactive standards and allowed to expose for 2–3 weeks. Films were developed and analyzed using a computer-based image analysis system (M1, Imaging Research, St. Catharine’s, ON, Canada). Image density corresponding to binding of [3H]ligand was converted to pmol/mg protein by using calibrated radioactive standards, and nonspecific binding was subtracted.
Assays for D1-like and D2-like DA receptors used a buffer containing 25 mM Tris⋅HCl (pH 7.5), 100 mM NaCl, 1 mM MgCl2, 1 μM pargyline, and 0.001% ascorbate. For D1-like receptors, slides were incubated with 1.65 nM [3H]SCH-23390 (s.a. 70.3 Ci/mmol) for 2.5 h. Nonspecific binding was defined in the presence 1 μM cis-flupentixol (31). The predominant D1-like DA receptor (DAR) in the striatum is the D1 receptor, as opposed to the D5 receptor. For D2-like receptors, slides were incubated with 180 pM [3H]YM-09151–2 (s.a. 85.5 Ci/mmol) for 3 h. Nonspecific binding was defined in the presence 50 μM DA (32). The predominant D2-like receptor is the D2 receptor, with lower levels of D3 and D4 receptors present. For [3H]mazindol binding, slides were prewashed for 5 min in cold buffer: 50 mM Tris⋅HCl, 5 mM KCl, 300 mM NaCl, pH 7.9. Slides were then incubated in 6 nM [3H]mazindol (s.a. 24 Ci/mmol) in the presence of 300 nM desipramine for 2.5 h. Nonspecific binding was defined in the presence of 10 μM nomifensine (33). After incubation in [3H]ligand, slides were rinsed in cold buffer for 10 min, rinsed quickly in distilled water, dried under a stream of cool air, and analyzed as described above.
For mACh receptors, slides were prewashed twice for 5 min in cold buffer: 7.75 mM Na2PO4, 137 mM NaCl, and 2.6 mM KCl. Slides were incubated in 1 nM [3H]QNB (s.a. 49 Ci/mmol) for 3 h (16). After incubation slides were rinsed twice for 5 min in cold buffer, rinsed quickly in distilled water, dried under a stream of cool air, and analyzed as described above.
Immunoblotting.
Frozen mouse brain hemispheres were sonicated in 10 vol of buffer: 50 mM Tris⋅HCl, 10% glycerol, 5 mM magnesium acetate, and 0.2 mM EDTA, with protease inhibitors (phenylmethylsulfonyl fluoride, leupeptin, and aprotinin). Protein concentrations were determined by Bio-Rad protein assay. Using a 96-well manifold, 2.5 μg of protein was loaded into each well and transferred onto nitrocellulose membrane (0.45 μm pore size, Bio-Rad). Membranes were washed in Tris-buffered saline with 0.1% Tween-20 (TTBS), 3 × 10 min, and then incubated for 1 h with 1:2,500 dilution of primary antibody: mGluR1a (rabbit polyclonal, Chemicon), mGluR2/3 (rabbit polyclonal, Chemicon), mGluR5 (rabbit polyclonal, Upstate Biotechnology, Lake Placid, NY), NMDA-R1 (mouse monoclonal, Chemicon), and ubiquitin (rabbit polyclonal, Dako). Membranes were washed 3 × 10 min in TTBS, and then incubated for 1 h in horseradish peroxidase-conjugated secondary antibody (either goat anti-rabbit or goat anti-mouse) at a dilution of 1:1,000 (for mGluR1a and mGluR2/3) or 1:5,000 (ubiquitin, mGluR5, and NMDA-R1). After 3 × 10 min washes in TTBS, immunoreactivity was visualized by using chemiluminescence (SuperSignal, Pierce). Resultant film images were analyzed by using the M1 image analysis system. OD values were measured from four dots from each sample, film background was subtracted, and values were normalized to values from control mouse brain homogenates. Western blots confirmed that the GluR antibodies employed recognized primarily single bands under the immunoblot conditions employed.
Immunohistochemistry.
Immunohistochemistry was performed in parallel on 4% paraformaldehyde fixed brain tissue from four transgenic and four control 12-week-old mice as described by Kosinski et al. (5). Tissue sections were sequentially incubated with primary polyclonal rabbit mGluR2/3 antiserum (1:200), with a Cy3 fluorescent goat anti-rabbit secondary antibody (1:400, The Jackson Laboratory), and visualized with a Bio-Rad Laser Confocal microscope, using Kalman filtering. A blinded observer quantitated fluorescence by measuring mean optical density in 10 nonoverlapping 100× fields (50 × 50 pixels each) of each brain by using Adobe (Mountain View, CA) photoshop software. For each region fluorescence levels were compared by using a repeated measures analysis of variance with a significance level of 1% (SuperANOVA, Abacus Concepts, Berkeley, CA).
In Situ Hybridization.
Radioactive in situ hybridization using RNA probes for mGluR1, mGluR2, mGluR3, mGluR5, and NMDA-NR1 was performed as described (34). Oligodeoxynucleotides specific for human β-actin (35), D1 DAR (36), or D2 DAR (37) were labeled with 35S-dATP (35). Prehybridization was the same as for RNA probes with the exception that chloroform was omitted (34). In situ hybridization signal was analyzed by measuring film density.
RESULTS
We studied GluR binding in symptomatic 12-week-old transgenic mice and age-matched littermate controls (Table 1, Fig. 1). Ionotropic GluRs [NMDA, AMPA, and kainate receptors] showed varying alterations. While NMDA receptor binding was not statistically different in the brains of transgenic mice compared with controls, AMPA receptors were decreased to 85% of normal, and kainate receptor binding was decreased to 63.5% (striatum) and 72.8% (cortex) of control. GluRs are classified into ion channel-linked (ionotropic) and G protein-linked (metabotropic) receptors. The mGluRs are members of the receptor superfamily characterized by seven membrane-spanning domains and are further subdivided into three groups. While group I mGluRs (mGluR1, mGluR5) are positively coupled to phosphoinositide metabolism, group II mGluRs (mGluR2, mGluR3) are negatively coupled to adenylate cyclase (for review, see ref. 38). Of the mGluRs, group I mGluR binding was not significantly different between transgenic and normal mice. Group II mGluR binding was clearly affected, however, decreased to 72.5% (striatum) and 58.7% (cortex) of control values.
Table 1.
Receptor binding assays in control and transgenic R6/2 mouse brain
| Receptor assays | Striatum
|
Cortex
|
||
|---|---|---|---|---|
| Control | Transgenic | Control | Transgenic | |
| Glutamate receptors | ||||
| NMDA | 0.89 ± 0.10 | 0.80 ± 0.07* | 1.40 ± 0.06 | 1.126 ± 0.09 |
| AMPA | 2.79 ± 0.05 | 2.38 ± 0.08* | 2.79 ± 0.08 | 2.37 ± 0.08* |
| kainate | 1.15 ± 0.04 | 0.73 ± 0.06‡ | 1.03 ± 0.05 | 0.75 ± 0.06* |
| group I metabotropic | 0.596 ± 0.083 | 0.364 ± 0.06 | 0.256 ± 0.062 | 0.363 ± 0.053 |
| group II metabotropic | 1.86 ± 0.08 | 1.35 ± 0.06‡ | 2.35 ± 0.08 | 1.38 ± 0.04‡ |
| Nonglutamate receptors | ||||
| GABAA | 1.08 ± 0.03 | 0.99 ± 0.05 | 1.71 ± 0.11 | 1.44 ± 0.09 |
| GABAB | 0.44 ± 0.05 | 0.35 ± 0.06 | 0.94 ± 0.16 | 0.66 ± 0.11 |
| muscarinic ACh (QNB) | 4.30 ± 0.17 | 2.78 ± 0.09‡ | 2.60 ± 0.09 | 1.90 ± 0.07‡ |
| dopamine uptake (mazindol) | 0.92 ± 0.52 | 0.57 ± 0.23 | — | — |
| D1 Dopamine Receptors | ||||
| 4 weeks | 2.96 ± 0.02 | 2.79 ± 0.07 | — | — |
| 8 weeks | 2.73 ± 0.04 | 0.91 ± 0.07‡ | — | — |
| 12 weeks | 2.52 ± 0.13 | 0.81 ± 0.06‡ | — | — |
| D2 Dopamine Receptors | ||||
| 4 weeks | 0.88 ± 0.03 | 0.78 ± 0.05 | — | — |
| 8 weeks | 0.98 ± 0.03 | 0.36 ± 0.05‡ | — | — |
| 12 weeks | 0.97 ± 0.03 | 0.49 ± 0.02‡ | — | — |
Numbers represent pmol [3H]ligand bound per mg protein (mean ± SEM, n = 6–12 mice per group).
*P < 0.01;
P < 0.001;
P < 0.0001.
Figure 1.
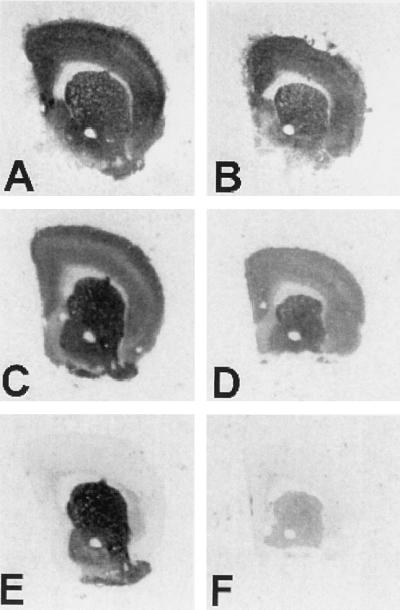
Receptor binding autoradiography of normal and R6/2 mice brains. Representative coronal sections of control (A, C, and E) and transgenic R6/2 mouse brain hemispheres (B, D, and F) subjected to [3H]AMPA binding (A and B), [3H]QNB binding for muscarinic acetylcholine receptors (C and D), or [3H]SCH-23390 binding for D1-like receptors (E and F). With all ligands, the R6/2 mice have lower levels of binding, but the extent of receptor binding decrease varies greatly, with D1 DARs most affected, mAChRs somewhat less affected, and AMPA subtype of ionotropic GluR only slightly decreased.
Because huntingtin has been postulated to play a role in protein trafficking (14, 16, 26), one possibility is that the decreases in group II mGluR binding was due to abnormal trafficking of receptors, in which case the overall protein levels may not be decreased. To investigate this possibility, we performed immunoblots to determine if overall protein levels were decreased. Immunoblot data indicated that not only was group II mGluR binding decreased, but so were the amounts of mGluR2/3 protein immunoreactivity (Table 2). There was no decrease in the immunoreactivity for the mGluR5 subtype of group I mGluR, or for the NMDA-NR1 subunit of NMDA receptor. Therefore, decrease in receptor protein expression was selective. Immunoblots for ubiquitin, in contrast, revealed increased immunoreactivity in R6/2 mice (1,250% of normal, P < 0.0001). Increased ubiquitin immunoreactivity may correspond to the development of NII in transgenic mice, as NII are immunopositive for both huntingtin and ubiquitin (12). Immunofluorescence using an antibody that recognizes both mGluR2 and mGluR3 demonstrated decreased cortical neuropil staining in R6/2 mice (Fig. 2). Quantitation of confocal laser images of mGluR2/3 immunostaining revealed statistically significant decreases in R6/2 cortex (76.2% of control, P < 0.0001) and in striatum (89.3% of control, P < 0.0001).
Table 2.
Protein immunoblots in control and transgenic R6/2 mice brain
| Antibody | Control | Transgenic |
|---|---|---|
| mGluR1a | 100 ± 8.3 | 75.0 ± 8.3 |
| mGluR2/3 | 100 ± 7.7 | 30.8 ± 3.1* |
| mGluR5 | 100 ± 5.3 | 113.2 ± 7.9 |
| NMDA-R1 | 100 ± 24.5 | 87.8 ± 22.4 |
| Ubiquitin | 100 ± 15.0 | 1250 ± 50* |
Numbers represent film optical density (OD) measurements as a percentage of the mean OD readings of the control group (mean ± SEM, n = 6 mice per group).
*P < 0.0001.
Figure 2.

In situ hybridization and immunofluorescence for mGluRs in control (A–D) and transgenic R6/2 (E–H) mice. In situ hybridization for mGluR2 mRNA in 4-week-old (A and E) and 12-week-old mice (B and F). mGluR2 mRNA hybridization signal appears dark on this film image. Note decreased labeling of cortical neurons in 12-week-old R6/2 mice; some decrease in cortical signal can be noticed in 4-week-old animals. (C and G): Fluorescent immunohistochemistry using an antibody that recognizes mGluR2 and mGluR3; signal appears bright in this image. Bar = 20 μm. Decreased mGluR2/3 immunoreactivity is apparent in the cortex of R6/2 mice. (D and H): In situ hybridization for mGluR5 mRNA.
Decreases in receptor protein could result from decreased translation of mRNA into protein or from decreased mRNA levels. To differentiate these possibilities, we performed in situ hybridization for GluR mRNA. In the brains of symptomatic 12-week-old R6/2 mice, there were marked decreases in the expression of mRNA for mGluR1, mGluR2 and mGluR3 (Table 3). Decreased mRNA expression for these receptors was unlikely to simply represent cell loss, as there was no difference in mRNA levels measured for mGluR5, NMDA-R1, or β-actin. Therefore the selectivity of alteration of receptor protein expression was also found at the mRNA level. Decreased mRNA levels could result either from decreased transcription or increased mRNA turnover.
Table 3.
In situ hybridization showing mRNA levels in control and transgenic R6/2 mice
| ISH probe | Striatum
|
Cortex
|
||
|---|---|---|---|---|
| Control | Transgenic | Control | Transgenic | |
| mGluR1 | ||||
| 4 weeks | 245.5 ± 12.1 | 187.9 ± 9.1* | 100 ± 6.1 | 90.9 ± 6.1 |
| 8 weeks | 261.5 ± 30.7 | 126.9 ± 7.7* | 100 ± 11.5 | 80.8 ± 3.8 |
| 12 weeks | 278.4 ± 35.3 | 143.1 ± 9.8* | 100 ± 5.9 | 72.5 ± 5.8* |
| mGluR2 | ||||
| 4 weeks | 28.8 ± 1.5 | 27.2 ± 1.5 | 100 ± 3.0 | 81.8 ± 7.6 |
| 8 weeks | 15.2 ± 1.5 | 6.6 ± 1.5 | 100 ± 7.7 | 56.4 ± 5.1† |
| 12 weeks | 28.8 ± 1.5 | 36.4 ± 1.5 | 100 ± 5.3 | 54.9 ± 3.5‡ |
| mGluR3 | ||||
| 4 weeks | 77.2 ± 4.7 | 77.6 ± 5.6 | 100 ± 6.3 | 84.3 ± 5.5 |
| 8 weeks | 86.2 ± 6.2 | 66.7 ± 4.6 | 100 ± 7.7 | 76.9 ± 7.7 |
| 12 weeks | 59.6 ± 5.6 | 41.4 ± 2.5 | 100 ± 5.6 | 58.6 ± 2.5‡ |
| mGluR5 | ||||
| 4 weeks | 211.3 ± 11.3 | 196.9 ± 6.2 | 100 ± 5.1 | 113.4 ± 3.1 |
| 12 weeks | 236.5 ± 22.4 | 197.9 ± 14.6 | 100 ± 8.3 | 114.6 ± 10.3 |
| NMDA-R1 | ||||
| 4 weeks | 77.7 ± 3.6 | 67.4 ± 3.6 | 100 ± 5.2 | 93.4 ± 5.7 |
| 8 weeks | 76.6 ± 5.7 | 55.3 ± 4.5 | 100 ± 6.1 | 90.2 ± 8.6 |
| 12 weeks | 77.1 ± 8.7 | 80.8 ± 6.6 | 100 ± 8.9 | 96.9 ± 6.8 |
| D1 dopamine | ||||
| 4 weeks | 100 ± 7.7 | 53.8 ± 2.8† | – | – |
| 8 weeks | 100 ± 8.7 | 60.5 ± 6.3* | – | – |
| 12 weeks | 100 ± 4.3 | 37.7 ± 1.7‡ | – | – |
| D2 dopamine | ||||
| 4 weeks | 100 ± 3.1 | 82.3 ± 5.1 | – | – |
| 8 weeks | 100 ± 8.1 | 39.0 ± 4.2‡ | – | – |
| β-actin | ||||
| 4 weeks | 94.2 ± 1.9 | 89.6 ± 1.9 | 100 ± 1.9 | 96.1 ± 1.9 |
| 12 weeks | 94.5 ± 7.4 | 86.8 ± 6.1 | 100 ± 4.3 | 101.5 ± 5.2 |
Numbers represent film optical density (OD) expressed as a percentage of signal in the cortex of control mice (mean ± SEM, n = 6–8 mice per group). For D1 and D2 dopamine receptor mRNA, numbers represent film OD expressed as a percentage of signal in striatum of control mice.
P < 0.01;
P < 0.001;
P < 0.0001.
Given the selective alterations in GluRs, we investigated other neurotransmitter receptors known to be affected in human HD brain. At 12 weeks, when the animals were clearly symptomatic, quantitative receptor autoradiography revealed statistically significant decreases in striatal receptor binding for [3H]QNB, a ligand for mAChRs (35% decrease), [3H]SCH-23390, a ligand for the D1 family of DARs (67% decrease), and [3H]YM-09151–2, a ligand for D2 family of DARs (59% decrease) (Table 1, Fig. 1). A decrease in [3H]QNB binding was also observed in the cortex of transgenic animals, indicating that receptor alterations were not limited to the striatum. There were no significant changes in GABAA or GABAB receptors, or in [3H]mazindol binding, a measure of DA uptake sites.
R6/2 mice develop neurologic symptoms by 9–11 weeks. The observed changes in neurotransmitter receptors in the brains of 12-week-old R6/2 mice, then, could be secondary to a generalized pathologic process. To delineate the temporal relationship of neurotransmitter receptor alteration to the development of symptoms, we analyzed brains of asymptomatic 4- and 8-week-old mice. In situ hybridization revealed that the decreases in mGluR1, D1 DAR, and D2 DAR mRNA signals in the striatum were statistically significant by 4 weeks of age, and the decrease in mGluR2 mRNA expression in the cortex was significant by 8 weeks of age with a trend toward a decrease at 4 weeks (Table 3, Fig. 2). Decreases in D1 and D2 DAR binding were observed in the brains of 8-week-old mice, and there was also a trend toward a decrease in the brains of 4- week-old mice. Thus, in 8-week-old animals, there are already major alterations in the glutamate and DA neurotransmitter systems, both of which have major importance in striatal function. There is also evidence of receptor mRNA expression changes beginning as early as 4 weeks.
DISCUSSION
While the gene for HD has been identified, the mechanism by which neuropathological damage occurs remains unknown. Changes in GluRs, DARs, and mAChRs have also been observed in human HD brains (16–20). We have found alteration of many of these receptors in the brains of R6/2 mice, suggesting that these mice reproduce some of the neuropathological changes described in HD (16–20).
GluRs have been postulated to play a role in the pathogenesis of HD. The loss of striatal mGluR2 receptors in R6/2 mice is of particular interest because these receptors are normally responsible for regulating the release of glutamate from presynaptic corticostriatal terminals (39, 40). Loss of presynaptic mGluR2 receptors might then result in unregulated release of synaptic glutamate. Increased glutamate release has been postulated to play a role in the pathogenesis of HD (21–23).
DARs were profoundly altered, with mRNA and protein alterations occurring prior the development of symptoms. The finding that DARs were affected prior to the onset of symptoms is consistent with studies in human HD, as decreases in DARs have been found in presymptomatic patients with HD, and D1 and D2 receptor mRNA have been found to be decreased in a grade 0 postmortem HD brain sample (41, 42).
Whereas certain neurotransmitter receptors were profoundly affected, others were not. There was no simple predictor of which receptors were likely to be affected. While many G protein-linked receptors (mGluR1, mGluR2, mGluR3, D1, D2, and mACh) were decreased, other G protein-linked receptors (mGluR5 and GABAB) were unaffected. Of the ion channel-linked receptors, AMPA and kainate receptors were decreased, but NMDA receptors were not significantly altered.
It is extremely unlikely that these changes are due to nonspecific dysfunction of a specific striatal cell type. The predominant neuron in the striatum (>90%) are the GABA-containing medium spiny neurons, all of which contain high levels of NMDA-R1, mGluR5, AMPA, GABAA, DAR (D1 and/or D2), and mAChRs and intermediate levels of mGluR1 and mGluR3 receptors. Our current findings indicate a decrease in the mGluR1, mGluR3, DARs, and mAChRs, without a concomitant decrease in the AMPA, NMDA-NR1, mGluR5, or GABAA receptors that are contained within the same medium spiny striatal neurons. Furthermore, mGluR2 mRNA is expressed in cortical neurons projecting to striatum and in the striatal cholinergic interneurons, but not in striatal projection neurons. Cortical mGluR2 mRNA expression was decreased, consistent with a loss of mGluR2 in corticocortical and corticostriatal terminals. The pattern of receptor decreases cannot be explained solely by damage to a particular subset of striatal neurons. The present data argue that the observed alterations occur at the level of specific receptors within a given cell type, rather than in all genes of a subpopulation of neurons.
In short, R6/2 mice demonstrate altered expression of multiple neurotransmitter receptors. These alterations are selective for certain receptors, and this loss cannot be explained by generalized dysfunction of a particular cell type. A recent study has found accumulation of huntingtin in dystrophic neurites, suggesting that there may be altered trafficking in HD (14). Our immunoblot studies indicate that total amounts of mGluR proteins are decreased, indicating that the observed changes are not simply due to improper protein trafficking and are more likely to represent dysregulation either of transcription, mRNA turnover, or translation.
It is consistent that the defect occurs at the level of transcription. We cannot exclude accelerated degradation of mRNA, but certain mRNA levels were unaffected. The recent observation that NII accumulate in the nuclei of R6/2 neurons confirms that the mutant protein can enter the nucleus. Many transcription factors contain glutamine-rich regions that participate in the formation of polar zipper complexes with other factors (43). Of interest, an antibody that can discriminate between normal and disease HD alleles was raised not against the protein huntingtin, but against the TATA binding protein, a protein that can bind DNA (44).
We found mRNA alterations in 4-week-old animals, around the time that NII become detectable in certain brain regions (12). One scenario is that the abnormal HD transgene product enters the nucleus and alters the transcription of multiple types of neurotransmitter receptors. NII are never seen in glial cells, and neurons may be specifically susceptible to their formation. Neurons may have a particular set of transcription factors that can interact with abnormally long polyglutamine tracts, bonding, for example, through the formation of polar zippers (43). Huntingtin immunoreactivity is normally cytoplasmic, but aggregation with a transcription factor could provide a means by which abnormal huntingtin could enter the nucleus. The protein product of the HD transgene has recently been shown to form insoluble aggregates in vitro in a manner dependent on polyglutamine repeat length, suggesting that abnormally expanded polyglutamine stretches can promote anomalous protein binding interactions (45). Perhaps those genes whose expression is altered share recognition sites for a common transcription factor. An altered complement of receptors, especially mGluRs, DARs, and mAChRs, all of which are heavily expressed in the striatum, may lead to further pathology and symptomatology characteristic of HD.
As R6/2 mice do not contain the full-length abnormal human huntingtin gene, but only exon 1 that contains the CAG repeat region, the current findings may have relevance for other CAG repeat disorders. Altered expression of neurotransmitter receptors may prove to be a common pathologic mechanism of polyglutamine diseases. Paulson et al. (15) have recently observed NII in Machado-Joseph disease, lending credence to the idea that the CAG repeat disorders may share a common cellular defect.
Acknowledgments
We thank Woosik Chung, Zane Hollingsworth, Ben Huffard, and Anil Menon for expert technical assistance and Anj Mahal for genotyping the mice. This study was supported by U.S. Public Health Service Grants NS01916, AG 11337, NS31579, and AG13617; the Hereditary Disease Foundation, the Glendorn Foundation; the Foundation for the Care and Cure of Huntington’s Disease; Deutsche Forschungsgemeinschaft Grant 1696/1–2; the Medical Research Council; and the Special Trustees of Guy’s Hospital.
ABBREVIATIONS
- DA
dopamine
- DAR
DA receptor
- GluR
glutamate receptor
- HD
Huntington disease
- mAChR
muscarinic cholinergic receptor
- mGluR
metabotropic GluR
- NII
neuronal intranuclear inclusions
- NMDA
N-methyl-d-aspartic acid
- AMPA
α-amino-3-hydroxy-5-methyl-4-isoxazolepropionic acid
- GABA
γ-aminobutyric acid
- s.a.
specific activity
References
- 1.Huntington’s Disease Collaborative Research Group. Cell. 1993;72:971–983. doi: 10.1016/0092-8674(93)90585-e. [DOI] [PubMed] [Google Scholar]
- 2.Paulson H L, Fischbeck K H. Annu Rev Neurosci. 1996;19:79–107. doi: 10.1146/annurev.ne.19.030196.000455. [DOI] [PubMed] [Google Scholar]
- 3.Sharp A H, Loev S J, Schilling G, Li S H, Li X J, Bao J, Wagster M V, Kotzuk J A, Steiner J P, Lo A, et al. Neuron. 1995;14:1065–1074. doi: 10.1016/0896-6273(95)90345-3. [DOI] [PubMed] [Google Scholar]
- 4.Bhide P G, Day M, Sapp E, Schwarz C, Sheth A, Kim J, Young A B, Penney J, Golden J, Aronin N, et al. J Neurosci. 1996;16:5523–5535. doi: 10.1523/JNEUROSCI.16-17-05523.1996. [DOI] [PMC free article] [PubMed] [Google Scholar]
- 5.Kosinski C M, Cha J H, Young A B, Persichetti F, MacDonald M, Gusella J F, Penney J B, Standaert D G. Exp Neurol. 1997;144:239–247. doi: 10.1006/exnr.1997.6441. [DOI] [PubMed] [Google Scholar]
- 6.DiFiglia M, Sapp E, Chase K, Schwarz C, Meloni A, Young C, Martin E, Vonsattel J-P, Carraway R, Reeves S A, et al. Neuron. 1995;14:1075–1081. doi: 10.1016/0896-6273(95)90346-1. [DOI] [PubMed] [Google Scholar]
- 7.Block-Galarza J, Chase K O, Sapp E, Vaughan K T, Vallee R B, DiFiglia M, Aronin N. NeuroReport. 1997;8:2247–2251. doi: 10.1097/00001756-199707070-00031. [DOI] [PubMed] [Google Scholar]
- 8.Li X-J, Sharp A H, Li S-H, Dawson T M, Snyder S H, Ross C A. Proc Natl Acad Sci USA. 1996;93:4839–4844. doi: 10.1073/pnas.93.10.4839. [DOI] [PMC free article] [PubMed] [Google Scholar]
- 9.Goldberg Y P, Nicholson D W, Rasper D M, Kalchman M A, Koide H B, Graham R K, Bromm M, Kazemi-Esfarjani P, Thornberry N A, Vaillancourt J P, et al. Nat Genet. 1996;13:442–449. doi: 10.1038/ng0896-442. [DOI] [PubMed] [Google Scholar]
- 10.Kahlem P, Terré C, Green H, Djian P. Proc Natl Acad Sci USA. 1996;93:14580–14585. doi: 10.1073/pnas.93.25.14580. [DOI] [PMC free article] [PubMed] [Google Scholar]
- 11.Mangiarini L, Sathasivam K, Seller M, Cozens B, Harper A, Hetherington C, Lawton M, Trottier Y, Lehrach H, Davies S W, et al. Cell. 1996;87:493–506. doi: 10.1016/s0092-8674(00)81369-0. [DOI] [PubMed] [Google Scholar]
- 12.Davies S W, Turmaine M, Cozens B A, DiFiglia M, Sharp A H, Ross C A, Scherzinger E, Wanker E E, Mangiarini L, Bates G P. Cell. 1997;90:537–548. doi: 10.1016/s0092-8674(00)80513-9. [DOI] [PubMed] [Google Scholar]
- 13.Roizin L, Stellar S, Liu J C. In: Advances in Neurology. Chase T N, Wexler N S, Barbeau A, editors. Vol. 23. New York: Raven; 1979. pp. 95–122. [Google Scholar]
- 14.DiFiglia M, Sapp E, Chase K O, Davies S W, Bates G P, Vonsattel J P, Aronin N. Science. 1997;277:1990–1993. doi: 10.1126/science.277.5334.1990. [DOI] [PubMed] [Google Scholar]
- 15.Paulson H L, Perez M K, Trottier Y, Trojanowski J Q, Subramony S H, Das S S, Vig P, Mandel J L, Fischbeck K H, Pittman R N. Neuron. 1997;19:333–44. doi: 10.1016/s0896-6273(00)80943-5. [DOI] [PubMed] [Google Scholar]
- 16.Penney J B, Young A B. Neurology. 1982;32:1391–1395. doi: 10.1212/wnl.32.12.1391. [DOI] [PubMed] [Google Scholar]
- 17.Richfield E K, O’Brien C F, Eskin T, Shoulson I. Neurosci Lett. 1991;132:121–126. doi: 10.1016/0304-3940(91)90448-3. [DOI] [PubMed] [Google Scholar]
- 18.Faull R L M, Waldvogel H J, Nicholson L F B, Synek B J L. Prog Brain Res. 1993;99:105–123. doi: 10.1016/s0079-6123(08)61341-2. [DOI] [PubMed] [Google Scholar]
- 19.London E D, Yamamura H I, Bird E D, Coyle J T. Biol Psychiatr. 1981;16:155–162. [PubMed] [Google Scholar]
- 20.Dure L S, Young A B, Penney J B. Ann Neurol. 1991;30:785–793. doi: 10.1002/ana.410300607. [DOI] [PubMed] [Google Scholar]
- 21.Beal M F, Kowall N W, Ellison D W, Mazurek M F, Swartz K J, Martin J B. Nature (London) 1986;321:168–171. doi: 10.1038/321168a0. [DOI] [PubMed] [Google Scholar]
- 22.DiFiglia M. Trends Neurosci. 1990;13:286–289. doi: 10.1016/0166-2236(90)90111-m. [DOI] [PubMed] [Google Scholar]
- 23.Albin R L, Greenamyre J T. Neurology. 1992;42:733–738. doi: 10.1212/wnl.42.4.733. [DOI] [PubMed] [Google Scholar]
- 24.Taylor-Robinson SD, Weeks R A, Bryant D J, Sargentoni J, Marcus C D, Harding A E, Brooks D J. Movement Disorders. 1996;11:167–173. doi: 10.1002/mds.870110209. [DOI] [PubMed] [Google Scholar]
- 25.Koroshetz W J, Jenkins B G, Rosen B R, Beal M F. Ann Neurol. 1997;41:160–165. doi: 10.1002/ana.410410206. [DOI] [PubMed] [Google Scholar]
- 26.Cha J-H J, Makowiec R L, Penney J B, Young A B. Mol Pharmacol. 1992;41:832–838. [PubMed] [Google Scholar]
- 27.Greenamyre J T, Olson J M M, Penney J B, Young A B. J Pharmacol Exp Ther. 1985;233:254–263. [PubMed] [Google Scholar]
- 28.Cha J J, Makowiec R L, Penney J B, Young A B. Neurosci Lett. 1990;113:78–83. doi: 10.1016/0304-3940(90)90498-x. [DOI] [PubMed] [Google Scholar]
- 29.Catania M V, Hollingsworth Z, Penney J B, Young A B. NeuroReport. 1993;4:311–313. doi: 10.1097/00001756-199303000-00021. [DOI] [PubMed] [Google Scholar]
- 30.Chu D C, Albin R L, Young A B, Penney J B. Neuroscience. 1990;34:341–357. doi: 10.1016/0306-4522(90)90144-s. [DOI] [PubMed] [Google Scholar]
- 31.Richfield E K, Young A B, Penney J B. Brain Res. 1986;383:121–128. doi: 10.1016/0006-8993(86)90013-2. [DOI] [PubMed] [Google Scholar]
- 32.Cox R F, Waszczak B L. Eur J Pharmacol. 1991;199:103–106. doi: 10.1016/0014-2999(91)90642-4. [DOI] [PubMed] [Google Scholar]
- 33.Javitch J A, Blaustein R D, Snyder S H. Eur J Pharmacol. 1983;90:461–462. doi: 10.1016/0014-2999(83)90574-5. [DOI] [PubMed] [Google Scholar]
- 34.Standaert D G, Landwehrmeyer G B, Kerner J A, Penney Jr J B, Young A B. Mol Brain Res. 1996;42:89–102. doi: 10.1016/s0169-328x(96)00117-9. [DOI] [PubMed] [Google Scholar]
- 35.Wüllner U, Standaert D G, Testa C M, Landwehrmeyer G B, Catania M V, Penney J B, Jr, Young A B. Brain Res. 1994;647:209–219. doi: 10.1016/0006-8993(94)91320-x. [DOI] [PubMed] [Google Scholar]
- 36.Qin Z-H, Chen J F, Weiss B. J Neurochem. 1994;62:411–420. doi: 10.1046/j.1471-4159.1994.62020411.x. [DOI] [PubMed] [Google Scholar]
- 37.Chen J F, Qin Z H, Szele G, Bai G, Weiss B. Neuropharmacology. 1991;30:927–941. doi: 10.1016/0028-3908(91)90106-l. [DOI] [PubMed] [Google Scholar]
- 38.Pin J-P, Duvoisin R. Neuropharmacology. 1995;34:1–26. doi: 10.1016/0028-3908(94)00129-g. [DOI] [PubMed] [Google Scholar]
- 39.Calabresi P, Pisani A, Mercuri N B, Bernardi G. Trends Neurosci. 1996;19:19–24. doi: 10.1016/0166-2236(96)81862-5. [DOI] [PubMed] [Google Scholar]
- 40.Petralia R S, Wang Y X, Niedzielski A S, Wenthold R J. Neuroscience. 1996;71:949–976. doi: 10.1016/0306-4522(95)00533-1. [DOI] [PubMed] [Google Scholar]
- 41.Weeks R A, Piccini P, Harding A E, Brooks D J. Ann Neurol. 1996;40:49–54. doi: 10.1002/ana.410400110. [DOI] [PubMed] [Google Scholar]
- 42.Augood S J, Faull R L, Emson P C. Ann Neurol. 1997;42:215–221. doi: 10.1002/ana.410420213. [DOI] [PubMed] [Google Scholar]
- 43.Perutz M F. Curr Opin Struct Biol. 1996;6:848–858. doi: 10.1016/s0959-440x(96)80016-9. [DOI] [PubMed] [Google Scholar]
- 44.Trottier Y, Lutz Y, Stevanin G, Imbert G, Devys D, Cancel G, Saudou F, Weber C, David G, Tora L, et al. Nature (London) 1995;378:403–406. doi: 10.1038/378403a0. [DOI] [PubMed] [Google Scholar]
- 45.Scherzinger E, Lurz R, Turmaine M, Mangiarini L, Hollenbach B, Hasenbank R, Bates G P, Davies S W, Lehrach H, Wanker E E. Cell. 1997;90:549–558. doi: 10.1016/s0092-8674(00)80514-0. [DOI] [PubMed] [Google Scholar]