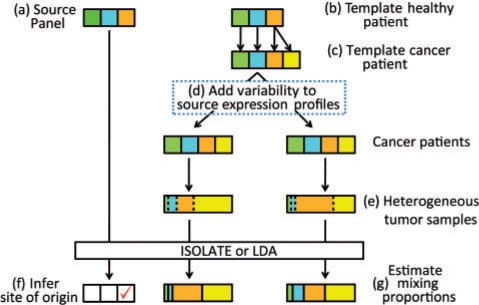
Fig. 3.
Overall experimental strategy for generating the heterogeneous tumor samples from three sources (i.e. candidate sites of origin) to input into the LDA and ISOLATE models. The sources color-matched between the Source Panel and the template healthy patient differ only by technical variability in their expression profiles. Yellow represents cancer cells, while orange represents the site of origin.

