

Abstract
Motivation: Deregulated signaling cascades are known to play a crucial role in many pathogenic processes, among them are tumor initiation and progression. In the recent past, modern experimental techniques that allow for measuring the amount of mRNA transcripts of almost all known human genes in a tissue or even in a single cell have opened new avenues for studying the activity of the signaling cascades and for understanding the information flow in the networks.
Results: We present a novel dynamic programming algorithm for detecting deregulated signaling cascades. The so-called FiDePa (Finding Deregulated Paths) algorithm interprets differences in the expression profiles of tumor and normal tissues. It relies on the well-known gene set enrichment analysis (GSEA) and efficiently detects all paths in a given regulatory or signaling network that are significantly enriched with differentially expressed genes or proteins. Since our algorithm allows for comparing a single tumor expression profile with the control group, it facilitates the detection of specific regulatory features of a tumor that may help to optimize tumor therapy. To demonstrate the capabilities of our algorithm, we analyzed a glioma expression dataset with respect to a directed graph that combined the regulatory networks of the KEGG and TRANSPATH database. The resulting glioma consensus network that encompasses all detected deregulated paths contained many genes and pathways that are known to be key players in glioma or cancer-related pathogenic processes. Moreover, we were able to correlate clinically relevant features like necrosis or metastasis with the detected paths.
Availability: C++ source code is freely available, BiNA can be downloaded from http://www.bnplusplus.org/.
Contact: ack@bioinf.uni-sb.de
Supplementary information: Supplementary data are available at Bioinformatics online.
1 INTRODUCTION
Modern high-throughput techniques for quantifying gene and protein expression combined with state-of-the-art bioinformatics approaches have opened new avenues for studying physiological and pathological processes on the molecular level. Pathway analysis has been broadly applied within biomedical sciences, especially in cancer research, where it is mainly used to elucidate the mechanisms of tumor progression (Ganter and Giroux, 2008). Differential network analysis has emerged as a research area that aims at developing novel approaches for detecting and quantifying differences in the activities of signaling cascades and metabolic and regulatory networks between cancer and normal cells.
In the early stages of differential expression analysis, techniques for identifying genes with varying expression patterns in cancer and normal cells have been developed. More recently, the focus has shifted toward gene set analysis approaches that aim at revealing the enrichment of genes or proteins in biological categories and networks. Gene set analysis tools such as FatiGO (Al-Shahrour et al., 2004), ErmineJ (Lee et al., 2005), WebGestalt (Zhang et al., 2005), Babelomics (Al-Shahrour et al., 2005) or GeneTrail (Backes et al., 2007) enable the user to detect biochemical pathways [as KEGG (Kanehisa, 2002; Kanehisa et al., 2006) or TRANSPATH (Krull et al., 2006)], Gene Ontology categories (Ashburner et al., 2000) or other functional biological groups that are significantly enriched or depleted for deregulated genes. Here, one of the most commonly applied approaches is the so-called gene set enrichment analysis (GSEA; Mootha et al., 2003; Subramanian et al., 2005). An overview of different approaches and methods can be found in Nam and Kim (2008).
Since most gene set analyses methods are designed to examine arbitrary biological categories, the topology of biological networks, if available, is usually not taken into consideration by these tools. In recent years, however, several approaches have been suggested that exploit the network topology. One of the first methods tailored for the interpretation of gene expression data in the light of the network topology applies clustering techniques to detect pathways with co-expressed genes (Fellenberg and Mewes, 1999). More recent algorithms score given network topologies based on experimental data of the network's participants (Ideker et al., 2002; Kurhekar et al., 2002; Rahnenfuehrer et al., 2004). Other promising methods that search for differentially regulated pathways rely on Petri Nets (Cabusora et al., 2005; Kueffner et al., 2000; Zien et al., 2000). Xiong et al. (2004) presented an algorithm for network-based regulatory pathway analysis, which is based on extreme pathway analysis, a method that is mostly used for the evaluation of metabolic networks. Topology-based classification technologies have also been successfully applied to distinguish cancer subclasses (Liu et al., 2006). Likewise, Chuang et al. (2007) presented an network-based approach leading to an improved accuracy in the classification of metastatic versus non-metastatic breast cancers, which relies on the mutual information (Shannon, 1984) as a scoring function. Most recently, Liu et al. (2007) published a sophisticated method, called ‘Gene Network Enrichment Analysis’, which is similar to standard ‘GSEA’ and applies hypothesis testing to evaluate pathways. Given the continuously increasing number of network-based analyses, web-based tools such as GenMAPP (Dahlquist et al., 2002) start to offer corresponding functionality (Salomonis et al., 2007). Besides heuristic approaches, methods that identify optimal sub-structures with respect to a given scoring function are also available. Dittrich et al. (2008) used Integer Linear Programming to detect deregulated modules in protein–protein interaction networks. Ulitsky et al. (2008) presented an algorithm for identifying minimal connected subnetworks in which the number of dysregulated genes in each diseased sample exceeds a given threshold. The aforementioned studies are only a selection from the broad body of approaches that show the extremely fast development of this growing field of research.
In this study, we present a novel algorithm for detecting differentially regulated paths in a given biological network with known topology based on GSEA. Besides the network, its participants and topology, the input of the algorithm consists of a list S of n genes that are sorted with respect to their expression differences between two investigated states, e.g. cancer and normal tissue. The algorithm interprets each path p of a certain length l in the given network as a biological category Cp that consists of the l genes represented by the nodes of the path p. Using a Kolmogorov–Smirnov-like test that computes whether the set of genes Cp belonging to the path p are equally distributed in the expression list or accumulate on the top or bottom of the list, we determine if the given path p is deregulated (contains a large number of up- or downregulated genes) or not. The applied Kolmogorov–Smirnov-like test is a standard test of GSEA (Lamb et al., 2003) that computes the running sum of all genes in S. Hereby, the sorted list S is processed from top to bottom. Whenever a gene belonging to Cp is detected, the running sum is increased by n − l, otherwise it is decreased by l. The value of interest is the running sum's maximal deviation from zero, for which a P-value can be computed (Keller et al., 2007). Since the number of paths is growing exponentially with the length l, the brute-force approach that enumerates all paths of length l and computes the running sum for each path separately is applicable only for very small values of l.
To identify the most significant paths efficiently, we developed a novel dynamic programming algorithm, called FiDePa (Finding Deregulated Paths). Our algorithm computes the paths of length l with the smallest P-value, i.e. the paths having the maximal deviation of its running sum from zero. In order to facilitate the interpretation of the findings, the resulting paths have to be visualized in a well-arranged manner. To this end, we added respective functionality to our graph drawing tool ‘BiNA’ (Kuentzer et al., 2006; Sirava et al., 2002) that enables the user to visualize and compare significant paths.
As a first application of FiDePa, we studied pathogenic processes in human neoplasms by evaluating expression profiles of 100 glioma patients [WHO grades III and IV, extracted from the Gene Expression Omnibus (GEO; Barrett and Edgar, 2006; Edgar et al., 2002) dataset GDS1815 (Phillips et al., 2006)]. We selected this glioma expression profile dataset since a variety of clinical and histological data (WHO grade, microvascular proliferation status, necrosis and survival time) were available for the samples. As a control group, we selected 158 expression profiles [GDS596 (Su et al., 2004)] of physiologically unaffected tissues. To detect differences and similarities between the tumors, we first computed the significant paths for each patient separately. Based on these results, we constructed a glioma consensus network by unifying all paths detected with the 100 expression profiles. To facilitate the comparison of patients, the significant paths of a single tumor (patients) or groups of tumors can be projected onto the consensus network. While the consensus network identified most pathways, known to be related to glioma, the comparisons of different tumors revealed substantial differences in the activities of crucial signaling cascades.
2 ALGORITHM
In this section, we lay the theoretical basics for our new dynamic programming algorithm. We first provide some basic definitions and notations and then describe in detail, how the running sum statistics and the corresponding P-values are computed for an arbitrary biological category.
2.1 Definitions and notations
Biological networks are often represented as directed graphs G = {V, E}, where the vertices (nodes) V = {v1,…, vq} represent genes, proteins or other compounds and the directed edges e(vi, vj) ∈ E (arcs) represent interactions or reactions between the respective compounds. A path of length l in G is a sequence vp1,…, vpi, vpi+1,…, vpl of l nodes, where each pair vpi, vpi+1 of consecutive nodes is connected by a directed edge (arc), which starts in vpi and ends in vpi+1. We denote the set of all paths of length l by Pl and the subset of paths in Pl that end in the node vk by Pl(vk). The set N(vk) of predecessors of node vk is defined as
| (1) |
Besides the graph G, the input of the algorithm consists of a gene list S of length n. The genes in the list S are sorted with respect to an arbitrary criterion, e.g. their fold changes of expression values between two investigated states. Given a gene represented by a node v in the graph G, we denote the rank of the gene in the sorted list S as r(v).
2.2 Computing significance values
Our algorithm detects the statistically most significant paths in G of length up to a user-defined bound m. To compute significance values of a path p of length l, we apply a method that is known from gene set analysis, the so-called GSEA.
Performing GSEA for a biological category Cp representing a path p of length l and a sorted list S of n genes of which l belong to Cp means that a running sum statistic RS is computed for S. Here, we assume for simplicity that all genes in the respective biological category are contained in S. RS statistics evaluate whether the genes of Cp are accumulated on top or bottom of the sorted list or whether they are randomly distributed. Hereby, the sorted list is processed from top to bottom:
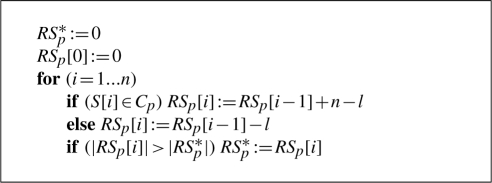
In the case of standard unweighted GSEA, whenever a gene belonging to Cp is detected, the running sum is increased by n − l, otherwise it is decreased by l. The value of interest is the running sum's maximal deviation from zero, denoted as RSp*. The significance value of the score RSp* can be calculated by a dynamic programming algorithm that computes the exact number of possible running sum statistics with higher deviation than RSp*. For details on the implemented algorithm we refer to Keller et al. (2007).
To simplify matters, we will ignore the fact that we have to consider the absolute values of the running sums and we will present a procedure that calculates the largest non-negative value of the running sum. The smallest running sum value can be computed by applying the same algorithm to the inverted gene list that starts with the last element in S.
Our dynamic programming algorithm is based on the observation that the running sum value of a path p of length l at any index i can be computed as
| (2) |
Here,
| (3) |
is the number of nodes on the path that have a rank less than or equal to i. In order to compute the most significant paths p ∈ Pl of length l where l ranges from 1 to a user-defined upper bound m, we will first focus on the subset Pl(vk) of paths that end in a certain node vk and have a fixed length of l. Hereby, we will derive a recurrence scheme that allows to solve the problem for all nodes and the considered range of path lengths in an efficient manner.
2.3 The dynamic programming algorithm
Observation 2 implies that the best score of any path p of length l ending in vk can be computed as
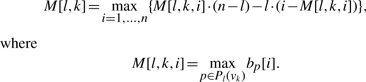 |
(4) |
In this section, we will derive the recurrence scheme for filling the 3D matrix M[l, k, i] of size m · |V| · n. If M has been filled, we can easily calculate the best running sum score for any length l and any node vk and the corresponding paths can be determined by a simple standard backtracking procedure. If no path of length l ending in node vk exists, we set M[l, k, i] = −1 for all indices i = 1,…, n.
Since the path of length 1 ending in a node vk consists only of the node vk itself, the computation of the first matrix layer M[1, k, i] is straightforward:
In the following, we derive the recurrence formula that allows for computing all values M[l, *, *] of layer l from the values M[l − 1, *, *] of layer l − 1. The idea behind the approach is similar to the principle used in shortest/longest path calculations. In order to compute the best path of length l leading to vk, we determine the optimal paths of length l − 1 ending in one of the predecessor nodes vs ∈ N(vk) and add the path of length 1 consisting of the node vk:
| (5) |
The pseudocode for filling the layers 2–m is presented below:
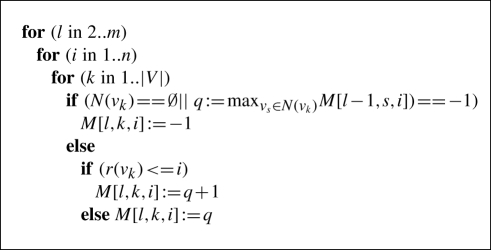
Here, the first if-statement evaluates whether any path of length l ends in vk. If this condition does not hold, M[l, k, i] is set to −1. Otherwise, the value M[l, k, i] is calculated via the recurrence in Equation (5). Since we had to avoid cycles, we added a further condition which is not listed in the pseudocode described above: our algorithm searches for the best path ending in one of the predecessor nodes vs ∈ N(vk) that does not contain node vk.
The running time of the procedure is of order O(m · n · (|V| + |E|)) where |E| is the number of edges of the graph G. Since the number n of genes in the list S is usually much larger than the number |V| of nodes in G and since the maximal scores of the running sums will only appear at list positions where a node of the graph occurs, we can easily reduce the running time to O(m · |V| · (|V| + |E|)) by iterating only over the sublist of indices in S that represent the nodes V of G. The presented procedure requires O(m · n · |V| + |E|) storage. If we are computing and storing the best paths for each node vk and the different lengths l while filling the matrix, the backtracking process is not required. Under these conditions, the layer M[l − 1, *, *] suffices to calculate the next layer M[l, *, *] and, hence, only storage for two layers is required for the dynamic programming algorithm, in addition to the data structure for the calculated optimal paths. Since we have to store m paths of length 1 to m for each node, the data structure for the optimal paths requires O(m2 · |V|) storage. Without affecting the results of the computation, the order of the nested for-statements in the procedure above can be changed such that the outer for-loop iterates over the gene list S (i = 1,…, n) and the inner for-loops over the nodes vk and the length l. Hence, the whole procedure can be carried out with two layers of size m · n. With the same argument as above, we can reduce the storage requirement of two layers to O(m · |V|) by considering only the sublist of S that consists of the nodes V. Hence, the whole procedure requires O(m2 · |V| + |E|) storage.
Of course, it cannot be guaranteed that the best paths with the most significant P-values are the ones we should be after. The FiDePa algorithm can be adapted such that paths with lower significance values are computed at additional computational cost and storage. In particular, we can modify the algorithm such that it allows for computing a constant number of (sub)optimal paths for each node and each length without changing time or space complexity. However, our current implementation enables the user to identify a large variety of significant paths since we are searching for paths of different lengths and since we are scanning all nodes in the graph (significant paths that end or start in one the nodes of the network).
For the running sum values, P-values can be easily computed as described in (Keller et al., 2007). Because of the multiple testing problem, the P-values of all nodes have to be adjusted. We applied an adjustment based on controlling the false discovery rate (FDR; Benjamini and Hochberg, 1995; Hochberg, 1988).
We implemented the FiDePa algorithm in C++. As input, FiDePa gets a sorted list of genes and a BNDB (Kuentzer et al., 2007) mysql database containing all human regulatory interactions extracted from the KEGG and TRANSPATH database. The latter database provides information on signaling molecules as well as metabolic enzymes and the reactions they are involved in, forming a complex network of interconnected reaction chains and complex pathways. The pathway information is extracted from the mysql database, the graph is built, and the gene expression data are projected onto the nodes (genes) of the graph. Since for some nodes, no expression values exist, our algorithm does not consider the respective nodes. For each node without the expression value, only the predecessors with expression values are considered.
As output, the algorithm provides a set of statistically significant paths as a plain text file. In addition to this plain text file, we also implemented a plug-in for the network visualizer BiNA to facilitate the interpretation of the relevant paths.
2.4 Computation of the sorted gene list via z-scores
To compute the sorted list S, we used so-called standard scores (z-scores) that allow for comparing observations from different normal distributions. The z-score of a given value shows by how many SDs this value is above or below the mean of a background distribution. For each transcript t, we computed its mean value μt and its SD σt based on 158 normal expression values. For a given cancer profile, we computed the z-score zt for transcript t with expression value xt as follows:
Hence, a z-score zt of 3 means that the expression value of the transcript t of the considered cancer sample is 3 SDs above the mean of the transcript in normal samples. Likewise, a z-score of −3 means that the expression value of t is 3 SDs below the mean of the transcript in normal samples.
To generate the list S for a given cancer profile, the absolute values of the z-scores of all genes were sorted in decreasing order such that the most deregulated genes occur on the top of the list.
2.5 Visualization
If we are applying our novel algorithm, e.g. to a set of cancer expression profiles that will be compared with expression profiles from a control group, our algorithm computes and outputs the significant paths for each cancer profile (tumor, patient) separately. Afterwards the algorithm calculates the so-called consensus graph as the union of all paths detected in at least one of the patients. The plug-in for the network visualizer BiNA enables the user to upload the paths of a single patient and to visualize these paths as a highlighted subgraph of the consensus graph. Furthermore, the plug-in also facilitates the comparison of deregulated processes between two tumors (or groups of tumors) by allowing the user to load two sets of deregulated paths. The paths will be mapped to the consensus graph and highlighted in different colors. Here, edges are colored according to the following scheme: edges that are significant in both profiles are marked green, edges that are significant in the first profile are marked blue and edges that are significant in the second profile are marked red. Moreover, BiNA also offers an overview of the edge or reaction frequencies, i.e. the thickness of the edges indicates how often certain reactions have been detected in the different cancer profiles. The BiNA graphical user interface (GUI) for visualizing FiDePa results is presented in Figure 1.
Fig. 1.

BiNA GUI for the visualization of the FiDePa results.
3 RESULTS
We have applied our novel dynamic programming algorithm to study deregulated signaling cascades in glioma tumors. To this end, we analyzed 100 glioma expression profiles of WHO grades III and IV (Phillips et al., 2006). For the respective patients, a variety of clinical and histological data including the WHO grade, microvascular proliferation status, necrosis and survival times, are available. As background distribution, we used 158 expression profiles (GDS596; Su et al., 2004) of physiologically unaffected tissues. Control and cancer expression profiles were downloaded from the GEO and all profiles were quantile normalized (Bolstad et al., 2003). Then, for each transcript, the mean value and the SD of the transcript in the control profiles were computed. For all transcripts of each cancer profile, the z-scores (details to the computation of z-scores can be found in Section 2.4) of the transcripts were calculated and corresponding genes were sorted with respect to the absolute value of their z-scores in a decreasing order, resulting in one sorted gene list for each cancer profile. The input of the FiDePa algorithm consisted of the sorted z-score lists and the union of the KEGG and TRANSPATH networks that was imported from our BNDB database (Kuentzer et al., 2007). For each cancer profile, we carried out the following computation steps: the z-scores of the genes present in the network were assigned to the corresponding nodes, the ranks of the nodes were calculated, the dynamic programming algorithm was carried out and the resulting paths plus their P-values were computed as described in Section 2.2. Hereby, the considered path lengths ranged from 2 to 8 edges. Afterwards, the consensus graph unifying all detected paths was constructed and stored. Finally, we analyzed the obtained results by carrying out comprehensive statistical tests that will be described below. The workflow of the whole analysis procedure is summarized in Figure 2.
Fig. 2.

FiDePa Workflow.
3.1 Glioma paths
First, we studied the glioma consensus graph, consisting of the union of edges that proved to be significant in at least one of the analyzed glioma expression profiles. The consensus graph consisted of a total of 192 nodes and 549 edges. The genes that occurred most frequently in the deregulated subnetworks are ATF4 (45), ELK1 (43), DDIT3 (39), MAP2K2 (38), MAPKAPK5 (37), ATF2 (36), MOS (36), TP53 (36), JUN (34), MAP2K7 (34), CDC25B (32), MAP2K3 (32), MAP3K10 (32), MYC (32), ELK4 (31), MAP2K1 (31) and MAPT (31). Here, the numbers in brackets denote the number of cancer profiles where FiDePa detected paths, containing the respective genes. A literature inquiry revealed that all these genes are closely connected to cancer development or progression, most of them are also directly connected to glioma. As the gene list indicates, many of the above genes belong to the MAPK (mitogen-activated protein kinase) signaling pathway or to the Apoptosis pathway. To detect the significantly enriched biochemical pathways, we used the web-based tool GeneTrail (Backes et al., 2007). We carried out an overrepresentation analysis, comparing the genes of the consensus network to all human genes using GeneTrail's standard parameters. Our analysis revealed a total of 26 significantly enriched KEGG pathways (Table 1). On top of the results list appeared the ‘MAPK signaling pathway’, with an expected number of 18 genes and an observed number of 69 genes. The pathway with the second best significance value was the ‘Natural killer cell-mediated cytotoxicity’, with an expected number of 9 genes and an observed number of 34 genes, followed by the ‘Apoptosis’ with 25 observed genes and 5 expected genes. The list, of course, entailed several cancer pathways, including colorectal cancer, pancreatic cancer and glioma.
Table 1.
Significant KEGG pathways on the consensus network
| Pathway | No. exp. | No. obs. | Sig. |
|---|---|---|---|
| genes | genes | value | |
| MAPK signaling pathway | 18 | 69 | 1.6−25 |
| Natural killer cell-mediated cytotoxicity | 9 | 34 | 1.39−11 |
| Apoptosis | 5 | 25 | 9.29−11 |
| Epithelial cell sig. in Helicobacter pylori infection | 3 | 17 | 5.01−10 |
| Focal adhesion | 9 | 26 | 2.52−06 |
| Adherens junction | 5 | 18 | 1.38−05 |
| T-cell receptor signaling pathway | 5 | 18 | 1.46−05 |
| Chronic myeloid leukemia | 4 | 16 | 1.65−05 |
| Fc epsilon RI signaling pathway | 4 | 16 | 1.85−05 |
| Toll-like receptor signaling pathway | 5 | 17 | 5.53−05 |
| Colorectal cancer | 2 | 10 | 9.40−05 |
| Pancreatic cancer | 4 | 14 | 0.0001 |
| Cytokine–cytokine receptor interaction | 14 | 30 | 0.0001 |
| Adipocytokine signaling pathway | 4 | 14 | 0.0001 |
| mTOR signaling pathway | 2 | 10 | 0.0002 |
| GnRH signaling pathway | 6 | 17 | 0.0003 |
| B-cell receptor signaling pathway | 4 | 11 | 0.0013 |
| Insulin signaling pathway | 9 | 20 | 0.0013 |
| Cell cycle | 5 | 13 | 0.0014 |
| Glioma | 4 | 11 | 0.003 |
| Type II diabetes mellitus | 3 | 9 | 0.0033 |
| VEGF signaling pathway | 5 | 12 | 0.0059 |
| Type I diabetes mellitus | 0 | 3 | 0.0059 |
| Leukocyte transendothelial migration | 5 | 11 | 0.0135 |
| Axon guidance | 8 | 15 | 0.0173 |
| Maturity onset diabetes of the young | 2 | 5 | 0.0386 |
To compare the results of our FiDePa algorithm with an analysis, which does not consider the network topology, we carried out a standard GSEA by using the GeneTrail web server (Backes et al., 2007). The results of the computation for KEGG and Transpath pathways, TRANSFAC transcription factors, gene ontologies categories and others can be reviewed online at http://genetrail.bioinf.uni-sb.de/paper/fidepa/summaryPage.html. The KEGG pathway analysis identified 16 enriched pathways, including several pathways that were also identified by FiDePa, e.g. the ‘Natural killer cell-mediated cytotoxicity’ or the ‘T-cell receptor signaling pathway’. However, some clearly cancer-related pathways including ‘Apoptosis’, ‘Glioma cancer’, ‘Pancreatic cancer’, ‘MAPK signaling pathway’ and others were only identified by the FiDePa analysis, while they were missed using the standard GSEA.
3.2 Clustering of significant networks
To validate whether the detected paths can be exploited to differentiate between histological or clinical states, we performed a complete linkage hierarchical clustering. To this end, we encoded the subnetworks of the consensus graph belonging to one cancer profile as binary vectors, where each vector component represents one reaction. A vector entry of ‘1’ means that the respective edge has been detected in at least one significant path of the respective tumor profile. As a distance measure for the clustering, we used the Manhattan distance between the binary vectors. In a preprocessing step, we removed edges that occurred in <10% of the patients, reducing the number of edges to 96. Likewise, we excluded the patients for whom no clinical information was available. We considered the WHO grades III and IV, necrosis status, microvascular proliferation and the survival rates of patients.
Splitting the cluster dendrogram in two clusters, we found one cluster containing nine WHO III and 12 WHO IV samples and one cluster containing two WHO III and 24 WHO IV samples. The P-value for this result, computed using Fisher's exact test, was 0.0056. Examining the proliferation of tumor cells, we found one cluster containing seven samples without microvascular proliferation and four samples with microvascular proliferation. The second cluster contained four samples without microvascular proliferation and 27 samples with microvascular proliferation. The respective P-value was 0.0026. With respect to the necrosis of tumor cells, we found one cluster containing nine samples not showing necrosis and two samples with necrosis. The second cluster contained six samples without necrosis and 25 samples with necrosis. The respective P-value was 0.0004. Additional information on the paths differing between the long- and short-time survivors and the grade III versus grade IV patients are provided in the Supplementary Material.
3.3 Single patient analysis
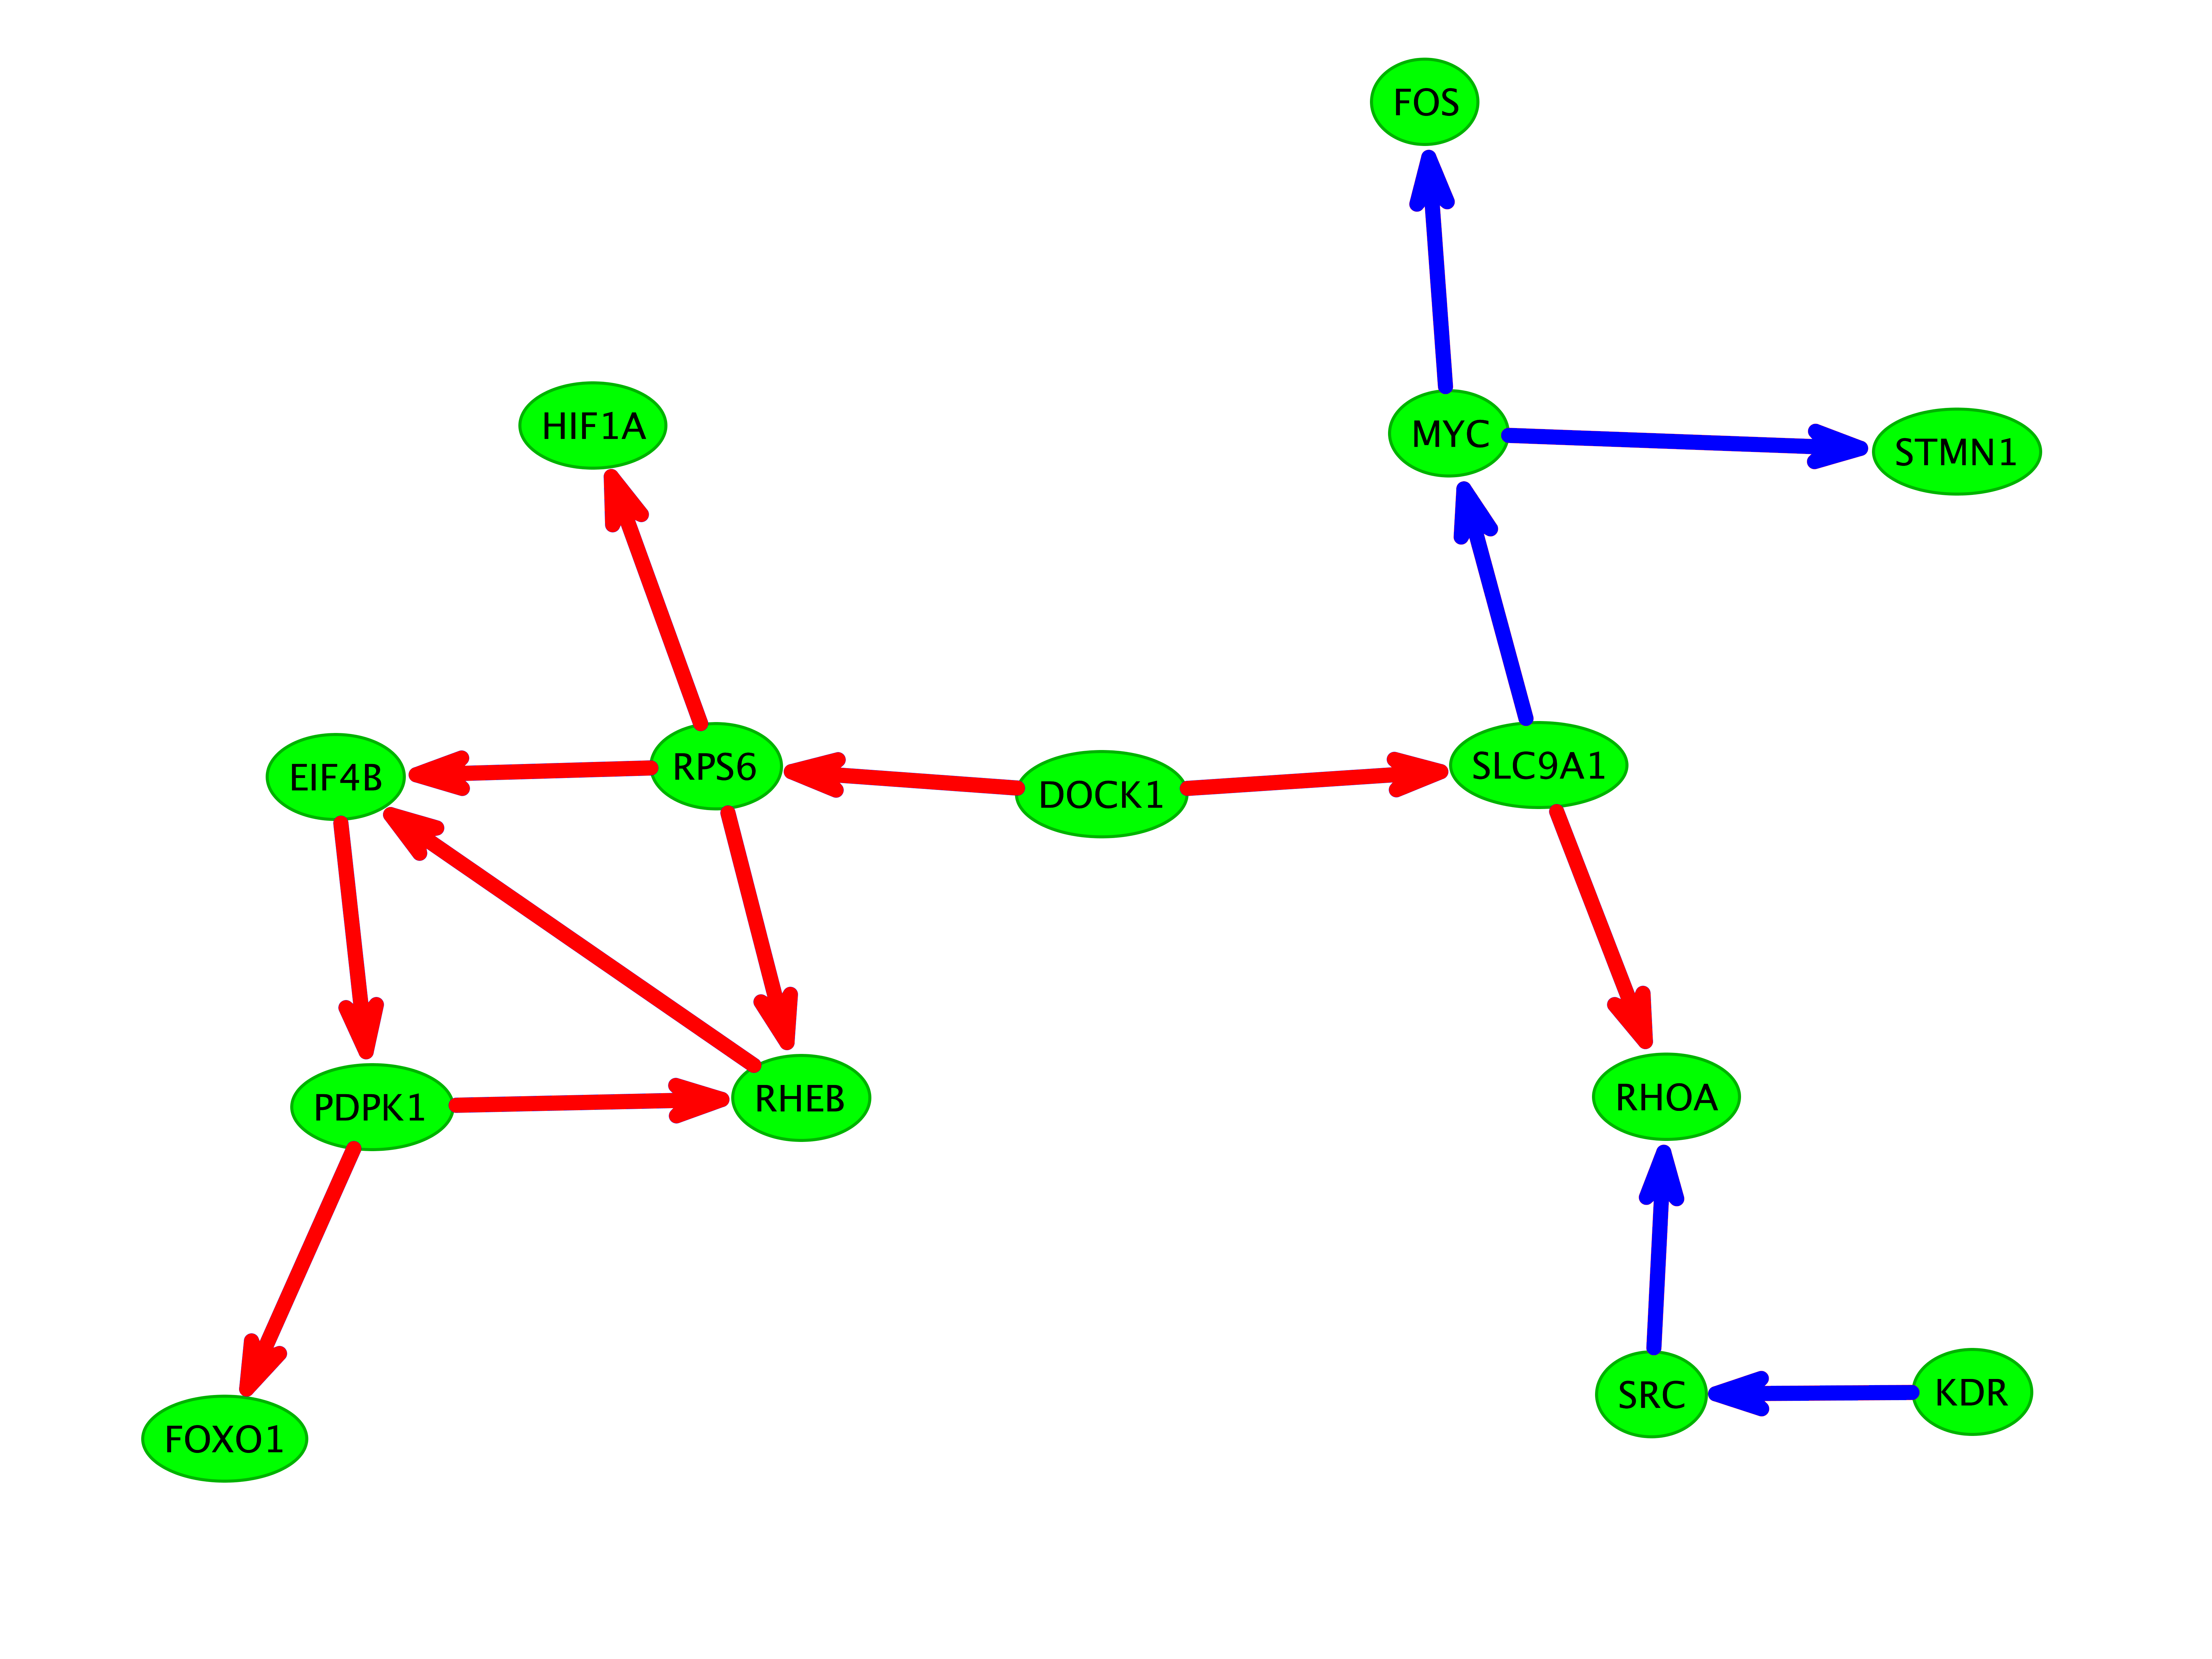
To demonstrate the applicability of the FiDePa algorithm, we compared two WHO grade III gliomas, both without microvascular proliferation and necrosis. Both patients were of similar age with 39 and 35 years. However, the respective survival time were quite different with 41 weeks and 477 weeks. The comparison of the deregulated networks of both tumors revealed a very small overlap, as shown in Figure 3.
Fig. 3.

BiNA visualization of the two patients A (blue, survival time 477 weeks) and B (red, survival time 41 weeks). Edges on significant paths in both tumors are colored green. The network shows the relevant part of the complete consensus network, whereas the non-relevant part of the consensus network is presented by gray edges and nodes in the background.
4 DISCUSSION
In this work, we presented a dynamic programming algorithm that aims at detecting the significantly deregulated signaling cascades in tumor cells. The FiDePa algorithm interprets expression differences between tumor and normal tissue and relies on GSEA. Since FiDePa enables the comparison of a single tumor expression profile with the control group, it provides information on regulatory features that are specific for the corresponding tumor and that can contribute to a personalized medicine by tailoring the tumor therapy to the specific regulatory tumor features identified by FiDePa.
The application of FiDePa to a glioma dataset showed that the algorithm is able to detect the relevant signaling cascades that are known to be glioma and/or cancer related. The most significant pathway was the MAPK signaling cascade, followed by the Natural killer cell-mediated cytotoxicity and the Apoptosis. It is well known that both pathways are deregulated in glioma: the MAPK signaling cascade, e.g. is described to be deregulated in glioma in various studies (Chattopadhyay et al., 2002; Cuevas et al., 2006; Kam et al., 2007; Schlegel et al., 2000). An upregulation of the MAPK signaling cascade in cultured glioma cells mediated by fibroblast growth factors indicated that MAPK pathway participates in the FGF-dependent glioma development (Cuevas et al., 2006). As for the MAPK signaling pathway, we were able to retrieve all other significant pathways in the glioma literature, providing evidence for the effectiveness of the FiDePa algorithm. However, besides the results coherent with the findings in the literature some additional glioma-related pathways are cited in the literature. For example, Phillips et al. (2006) suggest that Akt and Notch signaling are hallmarks of a poor prognosis of gliomas, while these pathways were not ostentatious in our work. This, however, might be explained by the fact that our FiDePa analysis did not focus on prognosis, but on the comparison of glioma and normal tissue. In 2008, two large-scale integrated studies on glioblastoma have been published by McLendon et al. (2008) and Parsons et al. (2008). McLendon and co-workers identified ERBB2, NF1 and TP53 as key players in glioblastoma together with the RTK signaling, the p53 and RB tumor suppressor pathways. In our expression pattern-based study, we identified the TP53 component, while the other pathways play a less important role. In contrast to our results, the MAPK signaling cascade is non-significant in the study of McLendon et al., which is based on genetic alterations including validated somatic nucleotide substitutions, homozygous deletions and focal amplifications. Parson and co-workers identified the gene IDH1 as CAN-gene (candidate cancer gene) by integrating of sequencing, copy number and expression data. However, this gene does not show significant deregulation in our data and thus is not included in our consensus network. Other CAN genes identified by Parson et al. were included in our network, e.g. TP53, RB1 or EGFR.
An unsupervised cluster analysis demonstrated that a clustering based on the detected paths subdivides the tumors into groups that correlate well with different clinical states. Moreover, we found substantially different paths for two patients with strikingly different survival times but with tumors of otherwise similar clinical behavior. Our results confirm that tumors of the same type can be rather heterogeneous. As discussed above, the consensus network of all patients contains most pathways that are known to be glioma or cancer related. However, the consensus network of a single patient is only a subnet of the complete consensus network revealing the regulatory pathways (mechanisms) that are deregulated or most significantly modified in this tumor. Hence, the approach may detect differences in the active oncogenic mechanisms that may help to optimize the therapy for each patient individually. The vision behind our project is to develop a visual analytics tool that supports doctors in making therapeutical decisions. Such a tool should offer not only functionality for analyzing and visualizing deregulated signaling cascades, but also access to a database storing deregulated consensus networks of patients together with their clinical data, especially the therapeutic history.
In this work, the FiDePa algorithm has been applied for studying regulatory networks, which play an essential role for cancer development and progression. However, our algorithm can of course be applied to arbitrary networks, including protein–protein interaction networks. Here, an additional preprocessing step is necessary for matching the proteins in the network to the genes in the sorted list.
In the light of the ongoing discussion on the quality and effectiveness of gene set analysis methods (Ackermann and Strimmer, 2009; Holden et al., 2008; Lin et al., 2008), we would like to underline that our dynamic programming approach can be easily adapted to other gene set analysis method or gene scoring approaches, e.g. Wilcoxon rank-sum test, median, mean, SAMGS and some other approaches discussed in Ackermann and Strimmer (2009). Actually, the dynamic programming algorithm can be simplified for most of the other gene set analysis methods. However, the direct P-value computation usually has to be replaced by more laborious permutation tests.
Funding: This work was supported by the Deutsche Forschungsgemeinschaft Priority Program SPP 1335 [LE 952/3-1, KO 2313/3-1, KA 812/13-1].
Conflict of Interest: none declared.
Supplementary Material
REFERENCES
- Ackermann M, Strimmer K. A general modular framework for gene set enrichment analysis. BMC Bioinformatics. 2009;10:47. doi: 10.1186/1471-2105-10-47. [DOI] [PMC free article] [PubMed] [Google Scholar]
- Al-Shahrour F, et al. FatiGO: a web tool for finding significant associations of Gene Ontology terms with groups of genes. Bioinformatics. 2004;20:578–580. doi: 10.1093/bioinformatics/btg455. [DOI] [PubMed] [Google Scholar]
- Al-Shahrour F, et al. BABELOMICS: a suite of web tools for functional annotation and analysis of groups of genes in high-throughput experiments. Nucleic Acids Res. 2005;33:W460–W464. doi: 10.1093/nar/gki456. [DOI] [PMC free article] [PubMed] [Google Scholar]
- Ashburner M, et al. Gene ontology: tool for the unification of biology. The Gene Ontology Consortium. Nat. Genet. 2000;25:25–29. doi: 10.1038/75556. [DOI] [PMC free article] [PubMed] [Google Scholar]
- Backes C, et al. GeneTrail–advanced gene set enrichment analysis. Nucleic Acids Res. 2007;35:W186–W192. doi: 10.1093/nar/gkm323. [DOI] [PMC free article] [PubMed] [Google Scholar]
- Barrett T, Edgar R. Gene Expression Omnibus: microarray data storage, submission, retrieval, and analysis. Meth. Enzymol. 2006;411:352–369. doi: 10.1016/S0076-6879(06)11019-8. [DOI] [PMC free article] [PubMed] [Google Scholar]
- Benjamini Y, Hochberg Y. Controlling the false discovery rate: a practical and powerful approach to multiple testing. J. R. Stat. Soc. B. 1995;57:289–300. [Google Scholar]
- Bolstad BM, et al. A comparison of normalization methods for high density oligonucleotide array data based on variance and bias. Bioinformatics. 2003;19:185–193. doi: 10.1093/bioinformatics/19.2.185. [DOI] [PubMed] [Google Scholar]
- Cabusora L, et al. Differential network expression during drug and stress response. Bioinformatics. 2005;21:2898–2905. doi: 10.1093/bioinformatics/bti440. [DOI] [PubMed] [Google Scholar]
- Chattopadhyay N, et al. PKC, p42/44 MAPK and p38 MAPK regulate hepatocyte growth factor secretion from human astrocytoma cells. Brain Res. Mol. Brain Res. 2002;102:73–82. doi: 10.1016/s0169-328x(02)00215-2. [DOI] [PubMed] [Google Scholar]
- Chuang HY, et al. Network-based classification of breast cancer metastasis. Mol. Syst. Biol. 2007;3:140. doi: 10.1038/msb4100180. [DOI] [PMC free article] [PubMed] [Google Scholar]
- Cuevas P, et al. Dobesilate diminishes activation of the mitogen-activated protein kinase ERK1/2 in glioma cells. J. Cell. Mol. Med. 2006;10:225–230. doi: 10.1111/j.1582-4934.2006.tb00303.x. [DOI] [PMC free article] [PubMed] [Google Scholar]
- Dahlquist K, et al. GenMAPP, a new tool for viewing and analyzing microarray data on biological pathways. Nat. Genet. 2002;31:19–20. doi: 10.1038/ng0502-19. [DOI] [PubMed] [Google Scholar]
- Dittrich M, et al. Identifying functional modules in protein-protein interaction networks: an integrated exact approach. Bioinformatics. 2008;24:i223–i231. doi: 10.1093/bioinformatics/btn161. [DOI] [PMC free article] [PubMed] [Google Scholar]
- Edgar R, et al. Gene Expression Omnibus: NCBI gene expression and hybridization array data repository. Nucleic Acids Res. 2002;30:207–210. doi: 10.1093/nar/30.1.207. [DOI] [PMC free article] [PubMed] [Google Scholar]
- Fellenberg M, Mewes H-W. Interpreting clusters of gene expression profiles in terms of metabolic pathways. Proceedings of German Conference on Bioinformatics. 1999:185–187. [Google Scholar]
- Ganter B, Giroux C. Emerging applications of network and pathway analysis in drug discovery and development. Curr. Opin. Drug Discov. Dev. 2008;11:86–94. [PubMed] [Google Scholar]
- Hochberg Y. A sharper bonferroni procedure for multiple tests of significance. Biometrika. 1988;75:800–802. [Google Scholar]
- Holden M, et al. GSEA-SNP: applying gene set enrichment analysis to SNP data from genome-wide association studies. Bioinformatics. 2008;24:2784–2785. doi: 10.1093/bioinformatics/btn516. [DOI] [PubMed] [Google Scholar]
- Ideker T, et al. Discovering regulatory and signalling circuits in molecular interaction networks. Bioinformatics. 2002;18(Suppl. 1):S233–S240. doi: 10.1093/bioinformatics/18.suppl_1.s233. [DOI] [PubMed] [Google Scholar]
- Kam A, et al. Formyl peptide receptor like 1 differentially requires mitogen-activated protein kinases for the induction of glial fibrillary acidic protein and interleukin-1alpha in human U87 astrocytoma cells. Cell. Signal. 2007;19:2106–2117. doi: 10.1016/j.cellsig.2007.06.005. [DOI] [PubMed] [Google Scholar]
- Kanehisa M. The KEGG database. Novartis Found. Symp. 2002;247:91–101. [PubMed] [Google Scholar]
- Kanehisa M, et al. From genomics to chemical genomics: new developments in KEGG. Nucleic Acids Res. 2006;34:D354–D357. doi: 10.1093/nar/gkj102. [DOI] [PMC free article] [PubMed] [Google Scholar]
- Keller A, et al. Computation of significance scores of unweighted Gene Set Enrichment Analyses. BMC Bioinformatics. 2007;8:290. doi: 10.1186/1471-2105-8-290. [DOI] [PMC free article] [PubMed] [Google Scholar]
- Krull M, et al. TRANSPATH: an information resource for storing and visualizing signaling pathways and their pathological aberrations. Nucleic Acids Res. 2006;34:D546–D551. doi: 10.1093/nar/gkj107. [DOI] [PMC free article] [PubMed] [Google Scholar]
- Kueffner R, et al. Pathway analysis in metabolic databases via differential metabolic display (DMD) Bioinformatics. 2000;16:825–836. doi: 10.1093/bioinformatics/16.9.825. [DOI] [PubMed] [Google Scholar]
- Kuentzer J, et al. BN++- a biological information system. J. Integr. Bioinform. 2006;3:34. [Google Scholar]
- Kuentzer J, et al. BNDB - the biochemical network database. BMC Bioinformatics. 2007;8:367. doi: 10.1186/1471-2105-8-367. [DOI] [PMC free article] [PubMed] [Google Scholar]
- Kurhekar M, et al. Genome-wide pathway analysis and visualization using gene expression data. Pac. Symp. Biocomput. 2002:462–473. doi: 10.1142/9789812799623_0043. [DOI] [PubMed] [Google Scholar]
- Lamb J, et al. A mechanism of cyclin d1 action encoded in the patterns of gene expression in human cancer. Cell. 2003;114:323–332. doi: 10.1016/s0092-8674(03)00570-1. [DOI] [PubMed] [Google Scholar]
- Lee H, et al. ErmineJ: tool for functional analysis of gene expression data sets. BMC Bioinformatics. 2005;6:269. doi: 10.1186/1471-2105-6-269. [DOI] [PMC free article] [PubMed] [Google Scholar]
- Lin R, et al. Gene set enrichment analysis for non-monotone association and multiple experimental categories. BMC Bioinformatics. 2008;9:481. doi: 10.1186/1471-2105-9-481. [DOI] [PMC free article] [PubMed] [Google Scholar]
- Liu C, et al. Topology-based cancer classification and related pathway mining using microarray data. Nucleic Acids Res. 2006;34:4069–4080. doi: 10.1093/nar/gkl583. [DOI] [PMC free article] [PubMed] [Google Scholar]
- Liu M, et al. Network-based analysis of affected biological processes in type 2 diabetes models. PLoS Genet. 2007;3:e96. doi: 10.1371/journal.pgen.0030096. [DOI] [PMC free article] [PubMed] [Google Scholar]
- McLendon R, et al. Comprehensive genomic characterization defines human glioblastoma genes and core pathways. Nature. 2008;455:1061–1068. doi: 10.1038/nature07385. [DOI] [PMC free article] [PubMed] [Google Scholar]
- Mootha V, et al. Pgc-1alpha-responsive genes involved in oxidative phosphorylation are coordinately downregulated in human diabetes. Nat. Genet. 2003;34:267–273. doi: 10.1038/ng1180. [DOI] [PubMed] [Google Scholar]
- Nam D, Kim S. Gene-set approach for expression pattern analysis. Brief. Bioinform. 2008;9:189–197. doi: 10.1093/bib/bbn001. [DOI] [PubMed] [Google Scholar]
- Parsons DW, et al. An integrated genomic analysis of human glioblastoma multiforme. Science. 2008;321:1807–1812. doi: 10.1126/science.1164382. [DOI] [PMC free article] [PubMed] [Google Scholar]
- Phillips H, et al. Molecular subclasses of high-grade glioma predict prognosis, delineate a pattern of disease progression, and resemble stages in neurogenesis. Cancer Cell. 2006;9:157–173. doi: 10.1016/j.ccr.2006.02.019. [DOI] [PubMed] [Google Scholar]
- Rahnenfuehrer J, et al. Calculating the statistical significance of changes in pathway activity from gene expression data. Stat. Appl. Genet. Mol. Biol. 2004;3 doi: 10.2202/1544-6115.1055. Article16. [DOI] [PubMed] [Google Scholar]
- Salomonis N, et al. GenMAPP 2: new features and resources for pathway analysis. BMC Bioinformatics. 2007;8:217. doi: 10.1186/1471-2105-8-217. [DOI] [PMC free article] [PubMed] [Google Scholar]
- Schlegel J, et al. The Akt/protein kinase B-dependent anti-apoptotic pathway and the mitogen-activated protein kinase cascade are alternatively activated in human glioblastoma multiforme. Cancer Lett. 2000;158:103–108. doi: 10.1016/s0304-3835(00)00515-2. [DOI] [PubMed] [Google Scholar]
- Shannon A mathematical theory of communication. Bell Syst. Tech. J. 1984;27:623–656. [Google Scholar]
- Sirava M, et al. BioMiner–modeling, analyzing, and visualizing biochemical pathways and networks. Bioinformatics. 2002;18(Suppl. 2):S219–S230. doi: 10.1093/bioinformatics/18.suppl_2.s219. [DOI] [PubMed] [Google Scholar]
- Su A, et al. A gene atlas of the mouse and human protein-encoding transcriptomes. Proc. Natl Acad. Sci. USA. 2004;101:6062–6067. doi: 10.1073/pnas.0400782101. [DOI] [PMC free article] [PubMed] [Google Scholar]
- Subramanian A, et al. Gene set enrichment analysis: a knowledge-based approach for interpreting genome-wide expression profiles. Proc. Natl Acad. Sci. USA. 2005;102:15545–15550. doi: 10.1073/pnas.0506580102. [DOI] [PMC free article] [PubMed] [Google Scholar]
- Ulitsky I, et al. Proceedings of Research in Computational Molecular Biology (RECOMB) Berlin: Springer; 2008. Detecting disease-specific dysregulated pathways via analysis of clinical expression profiles; pp. 347–359. [Google Scholar]
- Xiong M, et al. Network-based regulatory pathways analysis. Bioinformatics. 2004;20:2056–2066. doi: 10.1093/bioinformatics/bth201. [DOI] [PubMed] [Google Scholar]
- Zhang B, et al. WebGestalt: an integrated system for exploring gene sets in various biological contexts. Nucleic Acids Res. 2005;33:W741–W748. doi: 10.1093/nar/gki475. [DOI] [PMC free article] [PubMed] [Google Scholar]
- Zien A, et al. Analysis of gene expression data with pathway scores. Proc. Int. Conf. Intell. Syst. Mol. Biol. 2000;8:407–417. [PubMed] [Google Scholar]
Associated Data
This section collects any data citations, data availability statements, or supplementary materials included in this article.