Abstract
The p21-activated kinase (PAK) 1 kinase, an effector of the Cdc42 and Rac1 GTPases, regulates cell protrusions and motility by controlling actin and adhesion dynamics. Its deregulation has been linked to human cancer. We show here that activation of PAK1 is necessary for protrusive activity during cell spreading. To investigate PAK1 activation dynamics at live protrusions, we developed a conformational biosensor, based on fluorescence resonance energy transfer. This novel PAK1 biosensor allowed the spatiotemporal visualization of PAK1 activation during spreading of COS-7 cells and during motility of normal rat kidney cells. By using this imaging approach in COS-7 cells, the following new insights on PAK1 regulation were unveiled. First, PAK1 acquires an intermediate semi-open conformational state upon recruitment to the plasma membrane. This semi-open PAK1 species is selectively autophosphorylated on serines in the N-terminal regulatory region but not on the critical threonine 423 in the catalytic site. Second, this intermediate PAK1 state is hypersensitive to stimulation by Cdc42 and Rac1. Third, interaction with PIX proteins contributes to PAK1 stimulation at membrane protrusions, in a GTPase-independent way. Finally, trans-phosphorylation events occur between PAK1 molecules at the membrane possibly playing a relevant role for its activation. This study leads to a model for the complex and accurate regulation of PAK1 kinase in vivo at cell protrusions.
PAK1 is the first identified and best characterized member of the PAK (p21-activated kinase)2 family of serine/threonine protein kinases, which comprises six members in humans (1). As a major downstream effector of the Rho family small GTPases Cdc42 and Rac1, PAK1 plays a fundamental role in controlling cell motility by linking a variety of extracellular signals to changes in actin cytoskeleton organization, cell shape, and adhesion dynamics. PAK1 is also involved in other fundamental cellular processes, including cell division, apoptosis, and gene transcription (2). Such a crucial role in cellular life explains the fact that this kinase is subjected to a complex and exquisite regulation capable of integrating a variety of signals according to specific physiological needs. Defects in this regulation may be fatal and a clear implication of PAK1 in human cancer has recently been emerging (3).
The biochemistry of PAK1 has been extensively studied (4) and its crystal structure solved (5). The GTPase-binding domain, also found in several other Cdc42/Rac1 effectors, partially overlaps with a region exhibiting autoinhibitory features, the PAK inhibitory domain (PID). PAK1 molecules form trans-inhibited homodimers in which the N-terminal regulatory domain of one PAK1 molecule in the dimer binds and inhibits the C-terminal catalytic domain of the other. Binding of Cdc42/Rac1, by rearranging the folding of the regulatory domain, dissociates the dimers and leads to the active-state conformation in which the inhibitory segment is removed from the catalytic site (6). Activation is accompanied by autophosphorylation events, some of which are responsible for stabilizing the open active conformation. This is the case of serine 144 in the GTPase-binding domain (7) and threonine 423 in the activation loop of the catalytic site (8).
One challenge in PAK1 biology research is to understand how the spatial and temporal regulation of PAK1 is achieved in the context of living cells while executing their cellular activities. The development of live cell imaging technologies opened new perspectives, in particular with regard to the investigation of highly spatiotemporally coordinated processes such cell motility.
To achieve protrusion formation and motility, PAK1 phosphorylates several cellular targets that are direct regulators of actin cytoskeleton dynamics, including MLCK (myosin II light chain kinase), LIM kinase (an inhibitor of the actin depolymerization factor cofilin), filamin (cross-linker of actin filaments) (2), and p41-Arc (a subunit of the actin nucleating and branching Arp2/3 complex) (9). Activated PAK1 has been observed at the leading edge of lamellipodia by immunofluorescence techniques on fixed cells (10), and a recent study pointed out a fundamental role of the Rac1/PAK1/LIMK/cofilin pathway in protrusion dynamics (11). However, our knowledge of the fine dynamics of local and temporal regulation of PAK1 kinase activity in motile cells is very poor.
It is known that cellular localization of PAK1 is controlled by interaction with some of its partners. The direct interaction with the Nck (12) and Grb2 (13) adaptors links PAK1 to tyrosine kinase receptors, whereas binding to PIXα/β recruits PAK1 to be a component of the PIX-GIT-paxillin multiprotein complex at focal adhesions (14). As a consequence of these interactions, PAK1, which is mainly cytosolic or associated with endo-vesicles (2), can be recruited to the plasma membrane or to focal adhesions in response to several extracellular stimuli. Recruitment to the plasma membrane is sufficient to activate PAK1 (15), however the exact mechanism of activation is unclear, particularly in regard to the role of the Cdc42/Rac1 GTPases (16, 17).
The tight control of its activators Cdc42 and Rac1 constitutes another level of PAK1 regulation in space and time. The spatiotemporal visualization of the activity of Cdc42 and Rac1 was achieved thanks to the development of fluorescent biosensors, unveiling the precise coordination between the activation of these GTPases and cellular protruding activity, during motility (18), membrane ruffling (19), and cell spreading (20). Active GTP-bound Cdc42 and Rac1 are present in nascent protrusions, but absent at retractions and at the rear of motile cells, supporting the concept that they play master roles in protrusiveness. In this context, PAK1 is clearly a crucial downstream player, but the understanding of the dynamics of PAK1 activity has been hindered by the lack of appropriate experimental tools (21).
In the present study, we describe an innovative biosensor for PAK1 activity in living cells based on Förster or fluorescence resonance energy transfer (FRET) technology. Using this tool, we achieved the direct visualization of PAK1 activation during cell spreading and motility, and investigated the complexity of the signals regulating PAK1 in the cellular spatial context. Taken together with previous findings, our results lead to a comprehensive model for activation of PAK1 kinase at cell protrusions.
EXPERIMENTAL PROCEDURES
The FRET Biosensor for PAK1
The cDNA fragment encoding the region 65–545 (C terminus) of the PAK1 protein was cloned using PCR-based methods as a Sal1-Not1insert into the Xho1-Not1 sites of vectors from the pRaichu-Ras family (22), which are derived from the pCAGGS eukaryotic expression plasmid. Pakabi encodes the following chimeric protein: YFP (aa 1–239), a spacer (Leu-Asp-Thr-Met), human PAK1 (aa 65–545), a spacer (Cys-Gly-Arg), and CFP (aa 1–237). Pakabix carries an extension, beyond the C terminus of Pakabi, comprising a spacer (Gly-Arg-Ser-Arg) and the C-terminal region of Ki-Ras4B (aa 169–188). In this study, we used enhanced YFP (T65G, V68L, S72A, M153T, V163A, S175G, and T203Y) or Venus (F46L, T65G, V68L, S72A, M153T, V163A, S175G, and T203Y) (23) as an acceptor and enhanced CFP (K26R, Y66W, D129G, N146I, M153T, V163A, N164H, and S175G) as a donor. Biosensors carrying the following PAK1 mutations were used: the substitution of amino acids 81–87 of the CRIB motif with the sequence ASAASAA abolishes GTPase binding, R193A mutant is deficient in PIX binding, and K299R mutant is kinase-dead (6).
Cells, Other Plasmids, siRNAs, Reagents
COS-1, COS-7 (monkey kidney fibroblast-like cells), NRK (normal rat kidney cells), HEK-HT (human epithelial kidney cells, kindly provided by Chris Counter), and RPE1 (human retinal pigmented epithelial cells) cell lines were grown in Dulbecco's modified Eagle's medium supplemented with 2 mm glutamine, antibiotics (100 units/ml penicillin and 100 μg/ml streptomycin), and 10% fetal bovine serum. pRaichu-Cdc42 1054× (C terminus of Ki-Ras) (18), pCXN2-mRFP-Cdc42 wild-type, and pCXN2-mRFP-Cdc42V12 were reported previously (19). pERedNLS-Flag-Cdc42V12 drives co-expression of Flag-Cdc42V12 and Express Red protein via an internal ribosome entry site (24). pEBB-PAK1-HA and pEBB-Src-PAK1-HA were obtained from Bruce Mayer, as well as antibodies directed against PAK1 (15). The expression vector for YFP-PID was pCMV-YFP-PAK1-aa 83–149, provided by Dr. Dianqing Lu. The phospho-PAK1 (Ser-199/204) and phospho-PAK1 (Thr-423) antibodies were purchased from Cell Signaling (#2605 and #2601). Transient transfections of DNAs were done with Lipofectamine Plus (Invitrogen). siRNAs were purchased from Qiagen and transfected with HiPerfect (Qiagen). The target sequences were: AACGTACGCGGAATACTTCGA (siLuciferase), ACCCTAAACCATGGTTCTAAA (siPAK1 #1), AAGAGAAAGAGCGGCCAGAGA (siPAK1 #2), and CAGCTATTACTGAATTATAGA (siPAK2).
Cell lysates for Western blot analysis were prepared in PAK lysis buffer (25 mm Tris-HCl, pH 7.4, 150 mm NaCl, 5 mm EDTA, 1% Triton X-100, 10% glycerol, 50 mm NaF, 10 mm sodium β-glycerophosphate) freshly supplemented with 1 μm okadaic acid (Alexis, #350-011-C025), 1 mm Na3VO4, 1 mm dithiothreitol, and a protease inhibitor mixture (Roche Applied Science, #1836170).
Cell Spreading
Cells were serum-starved for 2–3 h in MEM, trypsinized, re-suspended in MEM with 1% bovine serum albumin and 1 mg/ml soybean trypsin inhibitor, washed once, kept for 15–60 min in suspension in MEM containing 1% bovine serum albumin, and re-plated on glass-bottom dishes coated with fibronectin (from human plasma, Sigma #F0895, 25 μg/ml in phosphate-buffered saline for ≥1 h 37 °C).
Cell Motility
Cell motility was monitored in wound-healing assays. Cells were grown to confluence on glass-bottom dishes coated with collagen (type I from rat tail, Interchim #207050357, 120 μg/ml in H2O for ≥1 h 37 °C), the monolayer was wounded with a tip, and the medium was changed to MEM with 2% fetal bovine serum.
FRET Imaging
Cells were grown and imaged on 35-mm glass-bottom dishes (MatTek) coated with collagen or fibronectin (see above). Cells were imaged in MEM medium without phenol red. For the initial characterization of the Pakabi and Pakabix probes (Figs. 1B and 2B), cells were imaged on an Olympus IX71 inverted microscope equipped with a flat-field imaging spectrograph as previously described (25). After background subtraction, the peak intensities of CFP and YFP were used to calculate the YFP/CFP FRET ratio. For all the other experiments, cells were imaged on a Leica DMIRE2 inverted microscope, equipped with an HCX PL APO 63× oil immersion lens, motorized stage, CoolSNAP HQ2 camera (Roper Scientific), filter wheels (Ludl Electronic Products), “Box” heated chamber and “Brick” CO2 controller (Life Imaging Services), under the control of MetaMorph software (Universal Imaging). For dual-emission ratio imaging, we used a D440/20× excitation filter, a 455DCLP dichroic mirror, and the two D485/40m (CFP) and D535/30m (YFP) emission filters (Chroma, Filter Set #71007a). RFP acquisitions were obtained with the Leica Y3 cube. Cells were illuminated with a 103-watt mercury lamp (Osram) through a 5% transmission neutral density (ND) filter. The exposure time was 0.05–0.2 s with a camera binning of 4 × 4. The imaging processing was performed using MetaMorph and ImageJ. For one-time point acquisition experiments, the background-subtracted images were thresholded to define the whole cell surface, then the mean cell fluorescence intensities (CFP, YFP and, in some cases, RFP) were measured and the values were exported to Excel spreadsheets for mathematical treatment and statistics calculations. For time-lapse videos, acquisitions were every 30 s during COS-7 spreading and every 10 min during NRK motility assays. Background-subtracted CFP images were thresholded to create a time-course binary mask with a value of 0 outside the cell and a value of 1 inside the cell (20). After multiplication of CFP and YFP images by this mask, the FRET of the biosensor is measured as the CFP/YFP ratio and represented using an eight-color scale code, as shown on the right of time-lapse figures with the upper and lower limits. The CFP/YFP ratio is used so that high ratio (red) corresponds to high PAK1 activity and low ratio (blue) to low PAK1 activity. Because the experimental conditions were kept constant, YFP/CFP ratios of Figs. 1 and 2 were directly comparable to CFP/YFP ratios of Figs. 4, 6, and 7.
FIGURE 1.
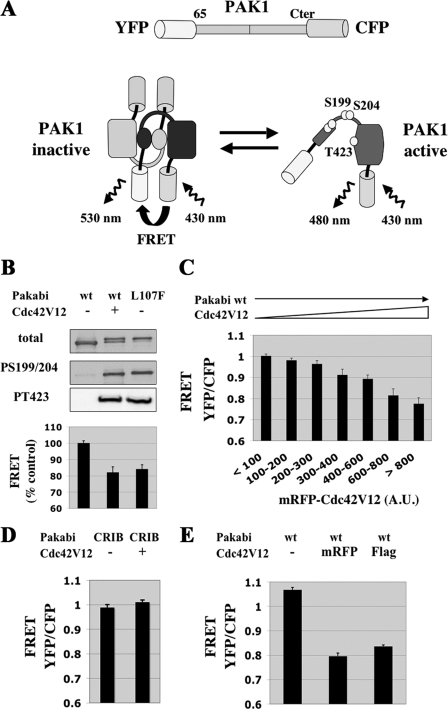
The Pakabi FRET-based biosensor for PAK1 activation. A, Pakabi design. The Pakabi biosensor is a fusion protein comprising YFP, aa 65 to the C terminus of PAK1, and CFP. In the inactive dimeric state, the proximity of the YFP and CFP fluorophores allows FRET to occur. Upon activation, the conformation of PAK1 changes dramatically, including dissociation of PAK1 dimers, thereby moving away the YFP acceptor from the CFP donor. Because the stoichiometry of YFP to CFP remains 1:1, the level of FRET is easily calculated as the ratio between YFP fluorescence (excitation 430 nm, emission 530 nm) and CFP fluorescence (excitation 430 nm, emission 480 nm). Circles represent phosphorylatable residues. B, biochemical validation of Pakabi. COS-1 cells were transfected with the indicated vectors expressing wild-type Pakabi alone, wild-type Pakabi together with Cdc42V12 or a mutated Pakabi carrying the PAK1 activating mutation L107F. Total cell lysates were analyzed by Western blotting with anti-PAK, anti-phospho-PAK1-S199/204, and anti-phospho-PAK1-T423 antibodies. In parallel, spectrographs of isolated living cells were acquired, and the peak intensities of YFP and CFP were used to calculate FRET, which is normalized to wild-type Pakabi alone taken as 100%. Bars represent standard error of the means (±S.E.). The number of cells (n) analyzed for each condition was ≥14. C, dose-response decrease of FRET for Pakabi upon activation by Cdc42. COS-7 cells were transfected with vectors expressing Pakabi and mRFP-Cdc42V12. For individual living cells, YFP, CFP, and RFP images were acquired and whole cell mean intensities were measured. The cells (n = 110) were divided into categories according to RFP intensity. Single cell FRET values were calculated as YFP/CFP ratio and averaged for each category. D, control with Pakabi unable to bind GTPases. COS-7 cells were transfected with a vector encoding CRIB-mutated Pakabi alone or together with the plasmid expressing mRFP-Cdc42V12. FRET values were measured as above; n ≥ 14 for each condition. E, control with Cdc42V12 not-fused to mRFP. COS-7 cells were transfected with vectors expressing Pakabi alone or together with mRFP-Cdc42V12 or FLAG-Cdc42V12. n ≥ 30 for each condition.
FIGURE 2.
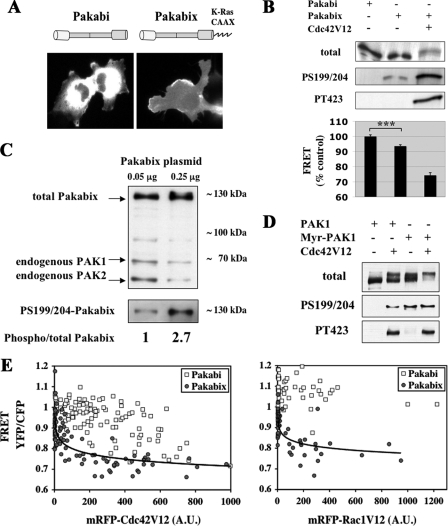
Effects of membrane recruitment on PAK1. A, cellular localization of Pakabi and Pakabix. Representative CFP images of COS-7 cells transfected with Pakabi and Pakabix are shown. B, phosphorylations and conformational changes of membrane-targeted Pakabix. Cells were transfected with vectors expressing Pakabi, Pakabix, and Cdc42V12 as indicated and analyzed as in Fig. 1B. Pakabi, n = 56; Pakabix, n = 51; Pakabix+Cdc42V12, n = 17. The difference between Pakabi and Pakabix was statistically very significant according to Student's t test (***, p < 0.0001). C, phosphorylation level of serines 199/204 is dependent on the cellular concentration of Pakabix. COS-7 cells were transfected with two different amounts of Pakabix vector (0.05 μg and 0.25 μg in 6-well dishes). Total lysates were normalized to load on the gel approximately equal amounts of Pakabix. Upper part, Western blot with anti-PAK antibody recognizing overexpressed Pakabix as well as endogenous PAK1 and PAK2. Lower part, Western blot with anti-phospho-PAK1-S199/204. Band intensities were measured with ImageJ; the ratio phosphorylated/total Pakabix was calculated for each transfection condition and normalized to the condition with the lowest amount of Pakabix plasmid transfected. D, phosphorylation of full-length PAK1, not fused to YFP/CFP. Cells were transfected with vectors expressing PAK1 (HA tagged at the C terminus) or Src-PAK1 (HA-tagged, with the myristoylation signal from v-Src at its N terminus) in the presence or absence of Cdc42V12. Total cell lysates were analyzed by Western blotting as indicated. Note the phosphorylation-dependent band shift of total PAK1. E, membrane PAK1 is hypersensitive to stimulation by Cdc42V12 and Rac1V12. COS-7 cells were transfected with vectors encoding cytosolic Pakabi or membrane-targeted Pakabix together with plasmid expressing mRFP-Cdc42V12 or mRFP-Rac1V12. For each living cell, YFP, CFP, and RFP images were acquired. The curves for Pakabix were fitted with a logarithmic function (determination coefficient R2 = 0.62 for Cdc42V12 and R2 = 0.49 for Rac1V12), whereas no acceptable fit could accommodate the Pakabi data (Microsoft Excel and the free software Lab Fit Curve Fitting). Note that the same Pakabi with Cdc42V12 data were used in the Fig. 1C.
FIGURE 4.
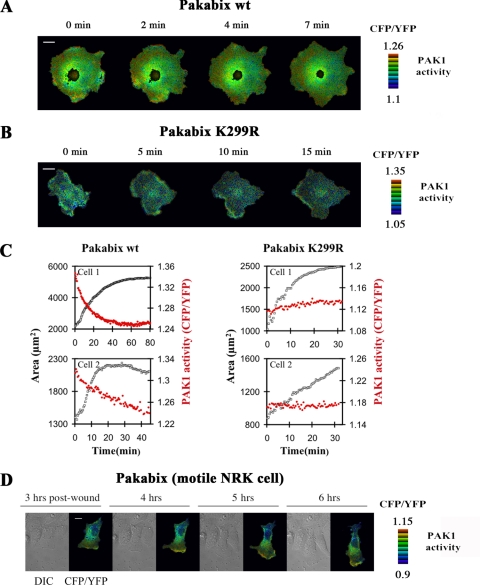
Spatiotemporal PAK1 activity during cell spreading and motility. A, a representative COS-7 cell expressing Pakabix was imaged by FRET wide-field videomicroscopy during spreading on fibronectin-coated dishes. Time 0 is the beginning of the video recording, ∼15 min after re-plating. Selected time points are shown as indicated. For the entire time-lapse video sequence, see supplemental movie 1. B, time-lapse FRET imaging of control kinase-dead mutant Pakabix K299R (see supplemental movie 2). C, whole cell areas (black squares) and whole cell FRET (red circles) measurements were plotted against the different time-points of spreading for two representative cells transfected with Pakabix or with control Pakabix K299R. D, a motile NRK cell was imaged in a wound-healing assay. Selected post-wound time points are shown (see supplemental movie 3). Scale bar, 10 μm.
FIGURE 6.
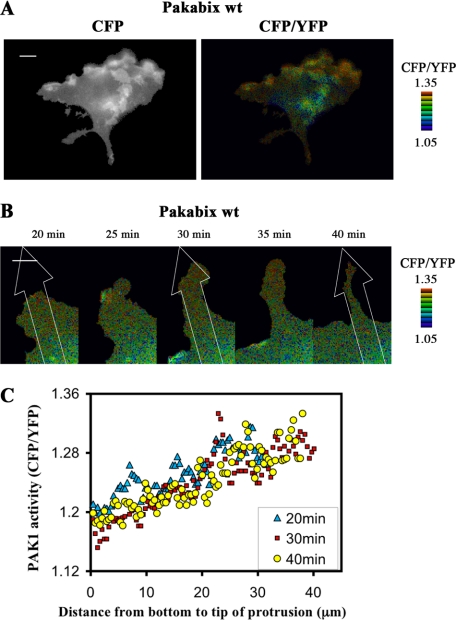
PAK1 activity at membrane ruffles and at isolated protrusions. A, selected image (10-min time point) from time-lapse FRET imaging of a Pakabix-transfected spreading cell with elevated ruffling activity (see supplemental movie 4). B, time-lapse FRET imaging of an isolated protrusion of a Pakabix-expressing cell (see supplemental movie 4). C, gradient of PAK1 activity along the protrusion. The line-scan function of MetaMorph software was used to measure FRET along strips (40 μm long and 8.2 μm wide) at three time points, as indicated in panel B. Scale bar, 10 μm.
FIGURE 7.
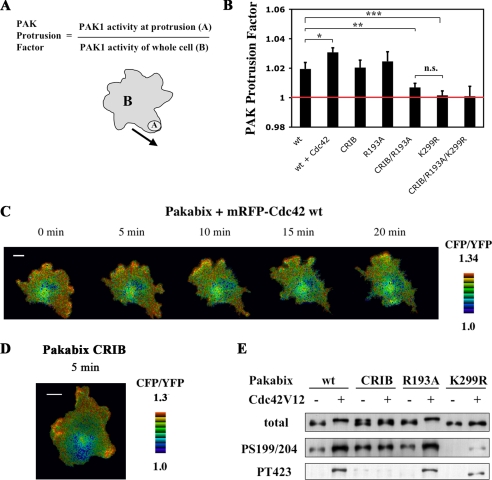
Analysis of Pakabix mutants in spreading cells. A, quantification method for local PAK1 activation via the “PAK Protrusion Factor.” The “PAK1 activity at protrusion” and the “PAK1 activity of whole cell” were measured as the CFP/YFP ratios of the region of interest “A” and of the whole cell “B”, respectively. B, the PAK protrusion factor of Pakabix wild-type was compared with those of Pakabix + Cdc42 wild-type, and of various Pakabix mutants. For each cell, one to three protrusions were analyzed; number of protrusions n ≥ 14 per condition. Bars represent ± S.E. ***, p < 0.001; **, p < 0.005; *, p = 0.064, n.s. = not significant, according to Student's t test. C, time-lapse FRET imaging of Pakabix in presence of co-expressed mRFP-Cdc42 wild-type (see supplemental movie 6). D, selected image (5-min time point) from time-lapse FRET imaging of Pakabix CRIB mutant (see supplemental movie 7). E, phosphorylation status of the Pakabix mutants. The CRIB mutant is deficient in GTPase binding; the R193A mutant is deficient in PIX binding; the K299R mutant is kinase-dead.
Immunofluorescence Staining
COS-7 cells were allowed to spread on fibronectin-coated coverslips, fixed with 4% paraformaldehyde 30 min after re-plating, and permeabilized with 0.1% Triton X-100 in phosphate-buffered saline. Saturation and incubations with antibodies were carried out in phosphate-buffered saline containing 10% fetal bovine serum. Primary antibodies were monoclonal HA.11 and anti-phospho-PAK1 (Ser-199/204, Cell Signaling #2605, dilution 1:50); secondary antibodies were Alexa 488-conjugated anti-mouse and Cy3-conjugated anti-rabbit (Jackson ImmunoResearch). Slides were mounted with Prolong Gold (Invitrogen).
RESULTS
Construction of a FRET-based Biosensor for PAK1 Activation
We developed a biosensor for PAK1 activity by fusing a YFP and a CFP at the N and C termini of PAK1, respectively (Fig. 1A). According to this strategy, the profound rearrangements of PAK1's structure upon activation should reduce the proximity between the two fluorophores and therefore decrease FRET from the donor CFP to the acceptor YFP. Constructs, including full-length PAK1, displayed a weak FRET efficiency. Reasoning that the unstructured PAK1 N-terminal tail (5) may cause an unwanted flexibility of the spatial orientation of YFP, thereby hindering efficient energy transfer, we tested various N-terminal deletions and succeeded in improving the FRET properties of the biosensor (supplemental Tables S1 and S2). The best construct in terms of FRET efficiency and dynamics, referred to as Pakabi (PAK1 activation biosensor) in the rest of this report, comprised residues 65–545 (C terminus) of PAK1. The deleted N-terminal region is not required for PAK1 dimerization (5), nor the fusion to YFP and CFP interfere with the ability of PAK1 to dimerize (data not shown). However, as consequence of the unavoidable N-terminal truncation, the binding sites for Nck and Grb2 adaptors are lost in the biosensor, which is therefore not suitable to study adaptor-dependent effects. Experiments comparing the co-expression of single YFP and CFP fusion constructs with the double-fused Pakabi showed that FRET occurs intra-molecularly; the hypothetical component due to inter-molecular FRET between the two molecules of PAK1 dimers is negligible (supplemental Table S3). This indicates that FRET changes would indeed reflect the modifications of PAK1 conformation and not dimer dissociation, even though these two events are closely linked.
The activation of Pakabi, either by co-expression with Cdc42V12 (fused to mRFP (26)) or by the constitutively activating L107F mutation, led to the expected PAK1 autophosphorylation events (as demonstrated with specific antibodies directed against phospho-serines 199/204 and phospho-threonine 423) as well as to a substantial decrease in FRET (measured as the YFP/CFP ratio), hence correlating biochemical and FRET readouts (Fig. 1B). Pakabi was an actual quantitative sensor of PAK1 activation, as shown in dose-response experiments in which the amount of the activator Cdc42V12 and level of Pakabi FRET were correlated (Fig. 1C). Control experiments further confirmed the specificity of the FRET response: a Pakabi “CRIB” mutant, in which the GTPase binding site had been altered, no longer responded to Cdc42V12 (Fig. 1D); with FLAG-Cdc42V12 the level of FRET was decreased as with mRFP-fused Cdc42V12, excluding the possibility that mRFP may act as unwanted acceptor of YFP (Fig. 1E).
In conclusion, the FRET of Pakabi is a reliable indicator of the conformational and activation status of its PAK1 kinase component. This novel tool enables us for the first time to investigate signals regulating PAK1 activity in intact living cells.
Membrane Recruitment Leads to an Intermediate Semi-open Conformation of PAK1
Independent studies have indicated that the recruitment of PAK1 to membranes stimulates its kinase activity 10- to 20-fold (15, 16), but the exact mechanism underlying this activation remains a subject of debate. We therefore addressed Pakabi to the plasma membrane by adding to its C terminus the C-terminal region and CAAX box of Ki-Ras. This novel biosensor, called Pakabix, was efficiently targeted to the plasma membrane (Fig. 2A). As expected, it displayed a lower FRET than the cytosolic Pakabi, yet the extent of this decrease was modest (6%), although highly significant (p value < 0.0001), indicating that membrane recruitment induced only a partial structural rearrangement of PAK1. Addition of Cdc42V12 led to further conformational changes of Pakabix as shown by the substantial decrease in FRET (26%) (Fig. 2B). Analysis of the phosphorylation status of PAK1 by Western blotting showed that Pakabix was partially phosphorylated on serines 199/204, but lacked phosphorylation of threonine 423 in the activation loop (Fig. 2B). Noteworthy, the degree of Ser-199/204 phosphorylation was dependent on the cellular concentration of Pakabix (Fig. 2C), suggesting that trans-phosphorylation on serine residues may result from the spatial proximity of PAK1 molecules upon recruitment to plasma membrane. We obtained the same phosphorylation pattern with a full-length PAK1 (not fused to YFP/CFP), either cytosolic or membrane-targeted (by a N-terminal myristoylation signal derived from v-Src) (Fig. 2D), thereby showing that these activation responses of the FRET probe are not an artifact due to its construction, and indeed reflect those of intact PAK.
We compared the respective sensitivities of Pakabi and Pakabix to activation by Cdc42 or Rac1 (mRFP-Cdc42V12 or mRFP-Rac1V12 fusion proteins, respectively). To this end, we plotted for each cell the expression level of Cdc42V12 or Rac1V12 (measured by RFP fluorescence) against the activation level of PAK1 (assessed by the YFP/CFP ratio of the biosensors) (Fig. 2E). This FRET-based approach allowed for the first time a direct quantitative analysis of the stimulation by Cdc42 or Rac1 of their effector PAK1 at the resolution of a single-cell. The level of Pakabi's FRET decreased only slowly with the increase of Cdc42V12 or Rac1V12 expression, typically exhibiting a high cell-to-cell variability, indicating that relatively high amounts of active GTPase were required to stimulate cytosolic PAK1. In contrast, efficient activation of Pakabix was achieved by much lower amounts of active Cdc42 or Rac1 in a narrow dynamic range of GTPase concentration. As previously observed in biochemical approaches (6, 15), Cdc42 appeared more potent than Rac1 in stimulating PAK1. In a control experiment with very high amounts of membrane-targeted mRFP alone, Pakabix FRET did not display any decrease (data not shown), excluding the possibility of unwanted energy transfer from the YFP of the biosensor to the mRFP fused to GTPases. Taken together these results support the existence at the plasma membrane of an intermediate semi-open state of PAK1, which exhibits enhanced sensitivity to stimulation by GTPases.
PAK1 Activation Is Required for Cell Spreading
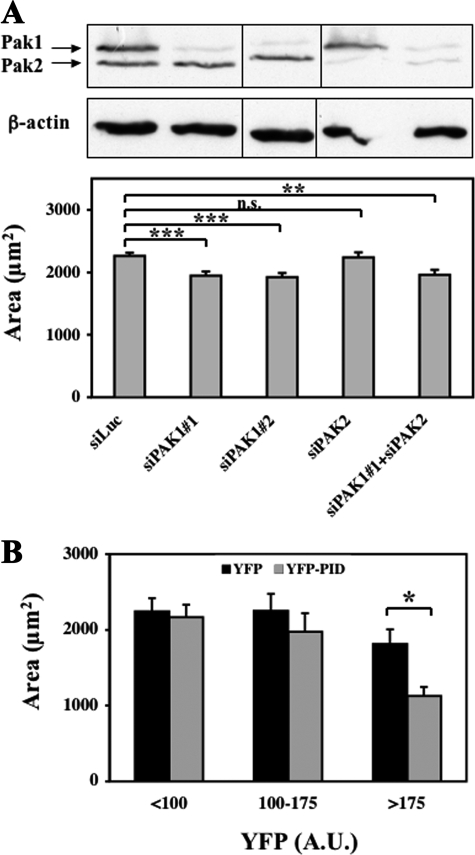
The kinase activity of PAK1 is stimulated upon cell spreading (27). To investigate the functional role of PAK1 activation during this protrusive response, we depleted PAK1 protein using an siRNA approach in HEK-HT cells, and we quantified the spreading efficiency on fibronectin-coated dishes by measuring the area of individual cells 5 h after re-plating. Cells depleted of PAK1 with two independent siRNAs displayed a clear inhibition of spreading, whereas control or PAK2-depleted cells did not (Fig. 3A). Similar results were obtained using another cell system, the RPE1 cell line (supplemental Fig. S1). Our data are consistent with previously published results showing that, in T47D breast carcinoma cells, depletion of PAK1, but not PAK2, inhibited heregulin-induced lamellipodia formation (28). PAK1 is thus required not only for protrusion formation of cancer cells, but also for that of immortalized non-transformed cells. Somehow puzzling, macrophages and fibroblasts derived from PAK1-null mice have been reported to display a faster cell spreading than wild-type cells (29, 30), confirming the complexity of the role of PAK1 in cellular morphodynamics.
FIGURE 3.
Requirement of endogenous PAK1 activity for cell spreading. A, depletion of PAK1 inhibits cell spreading. HEK-HT cells were transfected with the indicated siRNAs. Three days later, they were trypsinized, re-plated on fibronectin-coated dishes, and fixed after 5 h of spreading. Cell areas were measured with ImageJ (n ≥ 75) and statistically analyzed. Depletion of PAK1 and PAK2 was >80% according to quantification by ImageJ. B, inhibition of PAK activity inhibits cell spreading. COS-7 cells expressing YFP or the YFP-PID fusion (PAK Inhibitory Domain) were trypsinized, re-plated on fibronectin-coated dishes and analyzed 4 h later. Area and average YFP fluorescence intensity were measured for each cell in two independent experiments (YFP cells, n = 65; YFP-PID cells, n = 101). Cells were divided into three groups according to their level of YFP fluorescence: <100, 100–175, and >175 (arbitrary units). The difference between the average area of YFP cells and YFP-PID cells is statistically significant for the third group of cells expressing the highest level of PID. Bars represent ± S.E. ***, p < 0.001; **, p < 0.005; *, p < 0.01, n.s. = not significant, according to Student's t test.
In parallel, we tested the effect of inhibiting the enzymatic kinase activity of endogenous PAK1 by expressing in COS-7 cells its PID trans-inhibitory domain (aa 83–149) (31, 32). As shown in Fig. 3B, 4 h after re-plating, the cell area was significantly decreased in cells expressing high levels of YFP-PID, in comparison to cells expressing YFP alone. These results clearly pointed out an important and specific role of PAK1 activity in cell spreading.
Live Visualization of PAK1 Activation during Cell Spreading and Motility
Taking advantage of the Pakabi biosensors, we investigated the spatiotemporal dynamics of PAK1 activation during protrusion formation in spreading COS-7 cells. We could not observe any significant spatiotemporal changes in FRET with cytosolic Pakabi (data not shown), but the use of membrane-targeted Pakabix highlighted a dynamic activation of PAK1: high level of CFP/YFP ratio, i.e. PAK1 activity, were observed at the expanding cell periphery (Fig. 4A and supplemental movie 1). Note that, because we have validated in the first part of this article that FRET (YFP/CFP) decrease corresponds to PAK1 activation, in the second part we use the inverted CFP/YFP ratio as direct measure of PAK1 activity (25). Whole cell PAK1 activity was high at the beginning of spreading and decreased gradually over the time, correlating well with the kinetics of cell spreading as assessed by measuring the area of the cells (Fig. 4C). Importantly, the kinase-dead negative control Pakabix (K299R) displayed neither spatial FRET changes (Fig. 4B and supplemental movie 2) nor temporal variations of total FRET over the time (Fig. 4C).
We also investigated the spatiotemporal dynamics of PAK1 activation during another process involving dynamic protrusion formation: cell motility. Pakabix-expressing NRK cells were induced to migrate by the wound-healing method and observed by the FRET microscopy. A persistent PAK1 activation at the front lamellipodium was observed over the experimental time of 6 h. PAK1 activity appeared particularly strong at membrane ruffles and its dynamics closely followed those of the leading edge (Fig. 4D and supplemental movie 3).
For FRET imaging purposes, we always selected cells expressing low level of Pakabix, at the most 5-fold the level of endogenous PAK1, as estimated by combining Western blots and fluorescence microscopy data (not shown). The FRET response appeared to decrease at high Pakabix expression levels, suggesting that upstream signals may be limiting. In our experimental conditions, overexpression of Pakabix did not seem to alter normal cell physiology. Particularly, we compared the spreading of control cells (expressing YFP) with that of Pakabix-transfected cells, and we did not observe any difference, indicating that Pakabix expression does not perturb protrusion formation (supplemental Fig. S2).
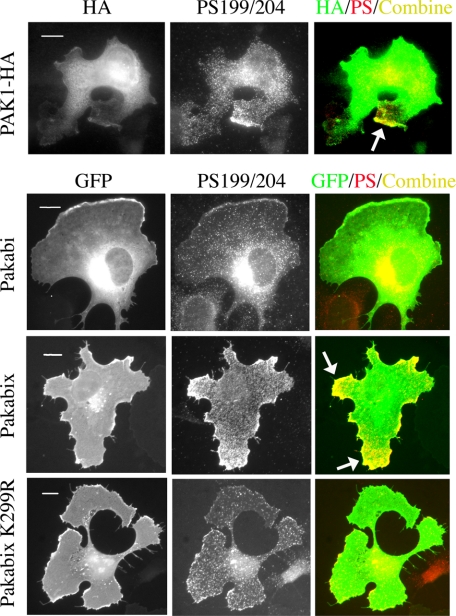
Because it was previously shown by classic immunofluorescence approaches on fixed cells that PAK1 localizes (33) and is activated at protrusions (10), we confirmed in a static manner some of our results performing immunofluorescence staining on spreading COS-7 cells: the comparison of the total PAK and phospho-PAK images showed that full-length PAK1-HA and Pakabix, but not Pakabi and Pakabix K229R (kinase-dead), were found specifically phosphorylated at protrusions (Fig. 5). Because Pakabi lacks the Nck/Grb2 binding site, we explain the lack of response of Pakabi by the fact that it cannot relocate to membrane sites during cell spreading.
FIGURE 5.
Comparison between Pakabi and Pakabix during cell spreading by immunofluorescence. COS-7 cells transfected with vectors expressing PAK1-HA, Pakabi, Pakabix, or Pakabix K299R were fixed 30 min after re-plating. PAK1-HA was stained with anti-HA antibodies, whereas Pakabi(x) were directly visualized in the green fluorescent protein (GFP) channel. Activated PAK1 was detected with anti-phospho-PAK1 (Ser-199/204) antibodies. The Color Combine function of MetaMorph was used to display the regions where the stainings for total (green) and activated PAK1 (red) co-localize (yellow). Arrows indicate protrusions with detectable phosphorylated PAK1. The perinuclear staining with anti-phospho-PAK1 is probably nonspecific because of the very high local level of PAK1. Scale bar, 10 μm.
Spatiotemporal Regulation of PAK1 at Protrusion Membranes
Because the COS-7 cell-spreading system was convenient to quickly induce and visualize dynamic membrane protrusions, we exploited this approach to investigate deeper the PAK1 regulation. Using the membrane-tagged Pakabix biosensor we focused on the activation events occurring at the specific location of protrusion membrane compartment. In cells with particularly high membrane movements, PAK1 activity was very intense at ruffling regions, as in motile NRK cells (Fig. 6A and supplemental movie 4). In cells with isolated protruding regions, we could observe a clear spatial gradient of PAK1 activity, which increased from the bottom to the tip of the protrusions (Fig. 6, B and C, and supplemental movie 5). Similarly, active Cdc42 and Rac1 are present at nascent protrusions, and their kinetics precisely coincide with cell extension and retraction (18–20). We reproduced these findings in our experimental system consisting of spreading COS-7 cells transfected with the Raichu biosensors (18) for Cdc42 (supplemental Fig.S3 and movie 6) and for Rac1 (data not shown). However, the kinetics of PAK1 activation at protrusions appeared less dynamic than those of Cdc42/Rac1: persistent high level of active PAK1 were observed at the tip of protrusions that stopped expanding or even started retracting (Fig. 6C). This indicates that, even though PAK1 activation is coupled to GTPase activation at protrusions, either PAK1 inactivation is slow or other activating signals (for example coming from adhesion sites) persistently stimulate PAK1 at recently established protrusions.
GTPases and PIX Proteins Independently Contribute to PAK1 Activation at Protrusion Membranes
We next dissected the signals activating PAK1 at the membrane of cell protrusions. To objectively compare various cells and conditions, we introduced a parameter called “PAK Protrusion Factor,” which quantifies the local increase of PAK1 activity at nascent protrusions (Fig. 7A). By this quantification method the negative control, the kinase-dead Pakabix K299R, displayed a PAK Protrusion Factor very close to 1, indicating no local PAK1 stimulation.
We started by assessing the contribution of Cdc42/Rac1 signaling. The co-expression of mRFP-Cdc42 wild-type with Pakabix strengthened the FRET signal at protruding areas (Fig. 7C and supplemental movie 7) and significantly increased the PAK Protrusion Factor (see wt versus wt + Cdc42 in Fig. 7B). However, intriguingly, a Pakabix mutated in the GTPase-interacting CRIB motif was still activated at protrusions (Fig. 7D and supplemental movie 8), and its PAK Protrusion Factor was not different from that of wild-type Pakabix (see wt versus CRIB in Fig. 7B). We concluded that other signals, besides Cdc42/Rac1, can efficiently stimulate PAK1 at membrane of cell protrusions. This result demonstrates the existence in live cells of a GTPase-independent mechanism to activate PAK1 at the membrane, as originally proposed by the biochemical work of Bokoch et al. (16).
A mutant Pakabix unable to bind PIX (R193A) was still responsive to cell spreading as wild-type Pakabix (see wt versus R193A in Fig. 7B). When the two mutations CRIB and R193A were combined, the local PAK1 activation was inhibited to a level comparable with that of the kinase-dead negative control (see wt versus CRIB/R193A in Fig. 7B). These results indicate that GTPase and PIX are the major activators of PAK1 at membrane protrusions and that they contribute independently to PAK1 stimulation.
Western blot analysis showed that wild-type Pakabix, as well as the CRIB and R193A mutants, all presented the selective phosphorylations on Ser-199/204, whereas phosphorylation at Thr-423 required binding to the GTPase, as expected (Fig. 7E). Interestingly, the kinase-dead K299R Pakabix mutant was weakly phosphorylated on both Ser-199/204 and Thr-423 upon addition of Cdc42V12, suggesting that trans-phosphorylation events, possibly by endogenous PAK molecules, may occur at the membrane, once the protection by the regulatory domain has been released by interaction with Cdc42.
DISCUSSION
In this work we provide new insights into the role of PAK1 in protrusion formation, uncovering unsuspected levels of regulation. By using the FRET-based membrane-targeted PAK1 biosensor Pakabix, we visualized the spatiotemporal dynamics of PAK1 activation in living cells, showing that PAK1 is dynamically activated at nascent protrusions during cell spreading, as well as at the front lamellipodium during directional motility.
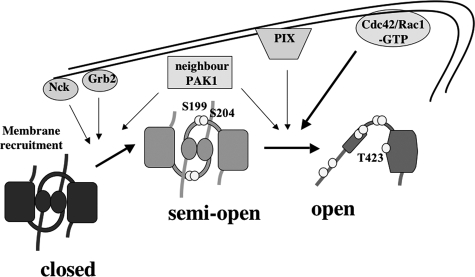
Taking our results together with the information available in the literature, we propose a multistep model for PAK1 activation at protrusions as depicted in Fig. 8. It was previously known that the PAK1 protein, which presents in the basal state a “closed” autoinhibited conformation, is translocated to the plasma membrane by interaction with the Nck/Grb2 adaptors (12, 13) and that the recruitment of PAK1 to membranes stimulates its kinase activity 10- to 20-fold (15, 16). By FRET measurements, we found that membrane recruitment of PAK1 induces a partial conformational change (Fig. 2B), which is accompanied by selective autophosphorylation events, including the phosphorylation of serines 199 and 204, but not of the crucial threonine 423 in the catalytic site. The lack of Thr-423 phosphorylation of membrane-localized, hence activated, PAK1 had not been suspected beforehand. The negative charges brought by these serine-bound phosphates in the loop connecting the inhibitory domain with the kinase domain may be responsible for the conformation adjustment leading to a “semi-open” state. Even though we did not formally prove it, we propose that PAK1 remains dimeric in the semi-open conformation: indeed, the modest FRET variation indicates that the conformation modifications are subtle, suggesting that the folding of the hydrophobic core of the IS (inhibitory switch) domain in the regulatory moiety (5) is not affected and would therefore still be able to mediate PAK1 trans-dimerization (6).
FIGURE 8.
Model for an integrated multistep activation of PAK1 kinase at nascent protrusions. Inactive PAK1 is localized in the cytosol and forms trans-inhibited dimers (closed conformation). Upon stimulation by specific signals, PAK1 is translocated to the membrane by direct interaction with Nck or Grb2. The high local concentration of PAK1 at the plasma membrane promotes the selective phosphorylation of serines 199 and 204, leading to a partial opening of the dimeric complex (semi-open conformation). Other serines (Ser-21, Ser-57, Ser-144, and Ser-149) may be phosphorylated as well. The membrane-localized semi-open PAK1 is hypersensitive to stimulation by active Cdc42 and Rac1. Full activation of membrane PAK1 with completely rearranged structural organization (open conformation) can be induced by two mechanisms: stimulation by the GTPase Cdc42/Rac1 or interaction with PIX proteins at adhesion sites. Neighbor PAK1 molecules participate to the phosphorylation in trans of N-terminal serines and of the threonine 423, which is exposed in the open state.
Binding of active Cdc42 and Rac1 was known to strongly stimulate PAK1 kinase activity (2) and to dissociate its autoinhibited dimeric state (6). Here we directly prove by the FRET approach that GTPase binding induces a complete rearrangement of PAK1, leading to a fully “open” active enzyme, with phosphorylated threonine 423 in the activation loop (Figs. 1B and 2B).
In addition, we show that the membrane-localized and semi-open PAK1 is hyper-responsive to GTPase stimulation (Fig. 2E). Two mechanisms may explain this observation: 1) the proximity of PAK1 and Cdc42/Rac1 molecules in the plane of the membrane, which could facilitate the sequential activation of several PAK1 molecules by a single active GTPase molecule; 2) an intrinsic higher affinity of the membrane-associated form of PAK1 for Cdc42/Rac1, as result of the partial conformation opening of the PAK1 structure. We are unable to validate either of these non-mutually exclusive hypotheses at this stage. Nevertheless, the existence of this semi-open PAK1 state may underlie the capacity of PAK1 to integrate two inputs: membrane-recruitment signals and stimulation by GTPases. Recruiting molecules would “prime” PAK1 for highly sensitive stimulation by Cdc42/Rac1 and local amplification of GTPase signaling; only when and where both signals are present, PAK1 stimulation is achieved, efficiently and locally.
To add another level of complexity, the dissection of upstream signals using Pakabix mutants (Fig. 7) indicated that other inputs, distinct from Cdc42/Rac1, converge to activate PAK1 at membrane protrusions. We found that one of such signals comes from PIX proteins. PIXα/β are GDP/GTP exchange factors for Cdc42/Rac1, but because the inhibitory effect of the R193A mutation (blocking PIX binding) was found in the context of Pakabix CRIB (defective in GTPase binding), we conclude that the contribution of PIX to PAK1 activation at protrusions does not depend on its GEF activity on Cdc42/Rac1. A previous biochemical study showed that αPIX could stimulate PAK1 through a GEF-independent mechanism and suggested that physical interaction with αPIX could directly enhance PAK1 activity (34). In addition, it has been reported that overexpressed GIT1, a partner of PIX, activated PAK independently of GTPases (35). Taken together these data support a mechanism in which the interaction with GIT1/PIX complexes at adhesion sites leads to PAK1 activation regardless of the local activation status of Cdc42 or Rac1. This could explain the fact that the activation of PAK1 at the tip of protrusions (Fig. 6, B and C) appeared more persistent than that of Cdc42 or Rac1 (18–20) (supplemental Fig. S3).
Another relevant component in PAK1 activation may involve phosphorylation in trans by other PAK1 molecules, as suggested by two observations. First, the level of Ser199/204 phosphorylation increased with the Pakabix expression level (Fig. 2C), indicating that the proximity of PAK1 molecules in the bi-dimensional plane of the plasma membrane may be sufficient to trigger the first transition of PAK1 activation, from the closed to a semi-open state. Second, upon Cdc42V12 overexpression, kinase-dead Pakabix was found phosphorylated, presumably by endogenous PAK molecules (Fig. 7E). In support of the relevance of neighboring PAK1 molecules, in vitro experiments showed a concentration-dependent autoactivation mechanism of PAK (35), and a recent NMR study reported that the active form of PAK1 can weakly self-associate, via a different binding interface than the inactive form, thereby promoting trans-phosphorylation events (36).
In conclusion, the simplistic view of an on/off regulation of PAK1 needs to be replaced with a model taking into account the likely existence of a multiplicity of intermediate states, which allow the integration by PAK1 of the highly dynamic balance of several distinct incoming signals.
Supplementary Material
Acknowledgments
We thank Dianqing Lu for providing the expression vector for YFP-PID (pCMV-YFP-PAK1-aa 83–149), Chris Counter for HEK-HT cells, Nathalie Brandon for technical assistance in plasmid preparation, Carlo Lucchesi for help in statistical analysis, and Kazuhiro Aoki for helpful discussions and critical reading of the manuscript.
This work was supported in part by Grants 3131 and 4845 from the Association pour la Recherche sur la Cancer (ARC), Grants ANR05BLAN033802 and ANR08-BLAN-0290-01 from the Agence Nationale de la Recherche, and by the Association Christelle Bouillot (to J. C.).

The on-line version of this article (available at http://www.jbc.org) contains supplemental Figs. S1–S3, Tables S1–S3, and Movies 1–8.
- PAK
- p21-activated kinase
- PID
- PAK inhibitory domain
- FRET
- Förster or fluorescence resonance energy transfer
- aa
- amino acid(s)
- YFP
- yellow fluorescent protein
- CFP
- cyan fluorescent protein
- RFP
- red fluorescent protein
- mRFP
- monomeric RFP
- CRIB
- Cdc42/Rac interactive binding
- siRNA
- small interference RNA
- NRK
- normal rat kidney
- MEM
- minimal essential medium
- wt
- wild type.
REFERENCES
- 1.Hofmann C., Shepelev M., Chernoff J. (2004) J. Cell. Sci. 117, 4343–4354 [DOI] [PubMed] [Google Scholar]
- 2.Bokoch G. M. (2003) Annu. Rev. Biochem. 72, 743–781 [DOI] [PubMed] [Google Scholar]
- 3.Kumar R., Gururaj A. E., Barnes C. J. (2006) Nat. Rev. Cancer. 6, 459–471 [DOI] [PubMed] [Google Scholar]
- 4.Zhao Z. S., Manser E. (2005) Biochem. J. 386, 201–214 [DOI] [PMC free article] [PubMed] [Google Scholar]
- 5.Lei M., Lu W., Meng W., Parrini M. C., Eck M. J., Mayer B. J., Harrison S. C. (2000) Cell 102, 387–397 [DOI] [PubMed] [Google Scholar]
- 6.Parrini M. C., Lei M., Harrison S. C., Mayer B. J. (2002) Mol. Cell. 9, 73–83 [DOI] [PubMed] [Google Scholar]
- 7.Chong C., Tan L., Lim L., Manser E. (2001) J. Biol. Chem. 276, 17347–17353 [DOI] [PubMed] [Google Scholar]
- 8.Zenke F. T., King C. C., Bohl B. P., Bokoch G. M. (1999) J. Biol. Chem. 274, 32565–32573 [DOI] [PubMed] [Google Scholar]
- 9.Vadlamudi R. K., Li F., Barnes C. J., Bagheri-Yarmand R., Kumar R. (2004) EMBO Rep. 5, 154–160 [DOI] [PMC free article] [PubMed] [Google Scholar]
- 10.Sells M. A., Pfaff A., Chernoff J. (2000) J. Cell. Biol. 151, 1449–1458 [DOI] [PMC free article] [PubMed] [Google Scholar]
- 11.Delorme V., Machacek M., DerMardirossian C., Anderson K. L., Wittmann T., Hanein D., Waterman-Storer C., Danuser G., Bokoch G. M. (2007) Dev. Cell 13, 646–662 [DOI] [PMC free article] [PubMed] [Google Scholar]
- 12.Buday L., Wunderlich L., Tamás P. (2002) Cell. Signal. 14, 723–731 [DOI] [PubMed] [Google Scholar]
- 13.Puto L. A., Pestonjamasp K., King C. C., Bokoch G. M. (2003) J. Biol. Chem. 278, 9388–9393 [DOI] [PubMed] [Google Scholar]
- 14.Zhao Z. S., Manser E., Loo T. H., Lim L. (2000) Mol. Cell. Biol. 20, 6354–6363 [DOI] [PMC free article] [PubMed] [Google Scholar]
- 15.Lu W., Katz S., Gupta R., Mayer B. J. (1997) Curr. Biol. 7, 85–94 [DOI] [PubMed] [Google Scholar]
- 16.Bokoch G. M., Reilly A. M., Daniels R. H., King C. C., Olivera A., Spiegel S., Knaus U. G. (1998) J. Biol. Chem. 273, 8137–8144 [DOI] [PubMed] [Google Scholar]
- 17.Lu W., Mayer B. J. (1999) Oncogene 18, 797–806 [DOI] [PubMed] [Google Scholar]
- 18.Itoh R. E., Kurokawa K., Ohba Y., Yoshizaki H., Mochizuki N., Matsuda M. (2002) Mol. Cell. Biol. 22, 6582–6591 [DOI] [PMC free article] [PubMed] [Google Scholar]
- 19.Kurokawa K., Itoh R. E., Yoshizaki H., Nakamura Y. O., Matsuda M. (2004) Mol. Biol. Cell. 15, 1003–1010 [DOI] [PMC free article] [PubMed] [Google Scholar]
- 20.Nalbant P., Hodgson L., Kraynov V., Toutchkine A., Hahn K. M. (2004) Science 305, 1615–1619 [DOI] [PubMed] [Google Scholar]
- 21.Parrini M. C., Matsuda M., de Gunzburg J. (2005) Biochem. Soc. Trans. 33, 646–648 [DOI] [PubMed] [Google Scholar]
- 22.Mochizuki N., Yamashita S., Kurokawa K., Ohba Y., Nagai T., Miyawaki A., Matsuda M. (2001) Nature 411, 1065–1068 [DOI] [PubMed] [Google Scholar]
- 23.Nagai T., Ibata K., Park E. S., Kubota M., Mikoshiba K., Miyawaki A. (2002) Nat. Biotechnol. 20, 87–90 [DOI] [PubMed] [Google Scholar]
- 24.Aoki K., Nakamura T., Fujikawa K., Matsuda M. (2005) Mol. Biol. Cell. 16, 2207–2217 [DOI] [PMC free article] [PubMed] [Google Scholar]
- 25.Terai K., Matsuda M. (2005) EMBO. Rep. 6, 251–255 [DOI] [PMC free article] [PubMed] [Google Scholar]
- 26.Campbell R. E., Tour O., Palmer A. E., Steinbach P. A., Baird G. S., Zacharias D. A., Tsien R. Y. (2002) Proc. Natl. Acad. Sci. U.S.A. 99, 7877–7882 [DOI] [PMC free article] [PubMed] [Google Scholar]
- 27.Price L. S., Leng J., Schwartz M. A., Bokoch G. M. (1998) Mol. Biol. Cell. 9, 1863–1871 [DOI] [PMC free article] [PubMed] [Google Scholar]
- 28.Coniglio S. J., Zavarella S., Symons M. H. (2008) Mol. Cell. Biol. 28, 4162–4172 [DOI] [PMC free article] [PubMed] [Google Scholar]
- 29.Smith S. D., Jaffer Z. M., Chernoff J., Ridley A. J. (2008) J. Cell. Sci. 121, 3729–3736 [DOI] [PMC free article] [PubMed] [Google Scholar]
- 30.ten Klooster J. P., Jaffer Z. M., Chernoff J., Hordijk P. L. (2006) J. Cell. Biol. 172, 759–769 [DOI] [PMC free article] [PubMed] [Google Scholar]
- 31.Li Z., Hannigan M., Mo Z., Liu B., Lu W., Wu Y., Smrcka A. V., Wu G., Li L., Liu M., Huang C. K., Wu D. (2003) Cell 114, 215–227 [DOI] [PubMed] [Google Scholar]
- 32.Zhao Z. S., Manser E., Chen X. Q., Chong C., Leung T., Lim L. (1998) Mol. Cell. Biol. 18, 2153–2163 [DOI] [PMC free article] [PubMed] [Google Scholar]
- 33.Dharmawardhane S., Sanders L. C., Martin S. S., Daniels R. H., Bokoch G. M. (1997) J. Cell. Biol. 138, 1265–1278 [DOI] [PMC free article] [PubMed] [Google Scholar]
- 34.Daniels R. H., Zenke F. T., Bokoch G. M. (1999) J. Biol. Chem. 274, 6047–6050 [DOI] [PubMed] [Google Scholar]
- 35.Loo T. H., Ng Y. W., Lim L., Manser E. (2004) Mol. Cell. Biol. 24, 3849–3859 [DOI] [PMC free article] [PubMed] [Google Scholar]
- 36.Pirruccello M., Sondermann H., Pelton J. G., Pellicena P., Hoelz A., Chernoff J., Wemmer D. E., Kuriyan J. (2006) J. Mol. Biol. 361, 312–326 [DOI] [PubMed] [Google Scholar]
Associated Data
This section collects any data citations, data availability statements, or supplementary materials included in this article.


