Abstract
Cyclosporin A (CsA) is an immunosuppressant that inhibits protein phosphatase 2B (PP2B/calcineurin) and is associated with hyperlipidemia, decreased cholesterol efflux via ATP-binding cassette transporter A1 (ABCA1), and increased risk of atherosclerosis. Apolipoprotein E (apoE) is an important regulator of lipid metabolism and atherosclerosis, the secretion of which from human macrophages is regulated by the serine/threonine protein kinase A (PKA) and intracellular calcium (Ca2+) (Kockx, M., Guo, D. L., Huby, T., Lesnik, P., Kay, J., Sabaretnam, T., Jary, E., Hill, M., Gaus, K., Chapman, J., Stow, J. L., Jessup, W., and Kritharides, L. (2007) Circ. Res. 101, 607–616). As PP2B is Ca2+-dependent and has been linked to PKA-dependent processes, we investigated whether CsA modulated apoE secretion. CsA dose- and time-dependently inhibited secretion of apoE from primary human macrophages and from Chinese hamster ovary cells stably transfected with human apoE and increased cellular apoE levels without affecting apoE mRNA. [35S]Met kinetic modeling studies showed that CsA inhibited both secretion and degradation of apoE, increasing the half-life of cellular apoE 2-fold. CsA also inhibited secretion from primary human Tangier disease macrophages and from mouse macrophages deficient in ABCA1, indicating that the effect is independent of the known inhibition of ABCA1 by CsA. The role of PP2B in mediating apoE secretion was confirmed using additional peptide and chemical inhibitors of PP2B. Importantly, kinetic modeling, live-cell imaging, and confocal microscopy all indicated that CsA inhibited apoE secretion by mechanisms quite distinct from those of PKA inhibition, most likely inducing accumulation of apoE in the endoplasmic reticulum compartment. Taken together, these results establish a novel mechanism for the pro-atherosclerotic effects of CsA, and establish for the first time a role for PP2B in regulating the intracellular transport and secretion of apoE.
Cyclosporin A (CsA)2 is a commonly administered immunosuppressant drug used in organ transplant recipients and in patients with autoimmune disorders. Its immunosuppressive activity is mediated by inhibition of protein phosphatase 2B (PP2B), also known as calcineurin. CsA binds to its intracellular receptor cyclophilin, and the CsA-cyclophilin complex binds PP2B and inhibits its activity. This results in complete inhibition of the translocation of nuclear factor of activated T cells to the nucleus, suppressing the transcription of inflammatory genes (1).
Although effective as an immunosuppressive agent, CsA has been shown to cause hyperlipidemia, hypertension, and diabetes, and long term treatment with CsA is associated with an increased risk of cardiovascular disease-related morbidity and mortality (2). The potential mechanisms underlying these adverse cardiovascular effects are diverse. CsA increases cholesteryl ester transfer protein activity, stimulates the susceptibility of low density lipoprotein (LDL) oxidation, decreases bile acid synthesis and biliary cholesterol excretion, reduces expression of the LDL receptor, hepatic 7α-hydroxylase, lipoprotein lipase activity (3–7). The ATP-binding cassette transporter 1 (ABCA1) is a critical regulator of high density lipoprotein cholesterol metabolism and of lipid clearance from foam cell macrophages (8). Recent cellular studies have shown that CsA inhibits ABCA1-mediated cholesterol efflux to apoA-I (9). This mechanism could contribute to the low high density lipoprotein concentration and increased atherosclerotic risk in these patients (9).
Apolipoprotein E (apoE) is a 34-kDa glycoprotein that is produced and secreted by many cell types such as hepatocytes, neuronal cells, and macrophages. It plays a complex role in the development and progression of atherosclerosis (10, 11), antigen presentation (11, 12), and Alzheimer disease (11, 13). As a constituent of plasma lipoproteins, apoE directs movement of lipids from the periphery to the liver, where high affinity binding of apoE to the LDL receptor, as well as binding to the LDL receptor-related protein, facilitates uptake of lipoprotein particles (14). In the vessel wall, apoE, a major secretory product of macrophages, has been shown to protect against atherosclerosis (15). The constitutive secretion of apoE from macrophages occurs via an ABCA1-dependent pathway (16, 17), whereas apoA-I-stimulated apoE secretion is ABCA1-independent (17–19). Both constitutive and apoA-I-stimulated apoE secretion require protein kinase A (PKA) activity and intracellular calcium (Ca2+) (20).
Because PP2B (calcineurin) is a Ca2+/calmodulin-dependent protein serine/threonine phosphatase that has been linked to PKA and Ca2+-dependent processes, we investigated whether inhibition of PP2B by CsA modulated apoE secretion. We demonstrate for the first time that CsA and other PP2B inhibitors markedly inhibit apoE secretion from human macrophages and that this effect does not occur via suppression of ABCA1 activity.
EXPERIMENTAL PROCEDURES
Okadaic acid, CsA, H89, and FK506 were purchased from Sigma. Heparin was purchased from Pfizer, the PP2B autoinhibitory peptide was obtained from Merck (21), and reversin 121 and verapamil were from Merck. Human apolipoprotein A-I (apoA-I), low density lipoprotein (LDL), acetylated LDL (AcLDL), and lipoprotein-deficient serum were prepared as described (22).
Isolation and Culture of Human Monocyte-derived Macrophages (HMDM), Bone Marrow-derived Macrophages (BMDM), and CHO-apoE Cells
Human monocytes were isolated from white cell concentrates of healthy donors (New South Wales Red Cross blood transfusion service, Sydney, Australia), using density gradient centrifugation after layering on Ficoll-PaqueTM Plus (Amersham Biosciences) (17). After differentiation for 6 days, the cells were enriched with cholesterol by incubation in RPMI 1640 medium (Sigma), containing 10% lipoprotein-deficient serum (v/v) and AcLDL (50 μg/ml) for 2 days (17).
Monocyte-derived macrophages with dysfunctional ABCA1 were obtained from male and female siblings with Tangier disease carrying a novel ABCA1 mutation c.4121C>T, which converts arginine 1270 into a stop codon (R1270X) (23). Monocytes were isolated as described above for healthy donors. Plasma characteristics of both patients are described in Table 1.
TABLE 1.
Plasma lipid levels in Tangier disease subjects
| Male | Female | Reference interval | |
|---|---|---|---|
| Total cholesterol (mg/dl) | 65.8 | 147.1 | 116–225 |
| LDL-cholesterol (mg/dl) | 19.4 | 112.2 | 50–90 |
| HDL-cholesterol (mg/dl) | <2 | <2 | 30–70 |
| ApoA-I (mg/dl) | <5 | <5 | 110–140 |
| Triglycerides (mg/dl) | 274.7 | 168.3 | 70–100 |
BMDMs were obtained from wild type female C57BL/6 mice and from ABCA1−/− mice using methods as described (20, 24, 25). Differentiated macrophages (5 days in culture) were cholesterol-loaded by incubation with 50 μg/ml AcLDL for 48 h and then equilibrated in medium without AcLDL but containing 22-OH cholesterol and 9-cis-retinoic acid to maximize transporter expression.
CHO-K1 cells stably expressing and secreting human apoE or apoE-GFP under a cytomegalovirus (pCMV) promoter have been described previously (20). To ascertain that the GFP tag does not interfere with apoE particle formation, media from CHO cells stably expressing apoE and apoE-GFP were subjected to sucrose density centrifugation. Both apoE and apoE-GFP were buoyant and floated at similar densities between 1.12 and 1.21 g/ml, indicating that the GFP tag does not disrupt apoE-lipoprotein formation (supplemental Fig. 1).
The human hepatoma cell line HepG2 was cultured in Dulbecco's modified Eagle's medium (Invitrogen) containing 10% fetal bovine serum, 2 mm glutamine, and 50 units/ml streptomycin and 50 μg/ml penicillin. Experiments were performed in 0.1% (w/v) BSA on 80% confluent cultures.
Inhibitor Treatments
Cells were washed twice and incubated with or without various treatments in RPMI 1640 medium containing 0.1% (w/v) BSA. After the indicated times, media were transferred to Eppendorf tubes, mixed with Complete© protease inhibitor (Roche Applied Science) and 0.02 TIU of aprotinin (Sigma), and centrifuged for 5 min at 1300 × g to remove any detached cells. The cultures were washed twice with PBS and then scraped and lysed in RIPA buffer containing Complete© protease inhibitor and 0.02 TIU of aprotinin.
Measurement of ApoE Secretion
ApoE secreted into the medium was measured by ELISA (17). In experiments using the PP2B autoinhibitory peptide, Western blot analysis was used to determine the effect on apoE secretion, as the peptide interfered with the ELISA (data not shown). Cellular apoE levels were determined by Western blot analysis (17).
Analysis of ApoE mRNA by Real Time PCR
Total RNA was isolated, and apoE mRNA levels were analyzed by quantitative RT-PCR (17).
Pulse-Chase Experiments and Metabolic Labeling of Cell Proteins with [35S]Methionine/Cysteine
Turnover of 35S-labeled apoE was performed as described (17). In brief, 35S-labeled apoE in cell lysates and medium was immunoprecipitated using a goat antibody to human apoE (Chemicon) and protein A-Sepharose (Amersham Biosciences). Immunoprecipitated 35S-labeled apoE from cell lysates and medium was separated by SDS-PAGE, and the 34-kDa band was quantified by phosphorimaging (Photostimulated Luminescence, Fujix BAS-1000) and expressed as arbitrary units of 35S-labeled apoE/mg of cell protein (17).
Immunofluorescence Microscopy
CHO cells stably expressing human apoE were cultured on glass coverslips at ∼60–70% confluency for all experiments. Cells were fixed with 4% paraformaldehyde and permeabilized with 0.1% Triton X-100 in blocking buffer (PBS containing 1% BSA).
In experiments using CHO cells expressing apoE without the GFP tag, apoE- and COP1-containing Golgi structures were visualized by incubation with monoclonal anti-apoE (Ottawa Heart Institute Research Corp.) and polyclonal rabbit anti-Giantin (Abcam), followed by secondary anti-mouse fluorescein isothiocyanate (Sigma) and anti-rabbit Cy3 conjugates (The Jackson Laboratory) in blocking buffer containing 0.1% Triton X-100 and 1% BSA in PBS. Samples were washed extensively and then mounted in a mixture of Mowiol 4-88 (Calbiochem) and glycerol, with the addition of the anti-fading agent 1,4-diazobicyclo-{2.2.2}octane (Sigma). Images were captured using an Olympus FV1000 confocal laser scanning microscope equipped with a ×60 oil immersion objective. Images from different treatment groups were captured under identical laser power, contrast, and exposure times. Co-localization analysis was performed by utilizing National Institutes of Health image software (Image J). Mander's overlap coefficients were used to calculate the degree (%) of co-localization of apoE and Golgi markers, where the co-localization coefficient (M2) quantifies the contribution of each selected channel to the area of overlap (26). Correlations and coefficients were derived from the average of 5–6 fields each containing a minimum of 10–20 cells per field under each treatment condition.
For live cell imaging, RAW264.7 macrophages were transiently transfected with apoE-GFP as described (20) and cultured on 25-mm coverslips incubated in CO2-independent media on a stage-mounted heating block warmed to 37 °C on an Olympus IX-81 OBS microscope equipped with a Plan Apo ×100 oil objective lens. Images were captured with an IMAGO Super VGA 12-bit 1280 × 1024 pixel CCD camera (T.I.L.L. Photonics, Germany). Movie frame capture rate was 0.5 s from 5 to 65 min after addition of CsA. Movies were cropped, constructed, and analyzed using ImageJ version 1.35 and Volocity version 3.6. Movies were exported as Quicktime movies with a playback speed of 10 frames per s.
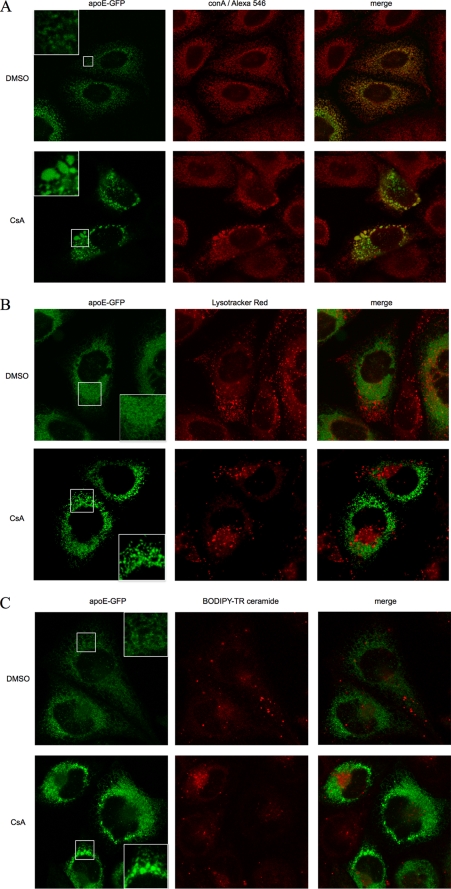
In confocal studies using CHO cells expressing apoE-GFP (Fig. 5), cells were either imaged using live cell techniques (lysosomes, Golgi) or fixed before staining (ER compartment). Lysosomes were visualized in live cells using Lysotracker Red DND-99 (Invitrogen) according to the manufacturer's instructions. Briefly, cells were supplemented with Lysotracker Red to a final concentration of 75 nm, incubated at 37 °C for 30 min, washed, and imaged immediately. Total Golgi was visualized in live cells using BODIPY-TR-conjugated ceramide (Invitrogen) complexed with defatted BSA (Sigma), in accordance with the manufacturer's recommendations. Cells were incubated with media supplemented with fluorescent ceramide-BSA complex at a final concentration of 5 μm, at 4 °C for 30 min. Cells were rinsed several times with ice-cold media and incubated for a further 30 min at 37 °C in fresh media prior to imaging. For visualization of the ER, CHO-apoE-GFP cells were fixed with 4% paraformaldehyde, permeabilized, and then incubated with biotinylated concanavalin A (Sigma), followed by a streptavidin-Alexa Fluor 546 conjugate (Invitrogen), both in permeabilization buffer. Slides were washed and mounted as described above for apoE-CHO cells. ER, lysosome, and total Golgi images were acquired using a Leica TCS SP5 confocal laser scanning microscope. For fixed cell imaging on glass slides, a ×63 oil immersion lens was used. For live cells, a ×63 water immersion lens was used, and the microscope was configured with a heated stage and objective warmer. Slides were scanned sequentially to eliminate bleed through between channels. All images were acquired using a Leica TCS SP5 confocal laser scanning microscope. False coloring, merging, and quantification of confocal images were performed using ImageJ version 1.41m (National Institutes of Health).
FIGURE 5.
CsA causes accumulation of apoE-GFP in vesicular structures within the ER network of CHO cells. CHO cells stably expressing human apoE-GFP (green) were treated with 5 μm CsA or control vehicle DMSO for 1 h and then immunostained for ER marker (biotinylated concanavalin A (conA), followed by streptavidin-Alexa Fluor 546 conjugate, A) or stained for lysosomes (Lysotracker Red DND-99, B), Golgi marker (BODIPY-TR conjugated ceramide, C), and subjected to confocal microscopy using a ×63 oil (A) or water (B and C) immersion lens. Insets in apoE-GFP panels in A–C showed magnified view of vesicular structures seen after CsA but not DMSO control. Note the strong co-localization of apoE with ER in contrast to minimal co-localization with lysosomes or Golgi both in control and CsA-treated cells. Treatment with CsA generates larger apoE-containing structures, which are heterogeneous in size, and which are excluded from the Golgi region and retained within the ER.
Measurement of PP2B Activity
PP2B activity in cell lysates was determined using a calcineurin cellular assay kit from Biomol. This assay uses an RII phosphopeptide substrate and measurement of free phosphate based on a Malachite green reaction. The kit was used according to the manufacturer's instructions.
Measurement of Cholesterol Efflux
Efflux of free cholesterol was determined as described (17). ApoA-I-specific efflux was calculated by subtracting basal efflux from apoA-I-stimulated efflux in each experiment.
Cell Viability
Cell viability (always between 85 and 100%) was routinely assessed by light microscopic morphology, by estimation of cell protein using the BCA method and by measuring leakage of lactate dehydrogenase assay into the medium (17).
Data Analysis
The degradation and secretion of cellular apoE in pulse-chase experiments were simultaneously fitted to a first-order rate equation with k1 and k2 describing the rate constants for secretion and degradation, respectively. Equation 1 was fitted to the experimental secretion and degradation data using a nonlinear least squares fitting program (Solver, Microsoft Excel).
 |
The quality of the fit was evaluated by an error function as described (17, 27). Cellular apoE was previously shown to exist in stable (Es) and mobile pools (Em) (17).
Data presented are the means ± S.D. of triplicate cultures from single experiments representative of at least 2–3 independent experiments unless otherwise stated. A significant difference between control and multiple treatment groups was assessed by analysis of variance using Dunnett's post hoc test for multiple comparisons. Comparison of pulse-chase time course experimental data were by two-way repeated measures analysis of variance with exposure to control or CsA as the between group effect. Comparisons of two groups were performed by unpaired Student's t test or Mann Whitney U test as appropriate. Cellular half-lives of [35S]methionine-labeled apoE were determined using nonlinear regression with a single phase exponential decay curve. Differences were considered significant at p < 0.05.
RESULTS
Cyclosporin A Inhibits Secretion of ApoE from Primary Human Macrophages
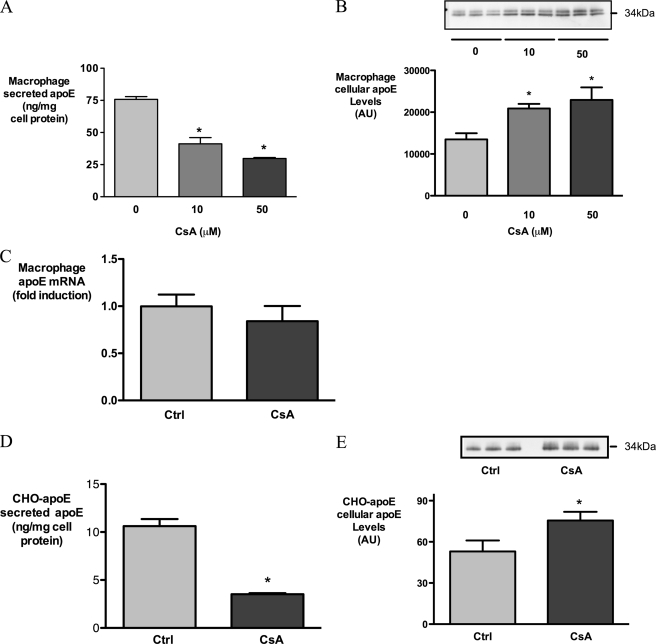
CsA dose-dependently decreased apoE secretion from HMDM (Fig. 1A). In preliminary experiments, concentrations of CsA above 50 μm were associated with cytotoxicity (data not shown), and subsequent experiments were performed using 10 μm CsA. 10 μm CsA inhibited apoE secretion by 35.4 ± 5.1% after 1 h and by 59.6 ± 7.8% after 3 h of incubation (mean ± S.D. of four independent experiments, p < 0.0001 compared with control).
FIGURE 1.
CsA inhibits secretion of apoE from HMDM and CHO-apoE cells. Human macrophages (A–C) were incubated with indicated concentrations of CsA for 3 h, and CHO-apoE cells (D and E) were treated with 5 μm CsA for 1 h. Secreted apoE (A and D), cellular apoE levels (B and E), and apoE mRNA levels (C) were determined by ELISA, Western analysis, and real time PCR, respectively. *, p < 0.05 relative to control; AU, absorbance units.
Cellular apoE protein levels were noted to be elevated after CsA exposure (Fig. 1B), whereas CsA exerted no effect on apoE mRNA levels under these conditions (Fig. 1C). To confirm that the apparent accumulation of apoE protein was not promoter-dependent, we tested the effect of CsA on CHO-K1 cells stably expressing human apoE under a cytomegalovirus promoter (CHO-apoE) (20). In CHO-apoE cells, secretion of apoE was strongly inhibited after 1 h of CsA exposure (Fig. 1D), and as was observed for HMDM, cellular apoE levels increased during this treatment (Fig. 1E). Taken together, these results in HMDM and CHO-apoE cells indicate that CsA rapidly inhibits the secretion of apoE and promotes its cellular accumulation, the latter occurring via a post-transcriptional mechanism.
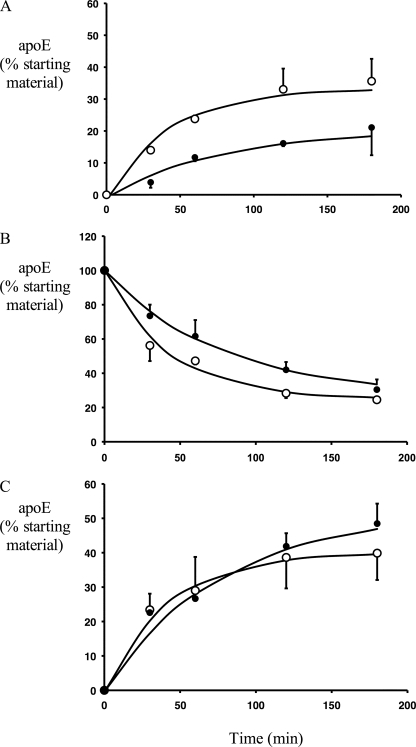
The secretion of pre-formed, 35S-labeled apoE was studied to determine the effect of CsA on apoE secretion and degradation independently of ongoing synthesis. We have previously shown that macrophage apoE exists in relatively “mobile” (Em) and “stable” (Es) pools and that the secretion and degradation of apoE can be described with a first-order rate equation (see Equation 1 under “Experimental Procedures”) with rate constants k1 and k2 for secretion and degradation, respectively (17, 20). CsA markedly inhibited secretion of 35S-labeled apoE (Fig. 2A), while concurrently increasing its intracellular half-life 2-fold from 29.4 ± 1.1 min under control conditions to 64.6 ± 1.8 min with CsA (p = 0.02 for comparison of CsA versus control, see Fig. 2B). The overall measured net degradation of apoE (determined by expressing residual cell-associated and -secreted apoE as a percent of total starting material) was not significantly different in control and CsA conditions (Fig. 2C), because of the competing effects of decreased secretion and decreased cell degradation.
FIGURE 2.
CsA inhibits apoE secretion and degradation in HMDM. HMDM were incubated in methionine/cysteine-free Dulbecco's modified Eagle's medium with 250 μCi/ml [35S]methionine/cysteine for 3 h and received a preincubation of 10 μm CsA during the last 1 h. Cells were then washed and chased in medium containing unlabeled methionine/cysteine, without (○) or with (●) 10 μm CsA. At indicated times 35S-labeled apoE was immunoprecipitated from media and cell lysates, separated by SDS-PAGE, and quantified by phosphorimaging as described under “Experimental Procedures.” A, secreted 35S-labeled apoE; B, cell-associated 35S-labeled apoE; C, net degradation of 35S-labeled apoE (calculated by subtracting residual 35S-labeled apoE in cell and media from 35S-labeled apoE in cells at T0). Data are expressed as a percentage of the total 35S-labeled apoE present at T0. Symbols represent actual experimental data, which were analyzed by two-way repeated measures analysis of variance, analyzing for effect of time and treatment. A, p < 0.01 for control versus CsA in medium; B, p < 0.01 for control versus CsA in cell; C, p = not significant for control versus CsA net degradation. Lines show fitted data according to the Equation 1.
Fitting of experimental data to the first-order rate equation demonstrated very good fit of the derived curves to the experimental data points (Fig. 2), and the goodness of fit of the model to the experimental data was well within the pre-specified error function of <0.01 for both control and CsA-exposed cells (Table 2). In the presence of CsA, the secretion rate constant k1 decreased by 63.3 ± 2.3% and the degradation rate constant k2 decreased by 30.4 ± 2.7% (Table 2) indicating that CsA inhibits both degradation and secretion of apoE. CsA did not affect the distribution of apoE between the kinetically stable (Es) and mobile pools (Em) of apoE. These results contrast with the published effects of inhibiting PKA, which increased the size of the stable pool (Es) and did not modulate the rate of degradation (k2) (20), implying that CsA and PKA inhibition act on different aspects of the apoE secretory pathway.
TABLE 2.
Summary of modeling parameters for apoE secretion and degradation
HMDM were incubated in methionine/cysteine-free Dulbecco's modified Eagle's medium with 250 μCi/ml [35S]methionine/cysteine for 3 h and received a preincubation of 10 μm CsA during the last hour. Cells were then washed and chased in medium containing unlabeled methionine/cysteine, without or with 10 μm CsA. At the indicated times 35S-labeled apoE was immunoprecipitated from media and cell lysates, separated by SDS-PAGE, and quantified by phosphorimaging as described under “Experimental Procedures.” k1 and k2 represent the secretion and degradation rate constants, respectively. Es represents the percent of cellular apoE in the stable pool; ERF represents the error function of the fit of modeling parameters to experimental data, indicating error <0.01 for both control and CsA. Modeling parameters k1, k2, and Es represent the mean ± range of two experiments. All data are expressed as percent of total 35S-labeled apoE T0. Cell t½ was calculated from experimental data (n = 4).
| Control | CsA | Fold difference | |
|---|---|---|---|
| k1 (min−1) | 0.015 ± 0.004 | 0.005 ± 0.002 | 3.0-Fold |
| k2 (min−1) | 0.018 ± 0.004 | 0.012 ± 0.003 | 1.5-Fold |
| Es (%) | 24.0 ± 0.8 | 25.1 ± 1.3 | |
| ERF | 0.0029 | 0.0016 | |
| Cell t½ (min) | 29.5 ± 1.1 | 64.6 ± 1.8a | 2.2-Fold |
ap = 0.02 for control versus CsA.
Microscopy Studies of the Effects of CsA on Cellular ApoE Distribution
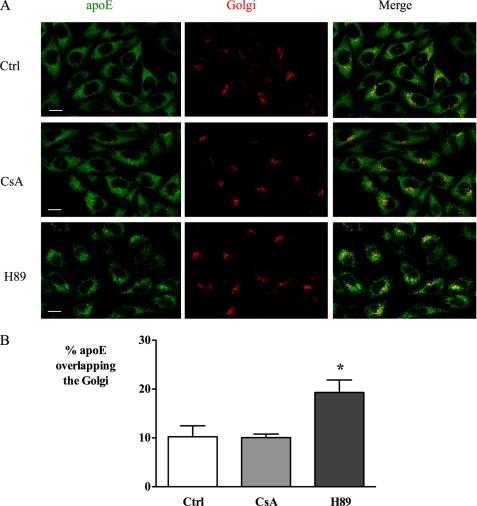
To further characterize mechanistic aspects of the inhibition of apoE secretion by CsA and compare this to the effects of PKA inhibition, the distribution of apoE was observed using immunofluorescence in CHO-apoE cells. Under control conditions, apoE was distributed in vesicles throughout the cytoplasm with enhanced perinuclear staining, as observed previously for RAW264.7 macrophages (20). Inhibition of PKA with H89 resulted in a striking contraction of apoE distribution away from the plasma membrane toward the perinuclear region, which was associated with increased apparent co-localization with the Golgi (Fig. 3). In contrast, treatment with CsA did not appear to alter apoE distribution. Mander's (M2) coefficients for co-localization with Golgi marker were 10.2 ± 2.3, 10.1 ± 0.7, and 19.3 ± 2.6 (p < 0.001) for control, CsA, and H89 conditions, respectively.
FIGURE 3.
CsA and H89 differ in their effect on the cellular distribution of apoE in CHO cells. CHO cells stably expressing human apoE were treated with 5 μm CsA or 20 μm H89 for 1 h and then immunostained for apoE (green) and Golgi marker Giantin (red). Representative images are shown in A and quantified as % co-localization of apoE and Golgi marker in B using Mander's correlation coefficient as described under “Experimental Procedures.” Note the similar perinuclear and cytoplasmic staining in control (Ctrl) and CsA-exposed cells. After H89 treatment, apoE shows a contraction of apoE away from the plasma membrane with increased perinuclear staining in merged image consistent with increased co-localization of apoE and Golgi markers. Scale bar, 10 μm. *, p < 0.05.
We have previously shown that apoE-GFP travels in vesicles along the microtubular network in transiently transfected RAW264.7 macrophages, a transport that is dramatically inhibited by PKA inhibition (20). When the effect of CsA on this vesicular pathway was assessed, we found that CsA had no effect on the movement of apoE-GFP-containing vesicles, whereas H89 clearly inhibited vesicle movement (Fig. 4; supplemental movies 1–3), further supporting the dissociation of the effects of PP2B inhibition from the effects of PKA inhibition.
FIGURE 4.
CsA does not affect trafficking of apoE-containing vesicles in RAW macrophages transiently transfected with apoE-GFP. Live cell imaging of RAW264.7 cells expressing apoE-GFP in the absence and presence of CsA, and H89 as a positive control (Ctrl). Frames were captured at 0.5 s, 5–65 min after addition of CsA or H89. Bars represent the mean distance traveled (μm/s) by 50 vesicles (mean ± S.E.) for each treatment group, *, p < 0.001 relative to control. Still images correspond to supplemental movies.
We have previously shown that apoE-GFP is secreted similarly to native apoE from stably transfected CHO cells being inhibited by H89 and stimulated by apoA-I (20), and in supporting experiments, we confirmed that apoE-GFP and apoE secreted from stably transfected CHO cells were secreted with a similar flotation density (supplemental Fig. 1). We therefore used CHO cells stably expressing apoE-GFP to further investigate the effects of CsA using a combination of live cell and fixed cell confocal microscopy (Fig. 5). As we had earlier observed for apoE, apoE-GFP was distributed throughout the CHO cell, with the exception of the cell nucleus. In the presence of CsA, apoE-GFP was seen to condense, forming a number of discrete, heterogeneously sized vesicular structures, clearly distinct from the Golgi apparatus (Fig. 5, A–C, insets). There was minimal co-localization of apoE-GFP with the lysosomal marker or Golgi marker under control conditions or after CsA. In contrast, the ER marker concanavalin A showed a very similar pattern of distribution to apoE-GFP under both conditions. Most importantly, the large vesicular structures generated by exposure to CsA showed complete co-localization with the ER marker indicating accumulation of apoE-GFP in the ER.
CsA-mediated Inhibition of ApoE Secretion is PP2B-dependent
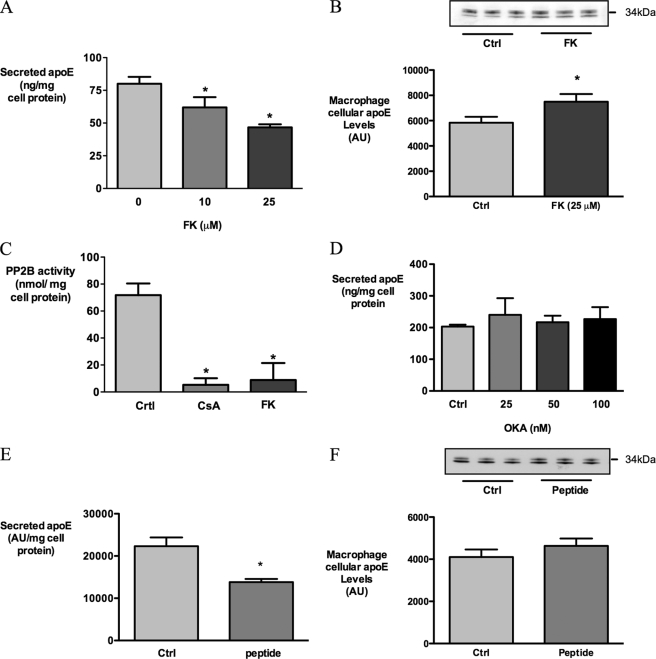
To investigate whether CsA affects secretion of apoE through inhibition of PP2B, another immunosuppressant and PP2B inhibitor, FK506 (28), was tested. Like CsA, FK506 inhibits PP2B activity indirectly by binding to an intracellular immunophilin receptor (28). FK506 also decreased the secretion of apoE in a dose-dependent manner (Fig. 6A). PP2B activity assays of macrophage cell lysates confirmed that under the experimental conditions used to inhibit apoE secretion, both CsA and FK506 inhibited PP2B activity significantly (Fig. 6B), supporting the plausibility of this mechanism. In contrast, okadaic acid, which inhibits the serine/threonine phosphatases PP1 and PP2A, did not affect apoE secretion from HMDM after 1 h (Fig. 6C) or after longer exposures (data not shown), indicating that PP2B specifically is involved in the secretion of apoE from human macrophages.
FIGURE 6.
CsA inhibits apoE secretion via inactivation of PP2B. HMDMs were incubated with indicated concentrations of FK506 for 3 h, and secreted apoE was measured by ELISA (A), cell apoE measured by Western blot (B), and PP2B activity in HMDM cell lysates after treatment with 10 μm CsA and 25 μm FK506 (C). D, apoE secreted after treatment with indicated concentrations of okadaic acid after 1 h. E and F, secreted apoE and cell apoE, respectively, by Western blot after treatment with 35 μm of PP2B autoinhibitory peptide. *, p < 0.05 relative to control (Ctrl); AU, absorbance units.
To confirm the role of PP2B in apoE secretion, a cell-permeable autoinhibitory PP2B peptide was used (28). This peptide inhibited secretion of apoE by 37.8 ± 4.9% (Fig. 6D) and concurrently decreased PP2B activity in HMDM cultures by 46 ± 17.9%. Interestingly, FK506 and PP2B had modest effects on cellular apoE levels (Fig. 6E) despite clearly inhibiting apoE secretion.
Inhibition of ApoE Secretion by CsA Is Not Mediated via ABCA1
Basal apoE secretion is at least partly ABCA1-dependent (16, 17, 19), and recent studies have demonstrated that CsA inhibits ABCA1-mediated cholesterol efflux from macrophages (9, 29). We therefore investigated whether the inhibition of apoE secretion by CsA was mediated via inhibition of ABCA1 activity, by investigating the effects of CsA in human and mouse macrophages in which ABCA1 was dysfunctional or deleted, respectively.
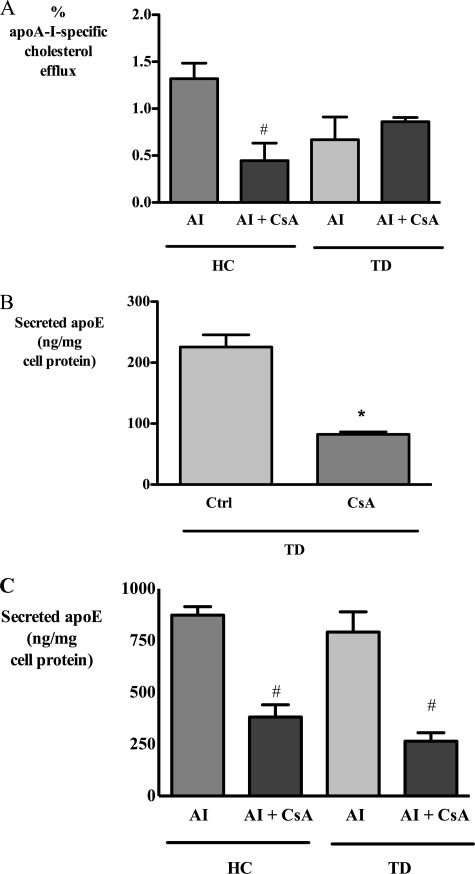
In agreement with recent reports (9, 29), we found that CsA treatment blocked cholesterol efflux to apoA-I from normal human macrophages. In monocyte-derived macrophages from a patient with genetically and phenotypically confirmed Tangier disease (TD) (see under “Experimental Procedures”), cholesterol efflux to apoA-I was significantly reduced (Fig. 7A). Treatment of TD macrophages with CsA did not reduce this efflux further, confirming that the inhibition of cholesterol efflux by CsA was ABCA1-dependent. In contrast, CsA strongly inhibited basal apoE secretion from TD-derived macrophages by 66.4 ± 0.4% (Fig. 7B) indicating that CsA could further inhibit apoE secretion even when ABCA1 cholesterol efflux activity was negligible.
FIGURE 7.
CsA inhibits basal and apoA-I-stimulated apoE secretion from human Tangier disease-derived macrophages with nonfunctional ABCA1. Healthy control (HC) and Tangier disease (TD)-derived macrophages were incubated with 10 μm CsA for 1 h and then washed and exposed to CsA with or without 25 μg/ml apoA-I (AI). After 2 h, apoA-I-specific cholesterol efflux (A) and secreted apoE under basal (B) and apoA-I-treated conditions (C) were determined as described under “Experimental Procedures.” *, p < 0.05 relative to control (Ctrl); #, p < 0.05 relative to apoA-I.
ApoA-I-stimulated apoE secretion is ABCA1-independent and occurs normally in TD macrophages (17–19). CsA markedly inhibited apoA-I-mediated apoE secretion from both control and TD macrophages, confirming the involvement of PP2B in ABCA1-independent apoE secretion (Fig. 7C).
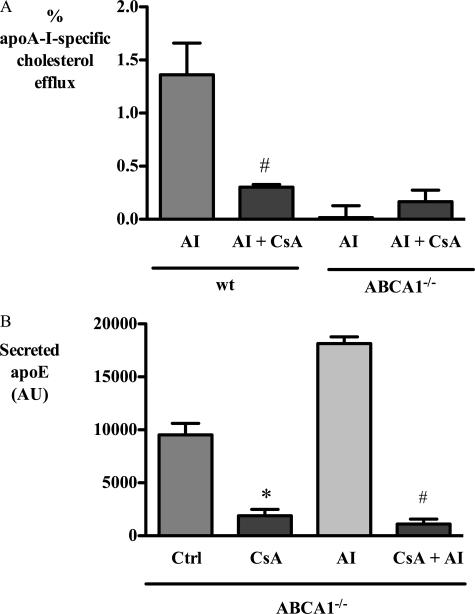
To exclude a patient-specific ABCA1 effect, the effect of CsA treatment was also tested in bone marrow-derived macrophages obtained from ABCA1 knock-out mice. CsA strongly inhibited cholesterol efflux from wild type mouse macrophages, but it had no effect on cholesterol efflux from ABCA1−/− macrophages (Fig. 8A). In contrast, CsA decreased secretion of apoE similarly in both wild type and ABCA1−/− macrophages (Fig. 8B), consistent with an ABCA1-independent effect of CsA on apoE secretion.
FIGURE 8.
CsA inhibits basal and apoA-I-stimulated apoE secretion from macrophages derived from ABCA1−/− mice. BMDM from wild type (wt) and ABCA1−/− mice were incubated with 10 μm CsA for 1 h and then washed and exposed to CsA with or without 10 μg/ml apoA-I (AI). After 3 h, apoA-I-specific cholesterol efflux (A) and secreted apoE (B) were determined as described under “Experimental Procedures.” *, p < 0.05 relative to control (Ctrl); #, p < 0.05 relative to apoA-I; AU, absorbance units.
To further clarify the relevance of this observation to lipoprotein-producing cells, we investigated HepG2 cells, which have been well characterized in relation to apoE secretion (30). CsA and H89 both significantly inhibited apoE secretion from HepG2 cells (supplemental Fig. 2), although CsA was less effective in HepG2 cells than in macrophages or CHO cells. It therefore seems likely that the relative importance of different signaling pathways used by cells designed to secrete apoE as part of a lipoprotein, such as liver cells, and cells that secrete lipid-poor apoE, such as macrophages, may differ.
As secreted apoE can bind to cell surface proteoglycans (31–33), the apparently inhibitory effect of CsA could be mediated by promotion of cell surface binding. Exposure of macrophages to heparin at concentrations previously shown to displace apoE from the macrophage surface did not overcome the inhibitory effect of CsA on apoE secretion (supplemental Fig. 3), suggesting that CsA did not promote the accumulation of heparin-releasable pools of apoE at the cell surface.
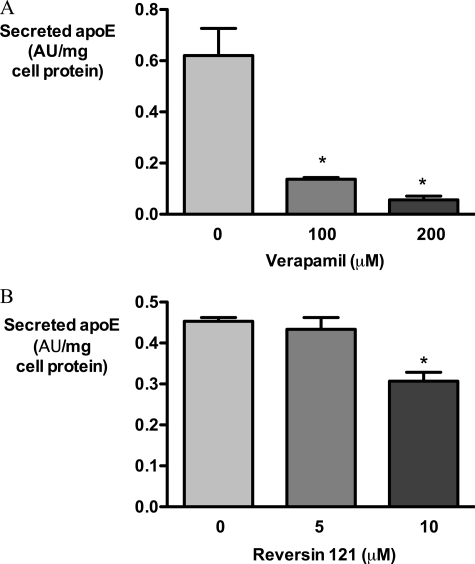
CsA has properties other than PP2B inhibition, including the inhibition of P-glycoprotein. As its effects on apoE accumulation were much more prominent than those of FK506 or PP2B inhibitory peptide, we investigated whether P-glycoprotein inhibition could contribute to the effect of CsA on apoE secretion (Fig. 9). The P-glycoprotein inhibitors verapamil and reversin 121 (34) both significantly inhibited apoE secretion from HMDM, although the effect of verapamil was much more dramatic. Unlike CsA, neither compound increased cellular apoE (data not shown).
FIGURE 9.
P-glycoprotein inhibitors verapamil and P-glycoprotein inhibit apoE secretion from HMDM. HMDM were loaded with AcLDL, washed, and treated with control medium containing DMSO, verapamil (0–200 μm), or reversin 121 (0–10 μm) in DMSO for 1 h; medium was collected, and apoE secretion was measured by ELISA. *, p < 0.01 for comparison with control; AU, absorbance units.
DISCUSSION
CsA is an immunosuppressant with widespread application in transplantation medicine, which is recognized to increase the risk of atherosclerosis. Here we show for the first time that CsA and other PP2B inhibitors inhibit secretion of apoE from macrophages. Given the important roles of apoE in atherosclerosis, antigen presentation, and Alzheimer disease, these results may have important implications for the consequences of long term immunosuppression using calcineurin inhibitors and disclose unrecognized roles for PP2B in regulating the constitutive trafficking of proteins in macrophages and other cell types.
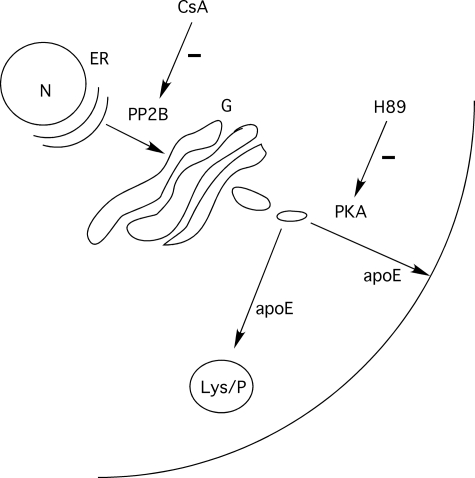
Our previous studies reported that apoE traffics within vesicular structures along the microtubule network. The movement of these vesicles is sensitive to inhibition of PKA activity and the chelation of intracellular calcium (20). Although protein phosphatases are known to regulate PKA activity in other cellular environments, our studies indicate that the sites and mechanism of action of CsA on the apoE secretory pathway are quite distinct from those of PKA inhibitor H89. First, PKA inhibition only reduced the secretion of apoE, and CsA inhibited both its secretion and degradation, doubling the half-life of cell-associated apoE. Second, inhibition of PKA profoundly inhibited movement of apoE-GFP containing vesicles, whereas CsA had no effect on this process. Third, the PKA inhibitor H89 caused the redistribution of apoE toward the center of the cell, but there was no such redistribution with CsA. Unlike H89, which we have proposed acts downstream of the lysosomal compartment, CsA must be upstream of this compartment to inhibit degradation of apoE as well as its secretion (Fig. 10). Our microscopy studies indicate that this is likely to occur at the level of the ER compartment, and not the lysosome or the Golgi.
FIGURE 10.
Proposed sites of action of PKA and PP2B in regulating apoE transport and secretion. PKA inhibition with H89 inhibits apoE secretion without affecting apoE degradation and increases the size of the stable pool of cellular apoE, most likely acting on post-Golgi vesicular transport. In contrast, inhibition of PP2B with CsA inhibits both degradation and secretion of apoE, consistent with upstream accumulation of apoE in the ER compartment.
A number of studies by other groups have identified de novo synthesis, degradation, fatty acid exposure, and cell surface binding as important determinants of the secretion of cell-derived apoE (32, 35–37). Although the observed inhibition of apoE secretion achieved by CsA could affect any number of these pathways, under the experimental conditions described in this present study, the effects of CsA are confidently post-transcriptional. Secretion-capture of secreted apoE could contribute to the effect of CsA if this were to inhibit the cell surface binding of secreted apoE. However, heparin did not block the inhibitory effect of CsA suggesting that CsA does not act by promoting binding of apoE to heparin-releasable cell surface pools (38). Although we cannot exclude a role for heparin-resistant cell surface pools, the lack of accumulation of apoE at the cell surface in our confocal studies using RAW264.7 macrophages and CHO cells makes this possibility less likely.
We have previously referred to PKA inhibition as blocking the secretion of a “committed” pool of apoE, which is inaccessible to degradation, because the apparently stable pool of apoE (Es) increases in response to such inhibition (19). As CsA does not increase the size of the stable pool and does not cause a change in cellular localization of apoE under steady state conditions, it is likely that CsA inhibits the transport of a “pre-committed” pool of apoE, which can either be degraded or secreted, and that CsA therefore acts “upstream” of PKA. It is understood that apoE is trafficked from the ER to the Golgi and trans-Golgi network, where it is glycosylated and sialylated, and thereafter transported to pools destined to be degraded or toward the plasma membrane for secretion (19, 35, 39–41). Our confocal studies with apoE-expressing CHO cells found CsA exerted a more subtle effect on cellular apoE distribution than did H89. Confocal studies with apoE-GFP-expressing CHO cells using live cell imaging techniques (which avoid fixation artifacts) and fixed cells, identified the accumulation of apoE-GFP in vesicular structures after exposure to CsA, and these co-stained with the ER marker concanavalin A. This microscopic identification is compatible with our biochemical characterization of upstream inhibition of transport by CsA (Fig. 10). The extent of the ER network in CHO cells is remarkable, and it will be important in future studies to identify subcellular targets of the effect of CsA in other cells including primary macrophages.
Our studies in primary human and murine macrophages support the observations of Le Goff et al. (9) that CsA is a potent inhibitor of ABCA1 activity in cholesterol efflux. The concentrations of CsA effective in inhibiting apoE secretion are similar to those inhibiting cholesterol efflux, but our study clearly indicates that CsA does not inhibit apoE secretion via ABCA1. As another specific PP2B inhibitory peptide also inhibited apoE secretion, it is likely that PP2B has a direct role in regulating secretion of endogenous apoE. PP2B is known to modulate the phosphorylation status and activity of inositol 1,4,5-trisphosphate receptors (42). As apoE secretion is inositol 1,4,5-trisphosphate-dependent, and intracellular calcium-dependent (20), a direct effect of PP2B on inositol 1,4,5-trisphosphate receptors may be relevant. Our preliminary data with verapamil and reversin 121 suggest that other transporters inhibited by CsA such as P-glycoprotein (43) may contribute to its effects on apoE secretion. Importantly, under these experimental conditions, neither PP2B inhibition nor P-glycoprotein inhibition appears to completely explain the inhibition of apoE degradation by CsA. CsA increased cellular apoE in HMDM and CHO cells far more than other PP2B or P-glycoprotein inhibitors, and the correlation between the extent of PP2B inhibition and inhibition of apoE secretion achieved by different inhibitors was variable.
In conclusion, we have identified a novel role for PP2B/calcineurin in regulating the secretion of apoE from macrophages, which may have important effects on the behavior of tissue macrophages. Given the potential for apoE to contribute to lipid clearance and inflammation, this process may contribute to our understanding of the pro-atherosclerotic and pro- and anti-inflammatory effects of CsA and other calcineurin inhibitors.
Supplementary Material
This work was supported by the National Health and Medical Research Council of Australia Project Grant 455251.

The on-line version of this article (available at http://www.jbc.org) contains supplemental Figs. 1–3 and Movies 1–3.
- CsA
- cyclosporin A
- ABCA1
- ATP-binding cassette transporter A1
- PKA
- protein kinase A
- PP2B
- protein phosphatase 2B
- ER
- endoplasmic reticulum
- LDL
- low density lipoprotein
- AcLDL
- acetylated LDL
- CHO
- Chinese hamster ovary
- ELISA
- enzyme-linked immunosorbent assay
- HMDM
- human monocyte-derived macrophage
- BSA
- bovine serum albumin
- PBS
- phosphate-buffered saline
- GFP
- green fluorescent protein
- BMDM
- bone marrow-derived macrophages
- TD
- Tangier disease.
REFERENCES
- 1.Ho S., Clipstone N., Timmermann L., Northrop J., Graef I., Fiorentino D., Nourse J., Crabtree G. R. (1996) Clin. Immunol. Immunopathol. 80, S40–S45 [DOI] [PubMed] [Google Scholar]
- 2.Miller L. W. (2002) Am. J. Transplant. 2, 807–818 [DOI] [PubMed] [Google Scholar]
- 3.Apanay D. C., Neylan J. F., Ragab M. S., Sgoutas D. S. (1994) Transplantation 58, 663–669 [PubMed] [Google Scholar]
- 4.Rayyes O. A., Wallmark A., Florén C. H. (1996) Hepatology 24, 613–619 [DOI] [PubMed] [Google Scholar]
- 5.Vaziri N. D., Liang K., Azad H. (2000) J. Pharmacol. Exp. Ther. 294, 778–783 [PubMed] [Google Scholar]
- 6.Princen H. M., Meijer P., Wolthers B. G., Vonk R. J., Kuipers F. (1991) Biochem. J. 275, 501–505 [DOI] [PMC free article] [PubMed] [Google Scholar]
- 7.Tory R., Sachs-Barrable K., Hill J. S., Wasan K. M. (2008) Int. J. Pharm. 358, 219–223 [DOI] [PubMed] [Google Scholar]
- 8.Oram J. F., Vaughan A. M. (2006) Circ. Res. 99, 1031–1043 [DOI] [PubMed] [Google Scholar]
- 9.Le Goff W., Peng D. Q., Settle M., Brubaker G., Morton R. E., Smith J. D. (2004) Arterioscler. Thromb. Vasc. Biol. 24, 2155–2161 [DOI] [PubMed] [Google Scholar]
- 10.Greenow K., Pearce N. J., Ramji D. P. (2005) J. Mol. Med. 83, 329–342 [DOI] [PubMed] [Google Scholar]
- 11.Mahley R. W., Rall S. C., Jr. (2000) Annu. Rev. Genomics Hum. Genet. 1, 507–537 [DOI] [PubMed] [Google Scholar]
- 12.van den Elzen P., Garg S., León L., Brigl M., Leadbetter E. A., Gumperz J. E., Dascher C. C., Cheng T. Y., Sacks F. M., Illarionov P. A., Besra G. S., Kent S. C., Moody D. B., Brenner M. B. (2005) Nature 437, 906–910 [DOI] [PubMed] [Google Scholar]
- 13.Mahley R. W., Weisgraber K. H., Huang Y. (2006) Proc Natl. Acad. Sci. U.S.A. 103, 5644–5651 [DOI] [PMC free article] [PubMed] [Google Scholar]
- 14.Mahley R. W., Ji Z. S. (1999) J. Lipid Res. 40, 1–16 [PubMed] [Google Scholar]
- 15.Linton M. F., Atkinson J. B., Fazio S. (1995) Science 267, 1034–1037 [DOI] [PubMed] [Google Scholar]
- 16.Von Eckardstein A., Langer C., Engel T., Schaukal I., Cignarella A., Reinhardt J., Lorkowski S., Li Z., Zhou X., Cullen P., Assmann G. (2001) FASEB J. 15, 1555–1561 [DOI] [PubMed] [Google Scholar]
- 17.Kockx M., Rye K. A., Gaus K., Quinn C. M., Wright J., Sloane T., Sviridov D., Fu Y., Sullivan D., Burnett J. R., Rust S., Assmann G., Anantharamaiah G. M., Palgunachari M. N., Katz S. L., Phillips M. C., Dean R. T., Jessup W., Kritharides L. (2004) J. Biol. Chem. 279, 25966–25977 [DOI] [PubMed] [Google Scholar]
- 18.Yancey P. G., Yu H., Linton M. F., Fazio S. (2007) Arterioscler. Thromb. Vasc. Biol. 27, 1123–1131 [DOI] [PubMed] [Google Scholar]
- 19.Kockx M., Jessup W., Kritharides L. (2008) Arterioscler. Thromb. Vasc. Biol. 28, 1060–1067 [DOI] [PubMed] [Google Scholar]
- 20.Kockx M., Guo D. L., Huby T., Lesnik P., Kay J., Sabaretnam T., Jary E., Hill M., Gaus K., Chapman J., Stow J. L., Jessup W., Kritharides L. (2007) Circ. Res. 101, 607–616 [DOI] [PubMed] [Google Scholar]
- 21.Terada H., Matsushita M., Lu Y. F., Shirai T., Li S. T., Tomizawa K., Moriwaki A., Nishio S., Date I., Ohmoto T., Matsui H. (2003) J. Neurochem. 87, 1145–1151 [DOI] [PubMed] [Google Scholar]
- 22.Kritharides L., Jessup W., Mander E. L., Dean R. T. (1995) Arterioscler. Thromb. Vasc. Biol. 15, 276–289 [DOI] [PubMed] [Google Scholar]
- 23.Burnett J. R., Hooper A. J., Robertson K., Ng L., Kattampallil J. S., Latchem D., Willsher P. C., Baker R. I. (2007) 89th Annual Meeting of the Endocrine Society, Toronto, Canada, June 2–5, 2007,Abstr. P3-400, Blackwell, London [Google Scholar]
- 24.Out R., Jessup W., Le Goff W., Hoekstra M., Gelissen I. C., Zhao Y., Kritharides L., Chimini G., Kuiper J., Chapman M. J., Huby T., Van Berkel T. J., Van Eck M. (2008) Circ. Res. 102, 113–120 [DOI] [PubMed] [Google Scholar]
- 25.Lesnik P., Haskell C. A., Charo I. F. (2003) J. Clin. Invest. 111, 333–340 [DOI] [PMC free article] [PubMed] [Google Scholar]
- 26.Zinchuk V., Zinchuk O., Okada T. (2007) Acta Histochem. Cytochem. 40, 101–111 [DOI] [PMC free article] [PubMed] [Google Scholar]
- 27.Gaus K., Gooding J. J., Dean R. T., Kritharides L., Jessup W. (2001) Biochemistry 40, 9363–9373 [DOI] [PubMed] [Google Scholar]
- 28.Liu J., Farmer J. D., Jr., Lane W. S., Friedman J., Weissman I., Schreiber S. L. (1991) Cell 66, 807–815 [DOI] [PubMed] [Google Scholar]
- 29.Lorenzi I., von Eckardstein A., Cavelier C., Radosavljevic S., Rohrer L. (2008) J. Mol. Med. 86, 171–183 [DOI] [PubMed] [Google Scholar]
- 30.Zannis V. I., vanderSpek J., Silverman D. (1986) J. Biol. Chem. 261, 13415–13421 [PubMed] [Google Scholar]
- 31.Zhao Y., Mazzone T. (2000) J. Biol. Chem. 275, 4759–4765 [DOI] [PubMed] [Google Scholar]
- 32.Zhao Y., Yue L., Gu D., Mazzone T. (2002) J. Biol. Chem. 277, 29477–29483 [DOI] [PubMed] [Google Scholar]
- 33.Ji Z. S., Fazio S., Lee Y. L., Mahley R. W. (1994) J. Biol. Chem. 269, 2764–2772 [PubMed] [Google Scholar]
- 34.Sharom F. J., Yu X., Lu P., Liu R., Chu J. W., Szabó K., Müller M., Hose C. D., Monks A., Váradi A., Seprôdi J., Sarkadi B. (1999) Biochem. Pharmacol. 58, 571–586 [DOI] [PubMed] [Google Scholar]
- 35.Duan H., Lin C. Y., Mazzone T. (1997) J. Biol. Chem. 272, 31156–31162 [DOI] [PubMed] [Google Scholar]
- 36.Ho Y. Y., Al-Haideri M., Mazzone T., Vogel T., Presley J. F., Sturley S. L., Deckelbaum R. J. (2000) Biochemistry 39, 4746–4754 [DOI] [PubMed] [Google Scholar]
- 37.Huang Z. H., Gu D., Mazzone T. (2004) J. Biol. Chem. 279, 29195–29201 [DOI] [PubMed] [Google Scholar]
- 38.Burgess J. W., Kiss R. S., Zheng H., Zachariah S., Marcel Y. L. (2002) J. Biol. Chem. 277, 31318–31326 [DOI] [PubMed] [Google Scholar]
- 39.Wernette-Hammond M. E., Lauer S. J., Corsini A., Walker D., Taylor J. M., Rall S. C., Jr. (1989) J. Biol. Chem. 264, 9094–9101 [PubMed] [Google Scholar]
- 40.Deng J., Rudick V., Dory L. (1995) J. Lipid Res. 36, 2129–2140 [PubMed] [Google Scholar]
- 41.Zannis V. I., McPherson J., Goldberger G., Karathanasis S. K., Breslow J. L. (1984) J. Biol. Chem. 259, 5495–5499 [PubMed] [Google Scholar]
- 42.Cameron A. M., Steiner J. P., Roskams A. J., Ali S. M., Ronnett G. V., Snyder S. H. (1995) Cell 83, 463–472 [DOI] [PubMed] [Google Scholar]
- 43.Loor F., Tiberghien F., Wenandy T., Didier A., Traber R. (2002) J. Med. Chem. 45, 4598–4612 [DOI] [PubMed] [Google Scholar]
Associated Data
This section collects any data citations, data availability statements, or supplementary materials included in this article.


