

Abstract
Hepcidin is a tightly folded 25-residue peptide hormone containing four disulfide bonds, which has been shown to act as the principal regulator of iron homeostasis in vertebrates. We used multiple techniques to demonstrate a disulfide bonding pattern for hepcidin different from that previously published. All techniques confirmed the following disulfide bond connectivity: Cys1–Cys8, Cys3–Cys6, Cys2–Cys4, and Cys5–Cys7. NMR studies reveal a new model for hepcidin that, at ambient temperatures, interconverts between two different conformations, which could be individually resolved by temperature variation. Using these methods, the solution structure of hepcidin was determined at 325 and 253 K in supercooled water. X-ray analysis of a co-crystal with Fab appeared to stabilize a hepcidin conformation similar to the high temperature NMR structure.
Regulation of iron levels is critical to the survival of species that live in an oxygen-rich environment (1). In mammals, iron homeostasis is principally regulated by hepcidin, a 25-residue peptide hormone containing a complex network of four disulfide bonds. Hepcidin was discovered by three groups investigating either novel anti-microbial peptides or iron regulation (2–4), and subsequent genetic evidence has shown that mutation of the hepcidin gene can lead to systemic iron overload or hemochromatosis (5). Similarly, mutations in upstream control proteins HFE and hemojuvelin or mutation of the gene for ferroportin, the hepcidin receptor, cause forms of hemochromatosis of varying clinical severity (6–9). Genetic studies in mice have confirmed these relationships, identifying the hepcidin pathway as a critical component in the control of iron metabolism (10–12). Dysfunction of the hepcidin pathway and the resulting iron imbalance may play a role in multiple diseases such as anemia of inflammation (13), atherosclerosis (14), and neurodegenerative disorders (15). In anemia of inflammation, suppression of hepcidin constituted a successful treatment, suggesting that it may be an appropriate therapeutic target in the treatment of disease.3
The human hepcidin gene encodes an 84-residue prepropeptide that contains a 24-residue N-terminal signal peptide that is subsequently cleaved to produce pro-hepcidin. Pro-hepcidin is then processed to produce a mature 25-amino acid hepcidin that is detectable in both blood and urine. Mass spectrometry and chemical analysis have revealed that all eight cysteines in hepcidin are involved in disulfide bonds (3) suggesting a highly constrained structure containing a precise disulfide bonding pattern.
The NMR solution structure of hepcidin first reported by Hunter et al. (16) revealed a compact fold with β-sheet and β-hairpin loop elements. From structure calculations and dynamic signatures in NMR spectra, the authors inferred a disulfide connectivity of Cys1–Cys8, Cys2–Cys7, Cys3–Cys6,4 and a rare vicinal disulfide bond at Cys4–Cys5. A later study of bass hepcidin (17) determined essentially the same fold and confirmed the same disulfide connectivity. Both studies, however, were based on incomplete NMR data because the resonances from two adjacent cysteines, Cys-13 and Cys-14 of hepcidin, were not detected, presumably due to exchange broadening.
Here we demonstrate a new pattern of disulfide connectivity obtained independently from chemical and spectroscopic analysis. In addition, we present the first complete solution NMR structure of hepcidin and x-ray structure of the peptide in complex with an anti-hepcidin Fab. NMR data obtained at different temperatures reveal that hepcidin exhibits significant conformational dynamics in solution, a problem that likely occluded previous NMR studies. Data presented here show that these dynamics can be almost completely resolved by temperature variation, yielding two distinct structures of hepcidin, one at 325 K and one at 253 K in supercooled water. In addition to inferring disulfide bonds from structure calculations, we present an argument based on probabilistic interpretation of NMR data, which unequivocally establishes the same connectivity as obtained from chemical analysis.
Because of the complexity of the disulfide network, hepcidin production is prone to misfolding artifacts. We demonstrate this through biophysical and biological activity characterization of hepcidin samples obtained from different sources. This information is essential for establishing accurate standards for quantitation of hepcidin levels in humans. In our experience, the highest quality material appeared to be critical for the structural studies presented here.
EXPERIMENTAL PROCEDURES
Purification of Urinary Human Hepcidin (uhHepc)5
Human hepcidin was isolated from the urine of sepsis patients (obtained from The Binding Site) using methods described by Park et al. (3). Briefly, ∼2 liters of frozen urine were thawed and filtered through 0.45- and 0.22-μm filters, loaded onto a 10-ml bed volume CM macroprep column (Bio-Rad), and equilibrated with PBS at a flow rate of 80 ml/h. The column was washed with PBS until the A280 of eluate was less than 0.1. Hepcidin was eluted with 5% acetic acid in water. Because the eluate contained several other peptides, the material was further purified by RP-HPLC (C18 column) using an acetonitrile gradient in 0.1% trifluoroacetic acid. Peak fractions were analyzed by mass spectrometry, and the concentration of hepcidin was determined by the trinitrobenzenesulfonic acid method (Pierce).
Expression and Purification of Recombinant Human Hepcidin in CHO Cells (chHepc)
Human hepcidin was stably expressed by transfection of AM-1/cyclin D Chinese hamster ovary cells (AM-1/D CHO) (55), using pDSRα21 (Amgen, Inc.), a pDSRα2-based vector (and described in Ref. 55), containing the scs/scs insulator elements from the Drosophila melanogaster genome. Transfection was performed using LipofectamineTM 2000 (LF2000) reagent (Invitrogen) according to the manufacturer's suggestions. Briefly, 4 × 10⁶ AM-1/D CHO cells were plated 24 h prior to transfection in 100-mm diameter plastic FalconTM Petri dishes (BD Biosciences) in 10 ml of Dulbecco's modified Eagle's medium (Invitrogen) supplemented with 5% fetal bovine serum, 1× penicillin/streptomycin, and glutamine (Invitrogen), nonessential amino acids (Invitrogen), sodium pyruvate, and sodium hypoxanthine/thymidine (HT) supplement (Invitrogen). Approximately 30 μg of each pDSRα21-human pro-hepcidin plasmid DNA was linearized using the restriction enzyme PvuI (New England Biolabs, Inc., Ipswich, MA) and diluted in 2 ml of Opti-MEM (Invitrogen). The diluted DNAs were mixed with 75 μl of LF2000 diluted in 2 ml of Opti-MEM, and the mixture was incubated for 20 min at room temperature. The DNA/LF2000 mixture was added to the cells and incubated overnight for transfection. The following day, fresh growth medium was added, and cells were cultured for 48 h at 37 °C with 5% CO2 and then plated in HT selection medium at 1:20 and 1:50 dilutions. Approximately 2 weeks after transfection, surviving cells were single cell-cloned into a 96-well plate by limiting dilution. Expression of hepcidin by the clones was determined using an anti-prohepcidin polyclonal antibody. Based on Western analysis, we expanded clone 118-34 for large scale production. Approximately 2–3 × 10⁷ cells were used to seed one Corning® CellBIND® 850-cm2 polystyrene roller bottle (Corning Glass), and cells were subsequently expanded 1:10. Each roller bottle was inoculated with 250 ml of high glucose Dulbecco's modified Eagle's medium, 10% dialyzed fetal bovine serum, 1× glutamine, 1× nonessential amino acids, and 1× sodium pyruvate (all from Invitrogen). Ten percent CO2/balance air was bubbled into the medium for 2–3 s before each roller bottle was capped. Roller bottles were incubated at 37 °C on roller racks spinning at 0.75 rpm. When the cells were ∼85–90% confluent (after ∼5–6 days in culture), the growth medium was discarded, and the cells were washed with 100 ml of PBS and 200 ml of production medium, consisting of 50% Dulbecco's modified Eagle's medium, 50% Ham's F-12, 1× glutamine, 1× nonessential amino acids, 1× sodium pyruvate (all from Invitrogen), and 1.5% dimethyl sulfoxide (Sigma). The conditioned medium containing human hepcidin was harvested every 7 days and then filtered through a 0.45/0.1-μm cellulose acetate filter (Corning Glass) onto a 10-ml bed volume CM macroprep (Bio-Rad) column and equilibrated with PBS at a flow rate of 80 ml/h. The column was washed with PBS until the A280 of the eluate was less than 0.1. Hepcidin was eluted with 5% acetic acid in water. CM fractions were assayed by analytical RP-HPLC (C4 column). chHepc 25, chHepc 24, chHepc 22, and chHepc 21 (all with N-terminal clips) were detected. The CM pool was loaded onto a semi-prep C4 Vydac column (10 × 250 mm). The fractions were collected and assayed by analytical RP-HPLC/MS. chHepc 25 fractions were pooled according to proper mass and retention time.
Expression and Purification of Recombinant Human Hepcidin in Escherichia coli (ehHepc)
Hepcidin was expressed in E. coli using the pAMG21-inducible vector (Amgen, Inc, ATCC No. 98113). 50 ml of Celtone Natural (unlabeled, Spectra Stable Isotopes) was inoculated with the E. coli strain and incubated overnight in shaker flasks at 37 °C and then centrifuged at 5000 rpm for 5 min. The cell pellet was resuspended in 100 ml of media to which a further 900 ml was added to give a total culture volume of 1 liter. This cell suspension was further incubated at 37 °C until the culture reached a density of A600 0.6–0.8, at which time expression was induced with the appropriate agent. The culture was returned to 37 °C and incubated for an additional 6 h. Cells were harvested by centrifugation. Washed inclusion bodies from the E. coli paste were solubilized with a weight to volume ratio of 1:10 in 6 m guanidine hydrochloride, 50 mm Tris-HCl, 6 mm dithiothreitol, pH 8.5, for 1 h at room temperature. The mixture was then diluted 1:25 into 2 m urea, 50 mm Tris-HCl, 160 mm arginine, 3 mm cysteine, pH 8.5, at 4 °C, with stirring for 3–4 days. This solution was clarified by 0.45 μm filtration and brought to 5 mm citrate before lowering the pH to 3.0 using concentrated HCl. A 10-fold concentration was performed with a 3-kDa molecular weight cutoff membrane and buffer exchanged with 2 m urea, 5 mm citric acid, pH 3.0. The mixture was again clarified by centrifugation and adjusted to pH 4.5 with NaOH before S-HP column loading. The column was run in 20 mm sodium acetate, 250 mm NaCl, 2 m urea, pH 4.5. A gradient up to 750 mm NaCl was run while assaying the fractions by LC-MS and pooled according to expected mass and retention time. The pro-region of the protein was enzymatically cleaved by incubation with Kex protease, achieved by addition of 3 milliunits of protease per mg of prohepcidin. The mixture was incubated for 1.5 h at room temperature in a buffer including 30 mm Tris, pH 7.0, and 5 mm CaCl2. The pool was again purified using reverse phase HPLC.
Production and Purification of Synthetic Hepcidin (shHepc)
Chemical synthesis was carried out using an ABI433 synthesizer (Applied Biosystems, Foster City, CA) employing an Nα-Fmoc/side-chain t-Bu orthogonal protection strategy with 1.0 m N,N′-dicyclohexylcarbodiimide/1-hydroxybenzotriazole hydrate (1:1) coupling chemistry in N-methylpyrrolidone and 20% (v/v) piperidine/N-methylpyrrolidone deprotection chemistry (56). Single amino acid coupling cycles at a 1-mmol scale were used for the synthesis and consisted of 58-min coupling times and 3- and 15-min Fmoc deprotection times. Fmoc-Thr(t-Bu)-Wang resin (0.12 mmol equivalent scale, Novabiochem) was used for the synthesis. The following side-chain protection strategy was used with Nα-Fmoc-protected amino acids (Novabiochem): Asp(t-Bu), Asn(Trt), Gln(Trt), Thr(t-Bu), His(Trt), Cys(Trt), Arg(2,2,4,6,7-pentamethyldihydrobenzofuran-5-sulfonyl), Ser(t-Bu), and Lys(t-butoxycarbonyl). Following on-resin chain assembly and removal of the N-terminal Fmoc group, the side-chain protected and resin-bound human hepcidin peptide derivative was washed with dichloromethane and dried. Side-chain deprotection and cleavage from the solid support was achieved by treatment with a freshly prepared mixture of trifluoroacetic acid/H2O/triisopropylsilane/3,6-dioxa-1,8-octane-dithiol (92.5:2.5:2.5:2.5, v/v) in a total volume of 20 ml with slow stirring typically for 2–3 h. The solution was filtered to remove the polymeric solid support and then evaporated. The residue was treated with ice-cold diethyl ether (50 ml), and the precipitated peptide collected by centrifugation (10 min at 2,000 rpm); the ether solution was then decanted, and the peptide was dried in vacuo.
The dried peptide was reconstituted in neat trifluoroacetic acid (2 ml) with stirring and sonication and then diluted dropwise with stirring into a fresh buffered solution (100 ml) prepared by the 1:1 combination of 6 m guanidine, pH 4.5, and 6 m guanidine, 0.5 m Tris, 20 mm EDTA, pH 8.5. Tris(2-carboxyethyl)phosphine hydrochloride (TCEP, 1 mmol) was added to the solution and stirred for 2 h. The reduced human hepcidin-containing solution was then loaded onto a Phenomenex Jupiter 10-μm 300 Å C18 250 × 21.2-mm column for preparative purification. Chromatographic separations were achieved using linear gradients of buffer B versus buffer A (A = 0.1% aqueous trifluoroacetic acid; B = acetonitrile containing 0.1% trifluoroacetic acid). The elution gradient method was 10–25% B in 15 min followed by 25–40% B in 30 min at a flow rate 20 ml/min. Fractions containing the expected molecular mass of reduced human hepcidin and <30% of any other mass detectable impurity were identified by LC/MS analysis using a Waters Acquity UPLC-LCT Premier system (Z-spray ionization coupled time-of-flight mass spectrometer with an Agilent Eclipse XDB-C18 column (2.1 × 50 mm, 1.8 μm)) and pooled. The pooled fractions were then diluted to 1 liter with water and acetonitrile to give an approximate final acetonitrile composition of 25% (v/v). Disulfide bond formation was carried out for 16–24 h in the presence of a glutathione/glutathione disulfide (GSH/GSSG) redox system (250 mg of GSSG and 127 mg of GSH) at pH 7.5 (solution adjusted with 28–30% NH4OH, Baker) with 70 rpm stirring. The progress of disulfide bond formation was monitored by analytical LC/MS. After 16–24 h folding, the human hepcidin-containing solution was then adjusted to pH 2 with neat trifluoroacetic acid, and the acetonitrile solvent component was evaporated. The crude folding solution containing human hepcidin was then loaded onto a Phenomenex Jupiter 10 μm, 300 Å, C18, 250 × 21.2-mm column for preparative purification. The elution linear gradient method was 10–25% buffer B in 15 min followed by 25–35% buffer B in 40 min at a flow rate 20 ml/min. Fractions were analyzed by LC/MS on a Waters Acquity UPLC-LCT Premier system, and fractions containing >95% human hepcidin were pooled and lyophilized. The total yield of human hepcidin was 35 mg.
Biophysical Characterization of Hepcidin from Different Sources
Several forms of hepcidin were produced by both recombinant (ehHepc and chHepc, respectively) and synthetic (shHepc) techniques. Biophysical properties of different hepcidin preparations were compared using a variety of techniques (mass spectrometry, HPLC, IRMPD-FTMS, and NMR), showing that all preparations had similar properties. All preparations of hepcidin were analyzed by high resolution MS conducted with a Bruker 7 T Fourier transform ion cyclotron resonance mass spectrometer. Samples were introduced to the mass spectrometer by electrospray ionization and mass selected with a quadrupole mass filter, before transfer into the ion cell via electrostatic ion guides. Ions were excited by a frequency sweep excitation (150 Hz/μs sweep rate) and directed in broadband mode (512 K time domain data points). The data were zero-filled once before performing a magnitude mode Fourier transform and frequency to mass conversion. The instrument was externally calibrated using a PEG-300/600 solution. NMR spectra were acquired on a Bruker DRX-600 instrument using a 5-mm TXI cryoprobe.
Disulfide Mapping by Partial Reductive Alkylation
The disulfide mapping experiments using reductive alkylation were performed as follows. Purified hepcidin (20–30 μg) was dissolved in 0.1 m citrate buffer (100 μl), pH 3.0, or 0.1% trifluoroacetic acid (100 μl), pH 2.0, and treated with 3 μl of 0.1 m TCEP. The final concentration of TCEP was 3 mm. Reduction was allowed to proceed for 8 min at 37 °C. The partially reduced hepcidin was immediately treated with 20 μl of 0.5 m NEM, followed by the addition of 30 μl of 1 m Tris buffer, pH 7.0, and 100 μl 8 m guanidinium hydrochloride. The pH of the solution was maintained below 6 to prevent disulfide rearrangement. The NEM alkylation was performed at room temperature for 20 min. The reactant was directly subjected to reversed phase HPLC using a Vydac C18 column (2.1 × 150 mm) to purify the alkylated peptides. The NEM-modified peptides were eluted with a linear gradient from 25% B to 50% B over 30 min, using 0.1% trifluoroacetic acid for solvent A and 90% acetonitrile to 0.1% trifluoroacetic acid for solvent B at a flow rate of 0.25 ml/min. NEM-derivatives were collected, dried, and analyzed by MALDI mass spectrometry after dissolving in 15 μl of 0.2% trifluoroacetic acid, 50% acetonitrile. One aliquot of the sample was loaded on to a stainless steel plate or gold plate and co-crystallized with matrix α-cyano-4 hydroxycinnamic acid. MALDI mass spectra were acquired on a Voyager DE-STR time-of-flight mass spectrometer (PerkinElmer Life Sciences) equipped with a 337-nm nitrogen laser. The measurements were made in linear mode with the accelerating voltage set typically to 25,000 V with the grid voltage at 95%, guide wire at 0.05%, and extraction delay time at 150 ns. Time-of-flight to mass conversion was achieved by external calibration using a standard of an oxidized insulin B chain (MH+ = 3496.96). From various NEM-derivatives, the 2-NEM-Cys-containing derivative was selected to determine the preferentially reduced cysteines, and the sequence analysis was performed on the further reduced sample as follows: the 2-NEM-derivative was dissolved in 20 μl of 0.05% trifluoroacetic acid and reduced with 0.5 μl of 2-mercaptoethanol at 45 °C for 20 min. The sample was directly subjected to peptide sequencing. An NEM-labeled cysteine appeared as double peaks between PTH-Pro and PTH-Met because of the isomeric forms. Both peaks were integrated for quantification of the NEM-Cys. The fractions containing 4–6 NEM-derivatives of hepcidin were combined and proteolytically digested. The dried sample was again reconstituted in 0.1 m Tris buffer, pH 6.6, and was digested with thermolysin (1 μg). The digestion was allowed to proceed overnight at 37 °C. The sample was subjected to reversed phase HPLC using a Vydac C18 column (2.1 × 150 mm). Peptides were purified with a linear gradient from 2% B to 35% B for 30 min and were finally washed with 60% B. The thermolytic peptides were dried and reconstituted in 0.2% trifluoroacetic acid, 50% acetonitrile (15 μl). One aliquot (1 μl) of the sample was loaded onto the plate and dried. Above matrix α-cyano-4 hydroxycinnamic acid was added and crystallized for MALDI mass spectrometry. The remaining samples were sequenced to determine the sites of the NEM labeling.
Intracellular Iron Retention Assay for Hepcidin Activity
In vitro biological activity of each sample was compared with hepcidin purified from the urine of sepsis patients (uhHepc) using an intracellular iron retention assay. This assay was performed in a 293Trex (Invitrogen) cell line stably expressing the β-lactamase gene downstream of the ferritin iron-response element and tetracycline-inducible ferroportin. The assay was based on an established hepcidin-responsive assay (18) but with the addition of a β-lactamase reporter gene controlled by an iron-sensitive translation control element. Intracellular iron accumulation causes increased β-lactamase expression that can be detected using standard techniques. The resulting assay yielded a highly sensitive measure of intracellular iron on live cells with the ability to normalize against cell viability. The concentrations of urinary material tested were limited by the quantity of material available. A range of activity was observed in synthetic material (EC50 between ∼40 and 200 nm). Activity of these preparations varied over time and storage conditions and was attributed to differences in the amount of aggregated material compared with active monomeric hepcidin (discussed below and in Ref. 19).
NMR Spectroscopy
The NMR samples of uhHepc were prepared by adding 5% of D2O into the aqueous solution of uhHepc obtained from the last purification step. For NMR structural studies, 1 and 3 mm solutions of chHepc in 90% H2O, 10% D2O and 99.999% D2O (Sigma) were prepared. The unadjusted pH was 3.0. At 325 K the 1 mm solutions were measured on a Bruker DRX-600 instrument equipped with TXI cryoprobe using 3- and 5-mm tubes for the H2O and D2O samples, respectively. For the supercooled samples, 3 mm solutions of chHepc were centrifuged at 15,000 rpm for 2 h, and then 10–15 μl were transferred into a 1-mm OD capillary tube. Spectra were recorded on a Bruker DRX-500 instrument equipped with a 1-mm TXI probe. For isotropic mixing, either DIPSI-2 (20) at 325 K or MOCCA-XY16 (21) at 253 K pulse sequences were used with duration times 11–100 and 50 ms, respectively. The two-dimensional TOCSY and NOESY spectra were typically acquired with acquisition times of 0.3 and 0.08 s in the direct and indirect dimensions, respectively, with total experiment times of 12 h at 325 K and 48 h at 253 K. The 13C chemical shifts of α and β carbons and their temperature dependence were measured from two-dimensional 1H-13C HSQC spectra recorded in sensitivity-enhanced mode (22) with 0.085-s acquisition times in both dimensions and total experiment time of 4–8 h. Spectral assignments were further confirmed and stereo-specific assignments obtained with the help of two-dimensional 1H-13C HMBC experiment (23) recorded with 0.14- and 0.085-s acquisition times in direct and indirect dimensions, respectively, for a total acquisition time of 28 h. The ω1-decoupled (24) TOCSY-NOESY spectra (25) were recorded with 1-ms 180° ω1-decoupling pulse and 0.38- and 0.15-s acquisition times in direct and indirect dimensions, respectively, for a total experiment time of 12 h. The H-D exchange was monitored by recording one-dimensional proton spectra after reconstitution of chHepc from H2O into D2O solutions. Water suppression was achieved by either use of gradients, presaturation pulses, or excitation sculpting. All NMR spectra were referenced externally to 2,2-dimethyl-2-silapentane-5-sulfonate sodium salt at 0.0 ppm. Temperature calibrations were performed using either methanol (low temperature) or ethylene glycol samples (high temperature). All NMR data were processed using the NMRPipe software (26). Data base analysis and curve fitting were performed with Matlab® software.
The assignment of chemical shifts correlating to the backbone and side-chain (all protons and Cα/Cβ only) resonances of chHepc were determined using standard methods from a combination of the two-dimensional NOESY, TOCSY, HSQC, and HMBC spectra. Backbone assignments for the high temperature conformation are represented by the NOESY/TOCSY trace in supplemental Fig. 1. NOE-based distance restraints were determined from NOESY spectra using the two-spin approximation. Additional NOEs were obtained from the ω1-decoupled TOCSY-NOESY experiment that provided dipolar correlations between Cys-14 and Cys-22 as well as Cys-10 and Cys-13. These restraints were incorporated manually. Stereospecific proton assignments were obtained based on the coupling patterns between C′-Hβ and Hα-Hβ evaluated from 13C-HSQC and HMBC experiments (23). Dihedral angle constraints for the χ1 angles (N-Cα-Cβ-S) were determined using the NOE patterns between Hα-Hβ and Hα-Hβ′, along with the stereospecific assignments and 3JHαHβ and 3JHαHβ′ coupling constants measured from the high resolution NOESY or TOCSY spectra. Additionally, the program TALOS (27) was used to assess the effects of changes in Cα chemical shifts on backbone torsion angles.
NMR-based Probability-based Methods for Determining Disulfide Connectivity
For the calculations of probabilities, inter-cysteine NOE data (observed as well as unobserved) were used in addition to the data in Table 1 (as obtained from the analysis of a nonredundant set of x-ray structures deposited in the Protein Data Bank) to calculate the probabilities of a given disulfide pattern. All calculations are based on the binary hypothesis test. which can be written as shown in Equation 1 (28),
 |
where O(Hi|D1, ⋯ DnX) is the odds for hypothesis Hi given the data D1, ⋯ Dn and the prior information X, O(Hi|X) is the odds for hypothesis Hi given the prior information X, P(D1, ⋯ Dn|HiX) is the probability of data occurrence given the hypothesis Hi and the prior information X, P(D1, ⋯ Dn|H̄iX) is the probability of data occurrence given the opposite hypothesis H̄i and the prior information X. In our case, X is the hepcidin sequence, and Hi corresponds to P1, P2, and P3 disulfide patterns (see supplementary Methods). Di is the distance between protons belonging to two different cysteines obtained from the NOE experiments. Please see the supplemental Methods for details on the probability calculations.
TABLE 1.
Statistical analysis of the protein data base
Only x-ray structures with resolution better than 2.5 Å, containing three plus disulfides, and unique below 70% similarity cutoff were included for the calculations (1018 structures). In the case of symmetric homodimers, only one peptide chain was included in the analysis, and interchain distances were disregarded. The dij,max for the αi–αj and for the βi–βj distances were 2.3 and 3.1 Å, respectively, as derived from the NMR data. χ1 is the dihedral angle formed by N, Cα, Cβ, and S, where looking along the Cα–Cβ bond the clockwise rotation increments the χ1 value. The ranges of allowed χ1 values were obtained from the analysis of NMR data (see supplemental Table 3). Only cysteines involved in the disulfide bonds were considered. This analysis was performed with the MATLAB® software. The vicinal disulfides were also searched in structures containing at least one disulfide bond which did not change the statistics, i.e. total of 21 vicinal disulfides, 202 disulfides with all di − dj > 3.5 Å and 0 disulfides with a given χ1 constraints.
| No. of all analyzed disulfides | 3579 |
| No. of disulfides with all di − dj > 3.5 Å | 162 |
| HαiHαj < dij,max | 258 |
| HαiHαj < dij,max and Si–Sj bond | 245 |
| HβiHβij < dij,max | 2234 |
| HβiHβj < dij,max and Si–Sj bond | 2165 |
| No. of vicinal disulfides | 16 |
| HβiHβj < dij,max and χ1,i < 60 ± 30° and χ1,j < 60 ± 30° | 50 |
| HβiHβj < dij,max and χ1,i < 60 ± 30° and χ1,j < 60 ± 30° and Si–Sj bonda | 50 |
| No. of disulfides with all di– dj > 3.5 Å and χ1,i < 60 ± 30° and χ1j < 60 ± 30° | 12 |
| No. of disulfides with all di– dj > 3.5 Å and (χ1,i < 60 ± 30° or χ1j < 60 ± 30°) | 76 |
| No. of vicinal disulfides where χ1,i < 60 ± 30° and χ1,j < 60 ± 30° | 0 |
a This denotes the case of the Cys2–Cys4 disulfide bond. Only 50 of the 3579 S–S bonds exhibited this geometry.
Structure Calculations
Calculations for both the high temperature and low temperature structures were performed in an identical manner. First, NOEs were manually assigned using standard methods. The NOE assignments and structure calculations were then carried out from extended strand starting structures using the NOEassign module of Cyana 2.1 (29, 30) and were done iteratively along with interactive assignment by the user. In each of the seven rounds of calculations, 100 structures were calculated using 50,000 steps of torsion angle dynamics. Once it was clear that the structures had begun to converge, hydrogen bond restraints were incorporated based on amides determined to be in slow exchange (obtained from 2H exchange experiments). At the final stage of calculations, disulfide bond constraints were added according to the proposed connectivity patterns. χ1 angle constraints were added based on ranges determined using the Karplus equation (31) and were incorporated with relatively loose restraints (60 ± 30°). Structures were re-calculated as above, and the 20 structures with the lowest target functions were selected for analysis. The selected structures were subjected to restrained energy minimization in the SANDER module of AMBER (32). Energy-minimized structures were then analyzed for correct geometry using PROCHECK (33). The Ramachandran statistics for all calculated structures as well as the statistics for the final structures are provided in Table 2.
TABLE 2.
Structural statistics of hepcidin determined by NMR
| NMR-derived distance restraints | High temperature | Low temperature |
|---|---|---|
| Unambiguous NOEs | 186 | 170 |
| Ambiguous NOEs | 0 | 0 |
| Sequential | 160 | 158 |
| Medium (2–4) | 3 | 5 |
| Long range (>4) | 23 | 7 |
| Total NOEs | 186 | 170 |
| Hydrogen bonds | 5 | 5 |
| Root mean square relative to mean (6-24)a | ||
| Backbone atoms | 0.39 ± 0.25 | 0.68 ± 0.27 |
| All heavy atoms | 0.86 ± 0.27 | 1.21 ± 0.24 |
| Ramachandran statistics (%)b | ||
| Most favored | 63.8 | 68.8 |
| Additionally allowed | 36.2 | 26.2 |
| Generously allowed | 0 | 5.0 |
| Disallowed | 0 | 0 |
| CYANA target function | 1.06 | 2.04 |
| Violated NOE restraints | 0 | 0 |
X-ray Crystallography
The Fab region used in these experiments was derived from an antibody that bound hepcidin with high affinity (KD = 70 pm; CI = 30–140 pm). The anti-hepcidin Fab with a C-terminal poly-His tag was expressed in E. coli and purified on a talon column followed by gel filtration with a Superdex 75 column (GE Healthcare). The sequence of the Fab was derived from a proprietary Amgen antibody. ehHepc and Fab were then concentrated to 2 and 1.8 mg/ml, respectively. The two components were mixed at a 2:1 molar ratio (ehHepc/Fab) and incubated at 4 °C overnight. The complex was further purified by gel filtration using a Superdex 200 column (GE Healthcare) using 30 mm MES, pH 6.5, and 150 mm NaCl. Once purified, the complex was concentrated to 10 mg/ml and used in setting up 96-well plate crystal screens (Hampton Research, Aliso Viejo, CA). Crystals appeared within 3 days and were further optimized. The best crystals grew from the condition of 100 mm HEPES, pH 7.5, 70–75% multiphoton dissociation at 4 °C. Crystals belong to the space group C2, with cell dimensions a = 174.3, b = 52.5, c = 66.1, and β = 99.56°. Single crystal data were collected at beamline 5.0.2 at the Advanced Light Source, Lawrence Berkeley National Laboratories. Data reduction was carried out using HKL2000. The program EPMR was used to solve the molecular replacement. A library of more than 50 different Fab structures was tested, with the best result being obtained using 8FAB as the search model. Manual model rebuilding of the Fab was done in Quanta (Accelrys) and Coot (34, 35) and refined using the software package CCP4 (36). After refinement of the Fab, it was possible to see additional electron density at the antigen-binding site. The hepcidin sequence was then fit to that density. The complex was then further refined in CCP4 to an R-factor of 20.4% and an Rfree of 25.0%. Crystallography refinement statistics can be found in supplemental Table 3.
RESULTS
Characterization of Hepcidin Preparations
Production of correctly folded, biologically active hepcidin is challenging because of the small size and highly disulfide-bonded nature of the peptide. For the current analyses several forms of hepcidin were produced by both recombinant (ehHepc and chHepc) and synthetic (shHepc) techniques. We compared in vitro biological activity of each sample to urinary material using an intracellular iron retention assay. In this assay, all synthetic and recombinant full-length preparations of hepcidin were shown to have similar biological activity to urinary hepcidin (supplemental Fig. 2). A synthetic hepcidin preparation lacking the N terminus (shHepc20) was found to be inactive in this assay as determined previously (37). Linear hepcidin (synthetically produced material lacking the ability to form disulfide bonds because of substitution of cysteine residues with 2-aminobutyric acid) was also inactive. Similarly, chemically reduced hepcidin was inactive but gradually regained activity over time, presumably because of re-oxidation (data not shown).
We used biophysical methods to assess the quality of different hepcidin preparations. The various hepcidin preparations were compared by mass spectrometry, HPLC, IRMPD-FTMS, and NMR. As expected, all hepcidin preparations had the same mass (2787.023 ± 0.003 for all preparations) and similar HPLC retention times (data not shown). IRMPD-FTMS exhibited identical spectra (supplemental Fig. 3). For structural studies, it was important to ensure the source of material used yielded properly folded and homogeneous peptide. We therefore examined different preparations of hepcidin by one-dimensional 1H NMR. Although the FTMS dissociation spectra were identical for all samples, the NMR spectra (supplemental Fig. 4) of shHepc and ehHepc indicated variable degrees of misfolding and aggregation, with shHepc having the greatest amount of aggregates and chHepc most closely matching the properties of urinary material (uhHepc).
Disulfide Bond Connectivity by Chemical Analysis
First, we sought to determine the disulfide connectivity of the major species in all hepcidin preparations using partial reduction alkylation. This technique involved sequential reduction of the disulfide bonds followed by alkylation of the free cysteines with NEM to prevent reformation of the disulfide bond and enable identification of the labeled cysteines. Alkylated cysteines were detected through a number of techniques, including protein sequencing and/or tandem mass spectrometry. Although the analysis consisted of standard protocols, its unusual complexity warrants more attention and is described below.
uhHep was partially reduced with TCEP at pH 2, resulting in the primary reduction (cleavage) of only one disulfide bond and forming two closely eluting peaks, both corresponding in molecular weight to a 2NEM-alkylated product (Fig. 1A, peaks 1 and 2). To determine the NEM-labeling sites in peaks 1 and 2, purified peptides were sequenced by Edman degradation. Detection of PTH-NEM-cysteine at position Cys5 demonstrated that this residue was reduced and alkylated. Alkylation of Cys7 was also seen, but Cys8 also appeared to be alkylated (Fig. 1B). Sequence carryover, a well known phenomenon often conferring a false-positive signal to the residue after a labeled residue (particularly in a longer sequenced product), was a significant obstacle in this analysis presumably because of the high cysteine and proline content of hepcidin. To verify the second NEM-labeling site, the sequenced sample was treated with CNBr on glass fiber filter, which specifically cleaves the peptide after methionine, and sequenced again. The results showed that Cys7 (and not Cys8) was alkylated by NEM (Fig. 1C). Thus, we concluded that Cys5 and Cys7 were the major alkylated species, and hence a Cys5–Cys7 bond had existed prior to reduction. Cys4 was completely unlabeled in peak 1, indicating that there was no Cys4–Cys5 linkage present in the major species of endogenous human hepcidin. A similar analysis was conducted on peak 2. Cys2 was clearly identified as the first NEM-alkylated site with both Cys4 and Cys5 having a significant amount of alkylated product detected (Fig. 1D). A similar analysis to that above indicated that alkylation in the Cys5 position was caused by the carryover phenomenon. These results suggest the absence of a vicinal disulfide bond between Cys4 and Cys5. If a linkage of this type were present in an endogenous hepcidin preparation, it would have to exist at a concentration too low to be detected by this method. Instead, the above data indicated that Cys5–Cys7 and Cys2–Cys4 were the major NEM-alkylated forms thereby confirming the existence of these disulfide linkages (Fig. 1E). To reduce more disulfide bonds, the sample was further treated with 3 mm TCEP at pH 3. The MALDI mass spectral analysis indicated that the major peaks in the chromatogram correspond to 4-, 6-, and 8-NEM alkylated products, respectively (Fig. 2A). The partially reduced and alkylated 4- and 6-NEM products still contained intact disulfide bonds, whereas the 8-NEM product was a fully alkylated form and hence not useful for analysis. To determine the remaining disulfides, these 4- and 6-NEM derivatives were combined and further digested with thermolysin at pH 6.6 (maintained below pH 7 to prevent disulfide rearrangement and thus allowing isolation of fragments still containing disulfide bonds, or peptides joined together by a disulfide bond) and separated by HPLC (Fig. 2B). Partially alkylated peptide fragments were identified by Edman sequencing. Cysteine pairs identified in the isolated peptide fragments, which were not NEM-labeled, were still involved in disulfide bond formation after alkylation. Peptide Th-1 showed two sequences (Fig. 2C) corresponding to IC (residues 6–7) and GMCCKT (residues 20–25). Residue 22 (Cys7) was shown to be NEM-labeled and hence was not involved in the disulfide bridge connecting both peptides. Residues 7 and 23 (Cys1 and Cys8) were both unlabeled, indicating that the linkage between the two peptides was Cys1–Cys8. Peptide Th-2 showed a single sequence (IFCCGCCHRSKC), in which residues 10, 13, and 14 (Cys2, Cys4, and Cys5) were modified with NEM and hence not connected by a disulfide. Residues 11 and 19 (Cys3 and Cys6) were detected as unmodified cysteine. Because a monomeric peptide was isolated, the possibility of an inter-peptide disulfide linkage was eliminated, and the presence of a Cys3–Cys6 disulfide bond was indicated. MALDI analysis of these peptides supported these assignments. Fig. 2D shows composite disulfide connectivity assignment generated from all NEM partial alkylation analysis, demonstrating that in human urinary hepcidin, the native disulfide connectivity is Cys1–Cys8, Cys2–Cys4, Cys3–Cys6, and Cys5–Cys7.
FIGURE 1.

Disulfide analysis of urinary hepcidin with partial reductive alkylation. A, after reduction at 37 °C for 8 min in 0.1% trifluoroacetic acid, pH 2, the reaction products were separated by reversed phase HPLC. The first broad peak (12–13 min) is a nonalkylated form of hepcidin. Both peaks 1 and 2 were major products, containing 2NEM-labeling groups. B, sequence analysis of peak 1 for determination of NEM-modified sites. Yield of PTH-NEM-Cys is indicated for all cysteines. NEM signal is detected for residues Cys5, Cys7, and Cys8. C, sequence results of peak 1 after CNBr treatment to remove the segment of the molecule that contains cysteines 1–6 (and hence lower the background) reveals that the second labeled species is Cys7. D, sequence analysis of peak 2 for determination of NEM-modified sites. NEM signal is detected for Cys2, Cys4, and Cys5. The sequences in E represent disulfide connectivities determined from either B/C and are one-dimensional.
FIGURE 2.

Direct determination of the remaining disulfides in human urinary hepcidin. A, HPLC purification of partial reduction-alkylation products (3 mm TCEP at 37 °C for 8 min in 0.1 m citrate buffer, pH 3.0). The peak eluting to the left of the 4NEM peak was determined to be intact hepcidin. Several minor peaks are seen, probably due to hydrolysis of the NEM moiety. B, HPLC purification of 4NEM and 6NEM peaks after thermolysin digestion. Remaining disulfides were kept intact until sequencing to allow identification of bonds responsible for protection from labeling. C, diagram of disulfide linkage detected in peptides Th-1 and Th-2. Black lines indicate proposed connectivity through the unlabeled cysteines. D, diagram representing overall disulfide connectivity in human urinary hepcidin determined by partial reductive-alkylation analysis.
A similar analysis was performed for chHepc, ehHepc, and shHepc. In all cases, the results were identical to those determined using uhHepc, confirming that the predominant species in all preparations exhibited the same disulfide bonding pattern as native urinary hepcidin. Because the disulfide connectivity described above disagreed with the published connectivity for synthetic human hepcidin (16), we conducted structural analyses using NMR to investigate the discrepancy.
Use of Temperature to Resolve Internal Dynamics
At ambient temperatures, interpretation of NMR spectra of hepcidin was complicated by the internal dynamics of the peptide. Some resonances, especially from amide protons of Cys4 (Cys-13) and Cys5 (Cys-14) residues were broadened to the base line because of chemical exchange. This region involved the proposed vicinal disulfide bond and was the primary region of interest. Because exchange broadening prevented sequential assignment, we attempted to improve spectral quality using temperature variation. The NMR spectra of chHepc and uhHepc were nearly identical at 325 K (supplemental Fig. 5), and the high and low temperature conditions were verified to be reversible and nondestructive to the sample. As a result, we were able to obtain full 1H assignments at both 325 and 253 K (in supercooled water) using standard two-dimensional NMR techniques (38) (supplemental Fig. 1 and supplemental Tables 1 and 2). We used proton-detected 13C-1H correlation experiments to make 13C assignments at 325 K, and 1H or 13C assignments at intermediate temperatures were obtained by closely following temperature variations of particular resonances. The 1H-13C-HSQC spectra of hepcidin recorded over a temperature range of 275–325 K revealed the presence of interesting conformational dynamics in the peptide. Across this temperature range, many resonances appeared to be in the fast and fast-intermediate chemical exchange limits. In particular, Cys-13 and Cys-14 resonances shifted according to the fast exchange limit between 325 and 305 K and completely disappeared below 305 K, where exchange rates approach the difference in chemical shifts (millisecond time scales). We attempted to quantify the dynamics of hepcidin by measuring the temperature dependence of chemical shifts for all Cα and Cβ resonances existing in the limit of fast exchange and by using a two-state model based on van't Hoff's Equation (Eq. 2) to fit the data,
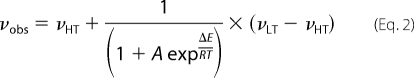 |
where νobs, νHT, and νLT are the observed, high, and low temperature chemical shifts, respectively, and ΔE is the energy difference between two states. Fig. 3A shows a nonlinear fit for Cys-19 Cα chemical shifts to Equation 2. The differences in Cα chemical shifts between the low and high temperature forms of hepcidin shown in Fig. 3B were extrapolated from fitting each cross-peak chemical shift over the temperature range measured to Equation 2. These data reveal that the most significant conformational changes occur in the loop region, primarily in the center, near the Cys-13 and Cys-14 residues. The mean energy difference obtained from all of the fits is equal to −11.2 ± 4.3 kcal/mol, which is similar to the ΔE value obtained for the Cys-19 Cα resonance. In the case of the resonances that fall into an intermediate exchange limit (Cys-13 Cα,β, Cys-14 Cα,β, and Arg-16 Cβ), only the high temperature points (and parameters obtained from fitting the Cys-19 Cα chemical shifts) were used for the extrapolation. The plot in Fig. 3C indicates that at 253 K, the low temperature conformation of hepcidin is more than 90% populated and likewise for the high temperature conformer at 325 K.
FIGURE 3.

Temperature can be used to resolve the internal dynamics of hepcidin. A, temperature dependence of Cys-19 Cα chemical shift obtained by fitting the data to Equation 2 illustrates that the behavior fits the two-state model. B, differences in chemical shifts between the low and high temperature forms of hepcidin show that the loop region is dynamic. C, population plot for the temperature dependence of the high temperature hepcidin structure.
Although recording spectra at high temperature is straightforward, shifting the peptide population to the low temperature conformer is experimentally more demanding. Cooling an aqueous solution to 253 K without freezing requires supercooling (39). This can only be achieved by substantially shrinking the volume of a highly pure sample, which is equivalent to reducing the probability of heterogeneous nucleation (40). We were able to cool aqueous solutions of hepcidin to 253 K by using 10–15-μl sample volumes and by voiding the solutions of any solid particles. Expansions of one-dimensional proton spectra of hepcidin recorded at different temperatures, from 253 K up to 325 K (Fig. 4) demonstrate a nearly complete shift of hepcidin population from a high to low temperature conformation. The Cys-14 NH resonance appears as a broadened signal at low temperatures, completely disappears into the base line at ambient temperatures, and then reappears with a significantly different chemical shift at high temperatures. This behavior is in excellent qualitative agreement with an intermediate exchange process between the two forms of hepcidin characterized by the temperature dependence of conformer populations depicted in Fig. 3C. The resolution of hepcidin dynamics by temperature allowed the first full 1H NMR assignments of hepcidin to be obtained at 325 K and at 253 K. We then used these assignments to perform further analyses of the hepcidin structure.
FIGURE 4.

Two-state dynamics of hepcidin. Expansions of one-dimensional proton NMR spectra of chHepc at different temperatures demonstrate complete transition from the low to high temperature conformation over the recorded temperature range.
Disulfide Bond Connectivity by NMR
The ability to resolve the dynamics in the loop region of hepcidin allowed the use of NMR methods to determine the disulfide connectivity in a manner independent from the chemical analysis. We show here that the observation of inter-cysteine NOEs in conjunction with knowledge of exocyclic cysteine conformations (χ1 angles) was sufficient to unequivocally establish the disulfide bonding pattern of hepcidin.
NMR studies of hepcidin (in particular high temperature two-dimensional NOESY spectra) revealed the close proximities of Cys1 and Cys8 as well as Cys3 and Cys6 as very strong (2.1 Å) NOE interactions between the corresponding Hα protons. In contrast, the β-proton resonances were highly congested, complicating the observation of Hβ-Hβ NOEs. However, in the TOCSY-NOESY relay experiment (25), the Hβ-Hβ NOE peaks appear away from the diagonal allowing unambiguous resonance assignment. We used this method to identify Cys2Hβ-Cys4Hβ and Cys5Hβ-Cys7Hβ NOE interactions in hepcidin at 325 K (Fig. 5), which indicate the close proximity of these pairs of protons. Because the possibility exists that the Cys5Hβ-Cys7Hβ relay NOE peak may have a contribution from the direct Cys5Hα-Cys7Hβ transfer, we acquired a two-dimensional TOCSY-NOESY experiment using presaturation of the Cys5Hα resonance during the 500-ms NOESY mixing time to effectively decouple this interaction and negate any contribution from this α proton to the NOE. This experiment exhibited almost the same Cys5Hβ-Cys7Hβ cross-peak intensity, confirming that the peak originates predominantly from the interaction between the Hβ protons (<3 Å). Consistent with the relay experiments, a strong NOE (∼2.7 Å) was also observed between Cys2Hβ-Cys4Hβ in two-dimensional NOESY spectra recorded at pH ∼7 and 321 K (data not shown), where the Hβ resonances are well separated. In addition, the Cys5H β-Cys7Hβ relay NOE was also observed in two-dimensional TOCSY-NOESY experiments at 291 K, where the detection of the Cys2–Cys4 relay NOE was hampered by signal overlap. At this temperature, however, the Cys2Hββ′ and Cys7Hββ′ protons were all well resolved, and no NOE interaction between Cys2 and Cys7 (previously proposed connectivity) was detected. At 253 K, inferior sensitivity of the two-dimensional TOCSY-NOESY experiment and spectral overlap prevented unambiguous observation of the above NOEs. It is therefore important to note that, through the high to ambient temperature range, we clearly observed NOE interactions between Cys1–Cys8, Cys3–Cys6, Cys2–Cys4, and Cys5–Cys7 cysteine pairs and no NOE interactions between alternative cysteine pairs.
FIGURE 5.

TOCSY-NOESY relay peaks identify inter-cysteine NOEs between Cys2-Cys4 and Cys5-Cys7. Overlay of TOCSY (green) and ω1-decoupled TOCSY-NOESY (red) showing NOE correlations between the Hβ protons of Cys2-Cys4 and Cys5-Cys7. These correlations are not resolved in traditional NOESY spectra because of their proximity to the diagonal. The asterisk denotes a folding artifact.
In addition to NOE connectivities between different cysteine pairs, we sought to determine the exocyclic conformations in cysteines forming the controversial disulfide bonds, i.e. Cys2, Cys4, Cys5, and Cys7. Based on stereospecific assignments of β protons, vicinal couplings, and NOEs between Hα and Hβ protons, we used the Karplus equation (31, 41) to determine the χ1 dihedral angles (N-Cα-Cβ-S) for Cys2, Cys4, and Cys5. These values were calculated to be 45 ± 5, 40 ± 5, and 70 ± 10°, respectively (see supplemental Table 3). The Hββ′ of Cys7 forms a strongly coupled spin system at high temperatures; thus no exocyclic conformation was determined for this residue.
The S–S bonds cannot be directly observed in NMR experiments, and using solely the observation of an NOE between two cysteines as evidence of a disulfide bond may not lead to the correct solution (42). In addition, there are a number of cases where S–S bonds do not require short (observable by NOE) interproton distances, including all known vicinal disulfides, which are pertinent to our study. For these reasons, we approached this problem in a probabilistic fashion by sampling the disulfide bond geometries of high resolution x-ray structures deposited in the Protein Data Bank. Instead of calculating statistical weights (43), we used the binary hypothesis test (28) to explicitly analyze the likelihood of a particular disulfide pattern. The Protein Data Bank analysis was performed for 1018 protein crystal structures, all having less than 70% similarity, containing three or more disulfide bonds, and having a crystallographic resolution of at least 2.5 Å. In the case of symmetric homodimers, only one peptide chain was included in the analysis, the results of which are reported in Table 1. Although there are 105 possible disulfide patterns in hepcidin only three need to be compared, denoted as P1 (Cys1–Cys8, Cys3–Cys6, Cys2–Cys4, Cys5–Cys7), P2 (Cys1–Cys8, Cys3–Cys6, Cys4–Cys5, Cys2–Cys7), and P3 (Cys1–Cys8, Cys3–Cys6, Cys2–Cys5, Cys4–Cys7). Using only NOE data, one obtains a probability of 0.9997 for the P1 pattern (current work), 0.02 for P2 (16, 17), and 0.01 for P3. Interestingly, if one adds the data for the three exocyclic group conformations of Cys2, Cys4, and Cys5, all generously constrained to 60 ± 30°, the P1 pattern appears certain, p(P1) = 1; P2 appears improbable, p(P2) = 0; and P3 pattern appears extremely unlikely, p(P3) = 0.0002 (see supplemental materials for the details of this calculation). Thus, the probabilistic interpretation of NMR data for these cysteine residues unambiguously established the disulfide pattern in hepcidin, confirmed results obtained from the chemical analyses, and paved the way for incorporating disulfide bond constraints into the structural calculations.
High and Low Temperature NMR Structures of Hepcidin
Using the data presented above, we determined the solution NMR structures of hepcidin at both the high and low temperature limit. To ensure that hepcidin was in a monomeric state during all NMR experiments, we estimated the tumbling time from the cross-relaxation rates within the frequency of the resolved methylene protons. The average values were 0.65 ns at 325 K, 1.5 ns at 293 K, and 5 ns at 253 K, all of which agree with Stokes law for the tumbling of a single molecule in aqueous solution. It is noteworthy that no inter-molecular NOEs (as in Hunter et al. (16)) were observed at either temperature. The structural ensembles for hepcidin (at both 325 K and 253 K) are shown in Fig. 6(A and B), and an overlay of the average structures of each is shown in Fig. 6, C and D. For both temperatures, the calculations resulted in well converged structures with reasonable geometry (Table 2). The secondary structural elements present in the previously proposed structure of hepcidin were maintained in both the high and low temperature structures presented here, as both exhibited well defined β-sheet and β-hairpin loop components. Inter-cysteine NOEs identified in the present work, however, were not observed in the original structural calculation (16), presumably because of the presence of exchange broadening at ambient temperatures. Without knowledge of these connectivities, the original structures proposed by Hunter et al. (16) possessed a vicinal disulfide bond between Cys-13–Cys-14 (Cys4–Cys5), resulting in a more extended structure. However, as a result of the alternate disulfide configuration determined here, the β-hairpin in the new structure is folded back on the β-sheet to a much greater degree (supplemental Fig. 6), and the loop region of the peptide appears to exhibit significant conformational dynamics across a wide temperature range, which may be driven by a pronounced re-orientation of the Cys-14–Cys-19 (Cys5–Cys7) disulfide bond (or vice versa). The average structures of hepcidin at both temperatures are similar, with the primary deviations being the conformation of the loop region, the orientation of the Cys-14–Cys-19 (Cys5–Cys7) disulfide bond and, to a lesser degree, the orientation of the C-terminal β-sheet and Cys-7–Cys-23 (Cys1–Cys8) disulfide bond (Fig. 6, C and D). The Cys-10–Cys-13 (Cys2–Cys4) S–S bond belongs to disulfides with a relatively rare geometry (see Table 1) and remains unchanged between the two conformers shown here. The most prominent structural differences found in the loop region clearly appear as the difference in Cα chemical shifts between both forms shown in Fig. 3B, where changes in the Cα chemical shifts of Cys-13 (Cys4) and Cys-14 (Cys5) were in excess of 1.5 ppm (1.8 and 3.9 ppm, respectively). Such large changes in Cα chemical shifts were predicted (using TALOS (27)) to cause significant changes in the backbone ϕ/ψ angles of these residues and agree with the observations from the structural calculations.
FIGURE 6.

Two distinct conformations of hepcidin resolved at high and low temperature. A, high temperature NMR ensembles; B, low temperature NMR ensembles. Traces represent the 20 structures with the lowest CYANA target function after energy minimization using AMBER. C, overlay of the high (red) and low (blue) temperature structures of hepcidin generated as averaged coordinates from the structural ensembles; D, alternate angle of C rotated 90° about the z axis illustrating the conformational change of the β-hairpin loop.
The lower precision of the structures at 253 K is mainly due to inherently lower sensitivity arising from the use of capillary NMR, where the top concentration was limited by gel formation (above 3 mm). For these reasons, we only used the high temperature data set to compare structure calculations using both the currently and previously proposed disulfide connectivity (data not shown). For comparison, structure calculations using the high temperature data set were performed with both the Hunter et al. (16) connectivity (P2) and the P3 connectivity, which assumes a knot between Cys-10–Cys-14 (Cys2–Cys5) and Cys-13–Cys-22 (Cys4–Cys7). In the case of P2, the calculations resulted in violation of the exocyclic constraints for Cys-13 (Cys4) and Cys-14 (Cys5), covalent violations of Cys4–Cys5 and Cys2–Cys7 disulfide bonds lengths (∼0.5 Å), and one violation (>0.5 Å) of the Cys5–Cys7 NOE distance constraint determined from the TOCSY-NOESY experiments. Implementation of the P3 connectivity resulted in several NOE violations of >0.5 Å and a significant increase in the target function.
Crystal Structure of Hepcidin in Complex with Fab
Finally, we determined the co-crystal structure of hepcidin bound to the Fab fragment of an anti-hepcidin antibody using a 1.9 Å native high resolution data set (see supplemental Table 4). Interaction between hepcidin and the Fab illustrated that noncontiguous residues on hepcidin were important for the interaction (Fig. 7A and supplemental Table 5). Electron density for residues 1–5 was insufficient to accurately assign the position of these residues, suggesting this region to be highly flexible. This agreed with both the NMR data presented above and data from Hunter et al. (16).
FIGURE 7.

Hepcidin crystal structure confirms the NMR structure and disulfide connectivity. A, hepcidin/Fab structure. B, anomalous peaks indicate locations of sulfur atoms, including those from the eight cysteines as well as methionine 21. Notice that density is visible for the entire disulfide bond. overlay of high (C) and low temperature (D) NMR (red and blue, respectively) and crystal structure (green) of human hepcidin.
The resolution of the native data set enabled visualization of the disulfide bonds at Cys1–Cys8, Cys2–Cys4, Cys3–Cys6, and Cys5–Cys7. Verification of this connectivity was obtained from the anomalous data set, which allowed placement of the sulfur atoms and clear observation of continuous density for disulfide bonds (Fig. 7B). This connectivity agreed with that determined from the NMR structure above and confirmed the absence of the vicinal disulfide bond between Cys4 and Cys5. Comparison of the crystal structure to the high and low temperature NMR solution structures (1.0 and 1.4 Å backbone root mean square deviation, respectively; Fig. 7, C and D) suggested that the antibody may have stabilized hepcidin in a conformation resembling the high temperature NMR structure.
DISCUSSION
In peptides containing extensive disulfide networks in close proximity to one another, discerning disulfide connectivity is a challenging task that often yields ambiguous results (44). One of the most commonly used analytical methods of disulfide mapping is partial reductive alkylation (45). However, pitfalls to this method include the possibility of thiol-disulfide interchange and resilience toward proteolytic degradation. Moreover, in difficult cases such as hepcidin, chemical analysis becomes extraordinarily complex and tedious. In small, disulfide-rich proteins, the disulfide bond connectivity is a key determinant of the three-dimensional fold. Paradoxically, a common practice in establishing this connectivity is through the determination of three-dimensional structures, either by x-ray or NMR spectroscopy (46). This approach was also attempted in the previous NMR studies of hepcidin (16, 17). However, in complex problems involving disulfide networks in close proximity, multiple connectivities may result in highly similar three-dimensional structures, thus leaving the true connectivity undetermined (47). With hepcidin, the analysis is further complicated by the dynamic nature of the peptide that hampers crystallization and degrades the quality of NMR constraints. By optimization of the peptide sample conditions for NMR experiments, we were able to obtain direct evidence for interactions between all of the cysteine residues in the peptide and exocyclic conformations for the critical cysteines. Explicit statistical analysis of these data unambiguously revealed the correct disulfide pattern. It appeared, at least in the statistical calculation for hepcidin, that the analysis based on both NOE and exocyclic cysteine geometry (48) resolved the rare but problematic occurrence of strong NOEs between nonbonded cysteines, a phenomenon typically observed in cyclotide frameworks (42). A novel approach that also utilizes intercysteine NOE constraints was proposed by Walewska et al. (48). However, this method requires the use of partially 15N/13C-labeled peptide samples.
Instead of trying to determine hepcidin structure at ambient temperatures from the dynamically averaged constraints, we collected NMR data at two temperature limits, 325K and 253K where, according to Fig. 3C, more than 90% of the population exists in a single conformation. At both limits, the structure of hepcidin consists of a stable β-sheet element, well characterized by extremely slow exchange rates of Ile-8, Phe-9, Cys-10, Gly-20, and Cys-22 amide protons and a β-hairpin loop. At ambient temperatures the loop adopts two different, almost equally populated, conformations. The high temperature structure in Fig. 6A is well defined, with the root mean square deviation more then 5-fold lower than that of the previously published ensemble (16), despite a significantly smaller number of NOE constraints (186 versus 251). This discrepancy can be ascribed to stronger NOE interactions at higher fields used by the previous authors, higher viscosity of the solution, and the presence of multimeric complexes. The studies at high temperature with homogeneous material resulted in relatively weaker NOE interactions but also negated inter-nuclear and spin-diffusion contributions. All these differences, in addition to different assumptions regarding the disulfide connectivity, led to a higher convergence of structures in the high temperature limit. The conformations of the loop region in both the high and low temperature structures do not appear to match any of the currently classified β-turns (49). However, the thermodynamics and kinetics of the hepcidin β-turn closely resemble that of the model type VIII β-turn found in GDNP tetrapeptide (50). The ∼11 kcal/mol difference in energy between the high and low temperature conformations of hepcidin is likely compensated for by entropy such that the free energy of both forms is almost the same at ambient temperatures.
Relevance of Iron to Hepcidin Structure
A drastically different hepcidin structure has been proposed (51) where disulfide bonds are absent and the cysteines coordinate iron. In this study no evidence supporting this structure was observed either by NMR or x-ray, despite the generation of active material from sources where iron would be readily available throughout the protein expression and folding stages. In addition, ehHepc samples were characterized for the presence of iron by inductively coupled plasma analysis and for the ability to bind iron by NMR. Only trace amounts of iron were recovered (similar to that of other metals), and no appreciable interaction was observed in solution (data not shown).
Relevance to Biological Activity
The observed temperature-dependent structural change in hepcidin is intriguing and of particular interest in the context of ferroportin binding. It seems, however, that the temperature-dependent activity observed in previously published ferroportin internalization assays (52) does not correlate with the temperature dependence of its loop conformation; in the range from 15 to 4 °C, the observed 90% drop in activity (52) is significantly larger than the 15% change in the population distribution (Fig. 3C) between the two limiting structures. Moreover, the observed loss of secondary structure at 4 °C in the CD spectra (52) and multimerization of hepcidin (16) are inconsistent with the current observations of identically folded and monomeric hepcidin within the −20 to +53 °C temperature range. It is possible that the observed temperature-dependent activity is related to some type of disulfide exchange either on ferroportin or between hepcidin and the receptor, as proposed by Fernandes et al. (53). It is also reasonable to attribute these discrepancies to differences in the biophysical properties of various hepcidin preparations, as we have explored here, because previous and current studies used hepcidin from different sources. Indeed, the biological activity of hepcidin preparations have been linked to the aggregation state of the peptide (19), and discrepancies between mass spectrometry and antibody-based hepcidin detection assays have been reported (54).
The N-terminal region of hepcidin has been shown to be necessary but not sufficient for binding to ferroportin (18). However, in both the NMR and x-ray data, the N-terminal region was disordered (at all temperatures in NMR), and its electron density was not visible. Therefore, no attempt was made to evaluate any temperature effect on the conformation of this portion of the peptide.
Although the temperature-dependent structural changes explored here are not related to the previously published temperature-dependent activity, it is possible that its purpose is to sustain the physiological efficacy of hepcidin across a wide temperature range, i.e. the conformational switch is utilized to compensate for the otherwise unfavorable temperature dependence of hepcidin binding to ferroportin. This mechanism may afford biological systems a means to maintain constant iron levels across a wide temperature range in species unable to adequately regulate core temperature. We support this hypothesis by a simple thermodynamic model presented in supplemental Fig. 7.
Supplementary Material
Acknowledgments
We thank Ching Chen for affinity determination of the anti-hepcidin antibody used for Fab generation; Jingwen Zhang for shHepc preparation; Noi Nuanamanee for ehHepc and chHepc production; Ann Hsu for chHepc characterization; and Gregory Dyas and Jacob Corcoran for hepcidin activity determination. We also acknowledge the helpful comments from the reviewers, which allowed us to improve upon the statistical analysis. ALS-Beamline 5.0.2 is supported by the United States Department of Energy under Contract DE-AC02-05CH11231.

The on-line version of this article (available at http://www.jbc.org) contains supplemental Figs. 1–7, supplemental Methods, and Tables 1–5.
The atomic coordinates and structure factors (codes 2KEF and 3H0T) have been deposited in the Protein Data Bank, Research Collaboratory for Structural Bioinformatics, Rutgers University, New Brunswick, NJ (http://www.rcsb.org/).
B. J. Sasu, K. Cooke, T. L. Arvedson, C. Plewa, A. R. Ellison, J. Sheng, G. Dyas, A. Winters, T. Juan, H. Li, C. G. Begley, and G. Molineux, submitted for publication.
The superscript numbers are used for cysteines only and will be used interchangeably with normal numbers designating amino acid position.
- uhHepc
- urinary human hepcidin
- TOCSY
- total correlation spectroscopy
- NOESY
- nuclear Overhauser enhancement spectroscopy
- HSQC
- heteronuclear single-quantum coherence spectroscopy
- HMBC
- heteronuclear multiple-bond coherence spectroscopy
- IRMPD-FTMS
- infrared multiphoton dissociation-Fourier transform mass spectrometry
- NEM
- N-ethylmaleimide
- MALDI
- matrix-assisted laser desorption/ionization
- NOE
- nuclear Overhauser effect
- RP-HPLC
- reversed phase high performance liquid chromatography
- PBS
- phosphate-buffered saline
- TCEP
- tris(2-carboxyethyl)phosphine hydrochloride
- Fmoc
- N-(9-fluorenyl)methoxycarbonyl
- PTH
- phenylthiohydantoin
- CHO
- Chinese hamster ovary
- t-Bu
- t-butyl alcohol
- chHepc
- human hepcidin in CHO cells
- LC/MS
- liquid chromatography/mass spectrometry
- ehHepc
- human Hepcidin in E. coli
- shHepc
- synthetic hepcidin
- MES
- 4-morpholineethanesulfonic acid
- Trt
- trityl.
REFERENCES
- 1.Andrews N. C. (2000) Nat. Rev. Genet. 1, 208–217 [DOI] [PubMed] [Google Scholar]
- 2.Krause A., Neitz S., Mägert H. J., Schulz A., Forssmann W. G., Schulz-Knappe P., Adermann K., Krause A., Neitz S., Magert H. J., Schulz A., Forssmann W. G., Schulz-Knappe P., Adermann K. (2000) FEBS Lett. 480, 147–150 [DOI] [PubMed] [Google Scholar]
- 3.Park C. H., Valore E. V., Waring A. J., Ganz T., Park C. H., Valore E. V., Waring A. J., Ganz T. (2001) J. Biol. Chem. 276, 7806–7810 [DOI] [PubMed] [Google Scholar]
- 4.Pigeon C., Ilyin G., Courselaud B., Leroyer P., Turlin B., Brissot P., Loreal O., Pigeon C., Ilyin G., Courselaud B., Leroyer P., Turlin B., Brissot P., Loréal O. (2001) J. Biol. Chem. 276, 7811–7819 [DOI] [PubMed] [Google Scholar]
- 5.Roetto A., Papanikolaou G., Politou M., Alberti F., Girelli D., Christakis J., Loukopoulos D., Camaschella C., Roetto A., Papanikolaou G., Politou M., Alberti F., Girelli D., Christakis J., Loukopoulos D., Camaschella C. (2003) Nat. Genet. 33, 21–22 [DOI] [PubMed] [Google Scholar]
- 6.Njajou O. T., Vaessen N., Joosse M., Berghuis B., van Dongen J. W., Breuning M. H., Snijders P. J., Rutten W. P., Sandkuijl L. A., Oostra B. A., van Duijn C. M., Heutink P. (2001) Nat. Genet. 28, 213–214 [DOI] [PubMed] [Google Scholar]
- 7.Montosi G., Donovan A., Totaro A., Garuti C., Pignatti E., Cassanelli S., Trenor C. C., Gasparini P., Andrews N. C., Pietrangelo A. (2001) J. Clin. Invest. 108, 619–623 [DOI] [PMC free article] [PubMed] [Google Scholar]
- 8.Press R. D. (2001) Mol. Diagn. 6, 347. [PubMed] [Google Scholar]
- 9.Lee P. L., Gelbart T., West C., Halloran C., Felitti V., Beutler E., Lee P. L., Gelbart T., West C., Halloran C., Felitti V., Beutler E. (2001) Blood Cells Mol. Dis. 27, 783–802 [DOI] [PubMed] [Google Scholar]
- 10.Nicolas G., Viatte L., Lou D. Q., Bennoun M., Beaumont C., Kahn A., Andrews N. C., Vaulont S. (2003) Nat. Genet. 34, 97–101 [DOI] [PubMed] [Google Scholar]
- 11.Nicolas G., Bennoun M., Porteu A., Mativet S., Beaumont C., Grandchamp B., Sirito M., Sawadogo M., Kahn A., Vaulont S. (2002) Proc. Natl. Acad. Sci. U.S.A. 99, 4596–4601 [DOI] [PMC free article] [PubMed] [Google Scholar]
- 12.Nicolas G., Bennoun M., Devaux I., Beaumont C., Grandchamp B., Kahn A., Vaulont S. (2001) Proc. Natl. Acad. Sci. U.S.A. 98, 8780–8785 [DOI] [PMC free article] [PubMed] [Google Scholar]
- 13.Roy C. N., Andrews N. C. (2005) Curr. Opin. Hematol. 12, 107–111 [DOI] [PubMed] [Google Scholar]
- 14.Yuan X. M., Li W. (2003) Ann. Med. 35, 578–591 [DOI] [PubMed] [Google Scholar]
- 15.Zecca L., Youdim M. B., Riederer P., Connor J. R., Crichton R. R. (2004) Nat. Rev. Neurosci. 5, 863–873 [DOI] [PubMed] [Google Scholar]
- 16.Hunter H. N., Fulton D. B., Ganz T., Vogel H. J. (2002) J. Biol. Chem. 277, 37597–37603 [DOI] [PubMed] [Google Scholar]
- 17.Lauth X., Babon J. J., Stannard J. A., Singh S., Nizet V., Carlberg J. M., Ostland V. E., Pennington M. W., Norton R. S., Westerman M. E. (2005) J. Biol. Chem. 280, 9272–9282 [DOI] [PubMed] [Google Scholar]
- 18.Nemeth E., Tuttle M. S., Powelson J., Vaughn M. B., Donovan A., Ward D. M., Ganz T., Kaplan J. (2004) Science 306, 2090–2093 [DOI] [PubMed] [Google Scholar]
- 19.Gagliardo B., Faye A., Jaouen M., Deschemin J. C., Canonne-Hergaux F., Vaulont S., Sari M. A. (2008) FEBS J. 275, 3793–3803 [DOI] [PubMed] [Google Scholar]
- 20.Shaka A. J., Lee C. J., Pines A. (1988) J. Magn. Reson. 77, 274–293 [Google Scholar]
- 21.Furrer J., Kramer F., Marino J. P., Glaser S. J., Luy B. (2004) J. Magn. Reson. 166, 39–46 [DOI] [PubMed] [Google Scholar]
- 22.Palmer A. G., 3rd, Cavanagh J., Wright P. E., Rance M. (1991) J. Magn. Reson. 93, 151–170 [Google Scholar]
- 23.Hansen P. E. (1991) Biochemistry 30, 10457–10466 [DOI] [PubMed] [Google Scholar]
- 24.Brüschweiler R., Griesinger C., Sørensen O. W., Ernst R. R. (1988) J. Magn. Reson. 78, 178–185 [Google Scholar]
- 25.Kessler H., Gemmecker G., Haase B., Steuernagel S. (1988) Magn. Reson. Chem. 26, 919–926 [Google Scholar]
- 26.Delaglio F., Grzesiek S., Vuister G. W., Zhu G., Pfeifer J., Bax A. (1995) J. Biomol. NMR 6, 277–293 [DOI] [PubMed] [Google Scholar]
- 27.Cornilescu G., Delaglio F., Bax A. (1999) J. Biomol. NMR 13, 289–302 [DOI] [PubMed] [Google Scholar]
- 28.Jaynes E. T. (2003) Probability Theory: The Logic of Science (Bretthorst G. L. ed) Cambridge University Press, Cambridge, UK [Google Scholar]
- 29.Güntert P. (2004) Methods Mol. Biol. 278, 353–378 [DOI] [PubMed] [Google Scholar]
- 30.Herrmann T., Güntert P., Wüthrich K. (2002) J. Mol. Biol. 319, 209–227 [DOI] [PubMed] [Google Scholar]
- 31.Karplus M. J. (1959) J. Chem. Phys. 30, 11–15 [Google Scholar]
- 32.Case D. A., Cheatham T. E., 3rd, Darden T., Gohlke H., Luo R., Merz K. M., Jr., Onufriev A., Simmerling C., Wang B., Woods R. J. (2005) J. Comput. Chem. 26, 1668–1688 [DOI] [PMC free article] [PubMed] [Google Scholar]
- 33.Laskowski R. A., Rullmannn J. A., MacArthur M. W., Kaptein R., Thornton J. M. (1996) J. Biomol. NMR 8, 477–486 [DOI] [PubMed] [Google Scholar]
- 34.Emsley P., Cowtan K. (2004) Acta Crystallogr. D. Biol. Crystallogr. 60, 2126–2132 [DOI] [PubMed] [Google Scholar]
- 35.Vagin A. A., Steiner R. A., Lebedev A. A., Potterton L., McNicholas S., Long F., Murshudov G. N. (2004) Acta Crystallogr. D. Biol. Crystallogr. 60, 2184–2195 [DOI] [PubMed] [Google Scholar]
- 36.Truksa J., Peng H., Lee P., Beutler E. (2006) Proc. Natl. Acad. Sci. U.S.A. 103, 10289–10293 [DOI] [PMC free article] [PubMed] [Google Scholar]
- 37.Nemeth E., Preza G. C., Jung C. L., Kaplan J., Waring A. J., Ganz T. (2006) Blood 107, 328–333 [DOI] [PMC free article] [PubMed] [Google Scholar]
- 38.Wüthrich K. (1986) NMR of Proteins and Nucleic Acids, Wiley Interscience, New York [Google Scholar]
- 39.Hallet J. (1963) Proc. Phys. Soc. 82, 1046–1050 [Google Scholar]
- 40.Chalal R. S., Miller R. D. (1965) Br. J. Appl. Phys. 16, 231–239 [Google Scholar]
- 41.Haasnoot C. A., de Leeuw F. A., Altona C. (1980) Tetrahedron 36, 2783–2792 [Google Scholar]
- 42.Rosengren K. J., Daly N. L., Plan M. R., Waine C., Craik D. J. (2003) J. Biol. Chem. 278, 8606–8616 [DOI] [PubMed] [Google Scholar]
- 43.Klaus W., Broger C., Gerber P., Senn H. (1993) J. Mol. Biol. 232, 897–906 [DOI] [PubMed] [Google Scholar]
- 44.Kjaergaard M., Gårdsvoll H., Hirschberg D., Nielbo S., Mayasundari A., Peterson C. B., Jansson A., Jørgensen T. J., Poulsen F. M., Ploug M. (2007) Protein Sci. 16, 1934–1945 [DOI] [PMC free article] [PubMed] [Google Scholar]
- 45.Gray W. R. (1993) Protein Sci. 2, 1732–1748 [DOI] [PMC free article] [PubMed] [Google Scholar]
- 46.Boisbouvier J., Blackledge M., Sollier A., Marion D. (2000) J. Biomol. NMR 16, 197–208 [DOI] [PubMed] [Google Scholar]
- 47.Sampoli Benitez B. A., Komives E. A. (2000) Proteins 40, 168–174 [DOI] [PubMed] [Google Scholar]
- 48.Walewska A., Skalicky J. J., Davis D. R., Zhang M. M., Lopez-Vera E., Watkins M., Han T. S., Yoshikami D., Olivera B. M., Bulaj G. (2008) J. Am. Chem. Soc. 130, 14280–14286 [DOI] [PMC free article] [PubMed] [Google Scholar]
- 49.Hutchinson E. G., Thornton J. M. (1994) Protein Sci. 3, 2207–2216 [DOI] [PMC free article] [PubMed] [Google Scholar]
- 50.Fuchs P. F., Bonvin A. M., Bochicchio B., Pepe A., Alix A. J., Tamburro A. M. (2006) Biophys. J. 90, 2745–2759 [DOI] [PMC free article] [PubMed] [Google Scholar]
- 51.Farnaud S., Patel A., Evans R. W. (2006) Biometals 19, 527–533 [DOI] [PubMed] [Google Scholar]
- 52.De Domenico I., Nemeth E., Nelson J. M., Phillips J. D., Ajioka R. S., Kay M. S., Kushner J. P., Ganz T., Ward D. M., Kaplan J. (2008) Cell Metabolism 8, 146–156 [DOI] [PMC free article] [PubMed] [Google Scholar] [Retracted]
- 53.Fernandes A., Preza G. C., Phung Y., De Domenico I., Kaplan J., Ganz T., Nemeth E. (2009) Blood 114, 437–443 [DOI] [PMC free article] [PubMed] [Google Scholar]
- 54.Ganz T., Olbina G., Girelli D., Nemeth E., Westerman M. (2008) Blood 112, 4292–4297 [DOI] [PubMed] [Google Scholar]
- 55.Hu S.-F. S., Gudas J. M., Brankow D. W. (April3, 2001) U. S. Patent 6,210,924 [Google Scholar]
- 56.Atherton E., Sheppard R. C. (1989) Solid Phase Peptide Synthesis, A Practical Approach, pp.216, Oxford University Press, Oxford, UK [Google Scholar]
Associated Data
This section collects any data citations, data availability statements, or supplementary materials included in this article.