Abstract
The accumulation of triglycerides (TG) in the liver, designated hepatic steatosis, is characteristically associated with obesity and insulin resistance, but it can also develop after fasting. Here, we show that fasting-induced hepatic steatosis is under genetic control in inbred mice. After a 24-h fast, C57BL/6J mice and SJL/J mice both lost more than 20% of body weight and ∼60% of total body TG. In C57BL/6J mice, TG accumulated in liver, producing frank steatosis. In striking contrast, SJL/J mice failed to accumulate any hepatic TG even though they lost nearly as much adipose tissue mass as the C57BL/6J mice. Mice from five other inbred strains developed fasting-induced steatosis like the C57BL/6J mice. Measurements of the uptake of free fatty acids (FA) in vivo and in vitro demonstrated that SJL/J mice were protected from steatosis because their heart and skeletal muscle took up and oxidized twice as much FA as compared with C57BL/6J mice. As a result of this muscle diversion, serum-free FA and ketone bodies rose much less after fasting in SJL/J mice as compared with C57BL/6J mice. When livers of SJL/J and C57BL/6J mice were perfused with similar concentrations of FA, the livers took up and esterified similar amounts. We conclude that SJL/J mice express one or more variant genes that lead to enhanced FA uptake and oxidation in muscle, thereby sparing the liver from FA overload in the fasting state.
Liver and adipose tissue coordinate metabolic responses to oscillations in nutrient availability (1, 2). In the postprandial state, the liver secretes triglycerides (TG)4 into the blood in very low-density lipoproteins (VLDL). In adipose tissue, lipoprotein lipase hydrolyzes the TG, producing fatty acids (FA) and monoglycerides that enter fat cells for reesterification and storage as TG (1). The activity of adipose tissue lipoprotein lipase is enhanced by the postprandial rise in insulin. At the same time, insulin inhibits lipolysis of stored TG in fat cells, assuring that the TG will be retained in the cells (3).
Under fasting conditions, insulin falls and the inhibitory effect of insulin on adipose tissue lipolysis is diminished. The released FA enters the blood and is used as an energy source in liver, heart, and skeletal muscle. In the liver, excess FA are either re-esterified into TG for intracellular storage or oxidized and secreted as ketone bodies, which become the main energy source for the brain. In skeletal muscle during fasting, FA are oxidized to CO2 (1, 2).
We (4–6) and others (7) previously reported that livers of mice accumulate large amounts of TG after fasting for 6–24 h. In the current study, we screened 7 strains of inbred mice to study the genetic control of fasting-induced hepatic TG accumulation. Mice from 6 of 7 strains exhibited fasting-induced fatty liver. In the unique mouse strain (SJL/J), hepatic TG failed to accumulate after a 24-h fast even though the SJL/J mice lost amounts of body weight and adipose tissue that were similar to those of the other 6 strains. To trace the mechanism for the difference in hepatic TG accumulation, we conducted extensive comparisons of SJL/J mice and C57BL/6J mice. We provide evidence that mice from both strains release comparable amounts of FA from adipose tissue into blood after fasting. In the SJL/J mice, the bulk of these FA are taken up by muscle and oxidized. In C57BL/6J mice, FA uptake in muscle is comparatively low, and the excess FA are taken up by the liver where they are converted to TG. Thus, genetic control of muscle FA uptake determines the level of hepatic TG accumulation in fasted mice.
EXPERIMENTAL PROCEDURES
Isotopes and Other Materials
We obtained etomoxir, [1,2,3-3H]glycerol (39.8 Ci/mmol), [carboxy-14C]palmitic acid (53 mCi/mmol), and [9,10-3H]palmitic acid (50 Ci/mmol) from Sigma and 3H-labeled water (5 Ci/ml) and (R)-2-[9,10-3H]bromopalmitic acid (40 Ci/mmol) from American Radiolabeled Chemicals. The sodium salts of [14C]palmitic acid, [3H]palmitic acid, and 2-[3H]bromopalmitic acid were conjugated to bovine serum albumin as previously described (8). Newborn calf lipoprotein-deficient serum was prepared as described (9).
Blood Parameters
After mice were anesthetized with halothane, blood was drawn from the retroorbital sinus and collected in either Eppendorf tubes (for serum) or EDTA-coated tubes (for plasma). Glucose was measured in whole blood with Glucometer Elite (Bayer Corp.). Serum or plasma levels of the following substances were measured with commercially available kits: cholesterol (Sigma), TG (Sigma), free FA (Wako), β-hydroxybutyrate (Pointe Scientific, Inc.), insulin (Crystal Chem, Inc.), glycerol (Cayman Chemical Co.), aspartate aminotransferase, and alanine aminotransferase (Ortho-Clinical Diagnostics), and leptin (Linco Research).
Mice
Male C57BL/6J and male SJL/J mice (5 weeks of age) were purchased from Jackson Laboratory (000664 and 000686, respectively). SJL/Bm mice (001902), SWR/J mice (000689), AKR/J mice (000648), and FVB/NJ mice (001800) were obtained from Jackson Laboratory at 8 weeks of age. 129SVE mice (129SVE-M) were purchased from Taconic at 8 weeks of age. Animals were housed in colony cages with lighting from 10 AM to 10 PM and fed a standard chow diet containing 6% fat (Teklad Mouse/Rat Diet 7002 from Harlan Teklad Premier Laboratory Diets) until the time of experiments as described in the legends to the figures and Table 1. For fasting studies, mice were housed in individual cages; food was removed at 10 AM, and the mice were studied at 10 AM the next morning. At the time of food removal, a wired floor was installed in the bottom of the cage to prevent ingestion of feces. At the time of sacrifice, the stomach contents of all fasted animals were examined to verify fasting. All animal experiments were performed with the approval of the Institutional Animal Care and Research Advisory Committee of the University of Texas Southwestern Medical Center at Dallas.
TABLE 1.
Characteristics of male C57BL/6J and SJL/J mice in fed and fasted conditions
Male C57BL/6J and SJL/J mice (10 weeks of age) were fed a chow diet ad libitum or fasted for 24 h prior to study. Each value represents mean ± S.E. of values from 4–6 mice. Asterisks denote level of statistical significance (Student's t test) between fed and fasted mice of the same strain, *, p < 0.01; **, p < 0.001.
| Parameter | C57BL/6J |
SJL/J |
||
|---|---|---|---|---|
| Fed | Fasted | Fed | Fasted | |
| Total body weight (g) | 23.9 ± 0.4 | 17.0 ± 0.2* | 23.2 ± 0.5 | 18.5 ± 0.6* |
| Total body fat (g)a | 1.63 ± 0.17 | 0.69 ± 0.12* | 1.03 ± 0.14 | 0.35 ± 0.03* |
| Total lean weight (g)a | 17.9 ± 0.42 | 14.6 ± 0.38* | 17.5 ± 0.56 | 14.1 ± 0.50* |
| Liver weight (g) | 1.2 ± 0.1 | 1.0 ± 0.03* | 1.4 ± 0.03 | 0.9 ± 0.04* |
| Epididymal fat pad weight (g) | 0.25 ± 0.01 | 0.08 ± 0.01** | 0.21 ± 0.03 | 0.07 ± 0.01** |
| Total body TG (g)b | 1.7 ± 0.1 | 0.58 ± 0.1** | 1.0 ± 0.2 | 0.47 ± 0.1* |
| Total liver TG (g)b | 0.015 ± 0.002 | 0.079 ± 0.011* | 0.008 ± 0.001 | 0.012 ± 0.003 |
| Liver TG content (mg/g)b | 7.0 ± 0.72 | 97 ± 14** | 5.8 ± 0.18 | 5.4 ± 0.79 |
| Liver cholesterol content (mg/g)b | 2.1 ± 0.13 | 3.5 ± 0.31 | 2.6 ± 0.09 | 3.3 ± 0.12 |
| Serum cholesterol (mg/dl) | 85 ± 6.2 | 92 ± 4.2 | 107 ± 5.3 | 105 ± 3.1 |
| Serum TG (mg/dl) | 68 ± 2.2 | 68 ± 4.4 | 141 ± 24 | 33 ± 4.7* |
| Serum free FA (mm) | 0.59 ± 0.02 | 1.3 ± 0.13* | 0.60 ± 0.07 | 0.57 ± 0.08 |
| Serum glycerol (mg/dl) | 3.4 ± 0.55 | 2.5 ± 0.09 | 3.2 ± 0.08 | 2.2 ± 0.40 |
| Serum β-hydroxybutyrate (mm) | 0.25 ± 0.04 | 2.5 ± 0.15** | 0.28 ± 0.04 | 0.81 ± 0.22 |
| Blood glucose (mg/dl) | 132 ± 5 | 70 ± 1* | 136 ± 8 | 111 ± 6 |
| Plasma insulin (ng/ml) | 0.8 ± 0.14 | 0.1 ± 0.01** | 0.9 ± 0.14 | 0.1 ± 0.01** |
| Plasma leptin (ng/ml) | 2.0 ± 0.53 | 0.7 ± 0.13** | 2.7 ± 0.71 | 0.5 ± 0.24** |
| Plasma ASTc (unit/liter) | 94 ± 20 | 143 ± 11 | 130 ± 13 | 114 ± 8 |
| Plasma ALTd (unit/liter) | 75 ± 5.7 | 96 ± 5.1 | 99 ± 9.2 | 89 ± 12 |
a Value determined by NMR.
b Value determined by extraction and chemical measurement.
c AST, aspartate aminotransferase.
d ALT, alanine aminotransferase.
Measurement of TG in Tissues
Lipids were extracted from tissues by the method of Folch et al. (10). Briefly, a piece of tissue (100–200 mg) was homogenized in 4 ml of chloroform:methanol (2:1, v/v) using a PRO200 homogenizer (PRO Scientific), after which 0.8 ml of saline was added to the mixture and vortexed vigorously. The phases of the Folch extraction were separated by centrifugation at 3000 × g for 20 min, the organic phase was transferred to a 5-ml volumetric flask, and the final volume was brought up to 5 ml with chloroform. TG in the chloroform phase was measured by enzymatic assay (Thermo Scientific) (6).
Metabolic Cages
Male C57BL/6J and SJL/J mice were housed individually in metabolic cages designed by Oxymax Lab Animal Monitoring System (Columbus Instrument). After 1 day of acclimation, metabolic data on 6 mice in each group were collected automatically from the Oxymax Monitoring System at intervals of 39 min. On the fourth day of the experiment, food was removed for a 24-h fasting treatment. These experiments were carried out in the Animal Phenotyping Core at UT Southwestern.
Synthesis of TG in Vivo
Mice were fed a chow diet ad libitum or fasted for 24 h. Each mouse was injected intraperitoneally either with [3H]glycerol (2.5 nmol/mouse; 88 × 106 dpm/nmol), sodium [14C]palmitate-albumin (94.5 nmol/mouse; 118 × 103 dpm/nmol), or 3H-labeled water (25 mCi in 100 μl of isotonic saline per mouse). 30 min after injection, each mouse was anesthetized, and 500 μl of blood was removed from the retroorbital sinus for measurement of the serum content of 3H or 14C radioactivity in duplicate. Portions of liver were removed for measurement of radiolabeled lipids. For measurement of TG synthesis from [3H]water, [3H]glycerol, or [14C]palmitate, portions of liver (200 mg) were homogenized and subjected to Folch extraction as described above, followed by thin-layer chromatography (TLC) and scintillation counting as described (11). For measurement of FA synthesis from [3H]water, 200 mg of liver were subjected to saponification, petroleum ether extraction, and scintillation counting as described (11).
Infusion of FA
A 24 mm sodium oleate-albumin solution in phosphate-buffered saline (PBS; final pH, 7.0) was prepared as previously described (8). Mice were fasted for 24 h and anesthetized by injecting 30 mg/kg sodium pentobarbital intraperitoneally, after which a catheter was inserted into the jugular vein. Fasted mice were injected with 100 μl of PBS containing 12% albumin and either 6 mm or 12 mm sodium oleate-albumin, followed by 300-μl of the same 6 mm or 12 mm oleate solution through the jugular vein at 10 μl/min for 30 min (Standard Syringe Pump, Harvard Apparatus). Aliquots of blood (50 μl) were taken from the jugular vein prior to and after the infusion. After 30 min, serum and liver were obtained for measurement of the content of FA and TG by enzymatic assays.
FA Esterification in Liver
Mice fasted for 24 h were anesthetized by exposure to isofluorene. The inferior vena cava was severed to allow blood to escape. The liver was perfused through the portal vein at 1 ml/min with the following sequential solutions: 1 ml of oxygenated Hank's Balanced Salt Solution (HBSS), 1 ml of various concentrations of sodium palmitate-albumin plus 20 nm sodium [3H]palmitate-albumin (111 dpm/fmol), and 2 ml of oxygenated HBSS. The liver was removed and immediately frozen in liquid nitrogen. Portions of frozen liver (150 mg) were used for lipid extraction, for quantification of [3H]palmitate incorporation into TG by TLC, and for measurement of total TG concentration by enzymatic assay.
FA Uptake in Vivo and in Vitro
For FA uptake by different tissues in vivo, mice were fasted for 24 h and anesthetized by injecting 30 mg/kg sodium pentobarbital intraperitoneally. A catheter was inserted into the jugular vein. Fifty microliters of blood was taken from the jugular vein for serum FA determination, after which sodium [3H]bromopalmitate-albumin (39 × 106 cpm; 1 nmol) was injected. 1 min after injection, the right auricle of each mouse was opened. A needle was inserted into the left ventricle, and 15 ml of ice-cold PBS was injected under pressure with a syringe. At the end of this procedure, the liver, kidney, and other organs were pale and the fluid emerging from the right atrium was clear. Various tissues were removed and used for lipid extraction and for measurement of radioactivity by scintillation counting as described (11).
For uptake of FA in vitro, mice were fasted, anesthetized, and flushed with ice-cold PBS through the left ventricle as above. Liver, gastrocnemius muscle, and heart were removed. Tissue pieces (150 mg for liver and muscle; 50 mg for heart) were incubated in Krebs-Ringer Bicarbonate Buffer (KRBB) at 37 °C for 30 min. Each tissue piece was then transferred to a new tube containing 0.5 ml of KRBB and various concentrations of sodium [3H]bromopalmitate-albumin (2000 dpm/nmol). After incubation at 37 °C for 0 and 10 min, tissues were washed 3× in 1 liter of ice-cold PBS, and residual solution was removed by blotting with filter paper. Tissues were then subjected to lipid extraction and measurement of radioactivity by scintillation counting. Blank values, determined from the zero-time incubation, were subtracted from experimental values; blank values were <2% of the highest experimental values.
Oxidation of FA in Vitro
Mice were fasted for 24 h and whole body perfused with 15 ml of ice-cold PBS through the left ventricle as described above. The gastrocnemius muscle (100–150 mg) was removed and incubated in 0.5 ml of oxygenated KRBB. After incubation for 30 min at 37 °C, the muscle was minced and transferred to 0.5 ml of solution containing 2 mm ATP, 50 μm CoA, 1 mm dithiothreitol, 0.1 mm NAD+, 1 mm dl-carnitine, 0.1 mm sodium EDTA, 1 mm MgCl2, 80 mm KCl, 100 mm sucrose, and 50 mm Hepes-NaOH (final pH, 7.3). The reaction was started by addition of sodium [14C]palmitate-albumin (118 dpm/pmol; final concentration, 11 μm). The tissue was incubated for 5 min at 37 °C in a 2-ml Eppendorf tube placed in a sealed 24-ml scintillation vial together with a 21-mm filter paper (Whatman) saturated with 1× hyamine hydroxide (12). The reaction was terminated by injecting 0.1 ml of 7% perchloric acid into the reaction tube. The filter paper with its trapped [14C]CO2 was dissolved in Insta-FluorTM Plus scintillation mixture (PerkinElmer) and subjected to scintillation counting. Blank values, determined in parallel reactions containing buffer and [14C]palmitate but no tissue, were subtracted from experimental values; blank values were <1% of the highest experimental values.
TG Synthesis in Primary Hepatocytes
Primary hepatocytes were isolated from 18-h fasted mice and cultured in Dulbecco's modified Eagle's medium (DMEM) (1 g/liter glucose) containing 10% newborn calf lipoprotein-deficient serum, 100 units/ml penicillin, and 100 μg/ml streptomycin as described (13). After attachment for 4 h, hepatocytes were washed with PBS and then incubated for various times with DMEM containing 1.5 mm [3H]glycerol (14.6 dpm/pmol) in the presence of various concentrations of unlabeled sodium oleate-albumin. After incubation, the cells were washed three times with PBS, after which the cellular lipids were extracted and the content of [3H]TG was quantified by TLC as described above. Protein content was measured by the BCA method.
Quantitative Real Time PCR
Total RNA was prepared from mouse livers using an RNA STAT-60 kit (TEL-TEST “B”, Friendswood, TX). Equal amounts of RNA from 6 mice were pooled and subjected to quantitative real-time PCR as previously described (5). Primer sequences were the same as described (6). All reactions were done in triplicate. The relative amounts of mRNAs were calculated using the comparative CT method. ApoB mRNA was used as the invariant control.
NMR Scanning
Total body fat and total lean weight were measured in living mice by NMR using a Bruker Minispec mq7.5 NMR analyzer (Bruker Optics) as described (14).
RESULTS
SJL/J Mice Resist Fasting-induced Hepatic Steatosis
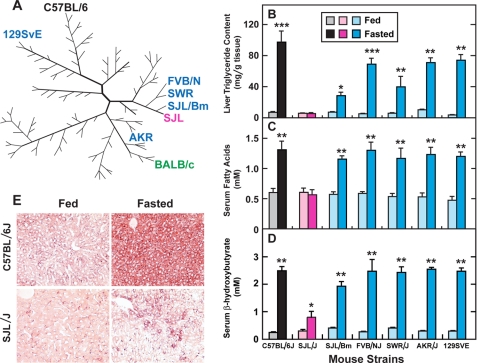
Fig. 1A shows the family tree of common inbred mouse strains as determined by comparative analysis of single nucleotide polymorphisms (15). The 7 strains used in the current studies are indicated in blue, black, and red. After fasting for 24 h, mice from all 7 strains lost a substantial amount of total body weight (14–30%) and white adipose tissue weight (30–60%) (data not shown). Fig. 1B shows the TG content in livers of mice from the 7 strains in the fed and fasted states. In the fed state, mice from all 7 mouse strains had comparable levels of hepatic TG. Fasting for 24 h increased the hepatic TG content in 6 of these strains, but not in SJL/J. In fasted mice from the 6 responsive strains, hepatic TG content increased to levels ranging from 29 mg/g in SJL/Bm to 97 mg/g in C57BL/6J (Fig. 1B). In fasted SJL/J liver, the TG content averaged 5.4 mg/g. The dramatic difference between fasted C57BL/6J and SJL/J mice was confirmed by oil-red O staining of liver sections (Fig. 1E). Serum levels of free FA rose with fasting in the 6 responsive strains (Fig. 1C). No such increase was seen in the SJL/J mice. The fasting-induced rise in serum ketone bodies, as reflected by levels of β-hydroxybutyrate, was also much less in SJL/J mice than it was in the other 6 strains (Fig. 1D). To search for a mechanism for these differences, we carried out a detailed comparison of SJL/J and C57BL/6J mice.
FIGURE 1.
Effects of fasting on TG content in livers of various inbred strains of mice. A, family tree of inbred mouse strains (15). The 7 strains studied in this report are denoted by the following colors: black, C57BL/6J; red, SJL/J; and blue, 5 other strains. One additional strain previously reported to manifest fasting-induced fatty liver (7) is denoted in green. (B–E), different strains of male mice (9–12 weeks of age) were fed a chow diet ad libitum (fed) or fasted for 24 h prior to study. B, liver TG content was determined by extraction and enzymatic assay. C and D, serum levels of free FA (C) and ketone bodies (D) from fed or fasted animals were determined by enzymatic assays. B–D, each bar represents the mean ± S.E. of values from six mice except for SJL/Bm (n = 4). Asterisks denote the level of statistical significance (Student's t test) between the fed and fasted mice in each strain. *, p < 0.05; **, p < 0.01; ***, p < 0.001. E, oil red O-stained histological sections of livers from fed (left) and fasted (right) C57BL/6J (top) and SJL/J (bottom) mice. Animals were perfused with Hank's Balanced Salt Solution and then with 10% (v/v) formalin in PBS through the heart; frozen sections of livers were stained with oil red O. Magnification, ×20.
Metabolic Changes after 24 h Fasting in Male C57BL/6J and SJL/J Mice
Table 1 compares a variety of metabolic parameters in male C57BL/6J and SJL/J mice under fed and fasted conditions. Both strains lost comparable amounts of body weight after fasting. Total body fat declined by 58 and 66% in the C57BL/6J and SJL/J mice, respectively, as measured by NMR. Consistent with this finding, the weight of the epididymal fat pads declined by 68 and 66%, respectively. As determined by solvent extraction and chemical measurements, the liver TG content in fasted C57BL/6J mice rose by 14-fold, reaching a level of 97 mg/g. In sharp contrast, there was no increase in the hepatic TG content of fasted SJL/J mice (5.4 mg/g). Hepatic cholesterol content increased slightly and to similar extents in both mouse strains (Table 1). As noted above, serum FA did not increase with fasting in SJL/J mice, and ketone bodies showed a much lower increase than observed in C57BL/6J mice. Other parameters studied (including blood glucose, plasma insulin, and plasma leptin concentrations) were comparable between the C57BL/6J and SJL/J mice in both the fed and fasted states (Table 1).
TG Levels in Various Tissues of Fasted C57BL/6J and SJL/J Mice
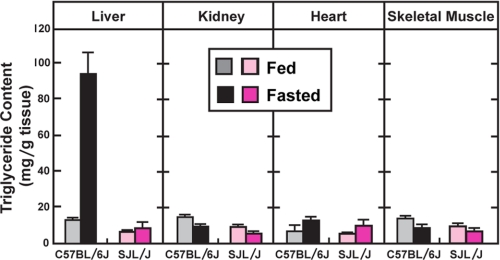
Whereas fasting caused a dramatic increase in liver TG in C57BL/6J mice, the TG content of other organs did not increase appreciably (Fig. 2).
FIGURE 2.
Effects of fasting on TG content in various tissues of C57BL/6J and SJL/J mice. Male C57BL/6J and SJL/J mice (13 weeks of age were fed a chow diet ad libitum or fasted for 24 h and TG content in the indicated tissues was determined by enzymatic assay. Each bar represents the mean ± S.E. of values from six mice.
Fasting Leads to Similar Changes in Levels of Lipogenic mRNAs in Livers of C57BL/6J and SJL/J Mice
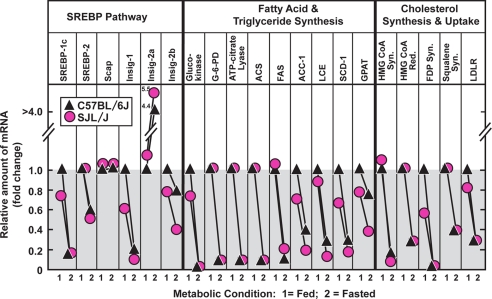
In both mouse strains, fasting caused the expected decrease in hepatic mRNAs encoding sterol regulatory element-binding proteins (SREBPs) and Insig-1, which depend on insulin for high levels of expression (16, 17) (Fig. 3). We also observed the expected declines in mRNAs encoding enzymes of FA, TG, and cholesterol synthesis, which depend on SREBPs for high level expression (16). All of these declines were similar in C57BL/6J and SJL/J mice, consistent with the similar fasting-induced drop in insulin in the two strains (Table 1). The drop in insulin also led to the expected rise in Insig-2 mRNA in both strains (Fig. 3).
FIGURE 3.
Relative amounts of mRNAs encoding SREBP pathway components and SREBP targets in livers from C57BL/6J and SJL/J under fed and fasted conditions. Male C57BL/6J and SJL/J mice (9 weeks of age) were fed a chow diet ad libitum or fasted for 24 h. Total RNA from 6 livers from each strain were pooled and quantified by real-time PCR as described under “Experimental Procedures.” Each value represents the amount of mRNA relative to that in the liver of fed C57BL/6J, which is arbitrarily defined as 1.0. ACS, acetyl-CoA synthetase; G6PD, glucose-6-phosphate dehydrogenase; ACC-1, acetyl-CoA carboxylase-1; FAS, fatty acid synthase; LCE, long-chain fatty acyl elongase; SCD-1, stearoyl-CoA desaturase-1; GPAT, glycerol-3-phosphate acyltransferase; FDP Syn, farnesyl diphosphate synthase; LDLR, low density lipoprotein receptor. Similar results were obtained in two other independent experiments.
Fasting Leads to Switching of Energy Source from Carbohydrate to Fat in Both C57BL/6J and SJL/J Mice
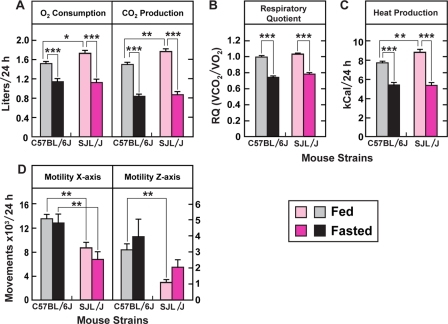
We compared the metabolic response to fasting in C57BL/6J and SJL/J mice using the Oxymax Lab Animal Monitoring System. As shown in Fig. 4A, in the fed state O2 consumption and CO2 production in SJL/J mice were slightly higher than in C57BL/6J mice. After 24-h fasting, O2 consumption and CO2 production were reduced to comparable levels in both strains of mice. The respiratory quotient, an indicator of energy source, was 1.0 in both C57BL/6J and SJL/J mice under fed conditions and decreased to 0.75 in both strains under fasted conditions, confirming a switch from carbohydrate to fat oxidation (Fig. 4B). Calculated heat production, which was based on the measured O2 consumption and the respiratory quotient, was also comparable between fasted C57BL/6J and SJL/J mice (Fig. 4C). We noted that horizontal and vertical movements of SJL/J mice were significantly lower than those of C57BL/6J mice under both fed and fasted conditions (Fig. 4D).
FIGURE 4.
Metabolic responses to fasting in C57BL/6J and SJL/J mice. Male C57BL/6J and SJL/J mice (9 weeks of age) were fed a chow diet ad libitum prior to study. All mice were housed individually in Oxymax monitoring cages and acclimated for 24 h. Data were then collected every 39 min for 72 h. On the fourth day, food was removed, and the animals were fasted for the following 24 h, during which the fasted measurements were made. The indicated parameters are expressed per 24 h period per animal. Each bar represents the mean ± S.E. of values from six mice. Asterisks denote the level of statistical significance between the indicated groups of animals shown in the figure. *, p < 0.05; **, p < 0.01; ***, p < 0.001. Similar results were obtained in two other independent experiments.
Effects of Fasting on FA Synthesis and Esterification in C57BL/6J and SJL/J Mice
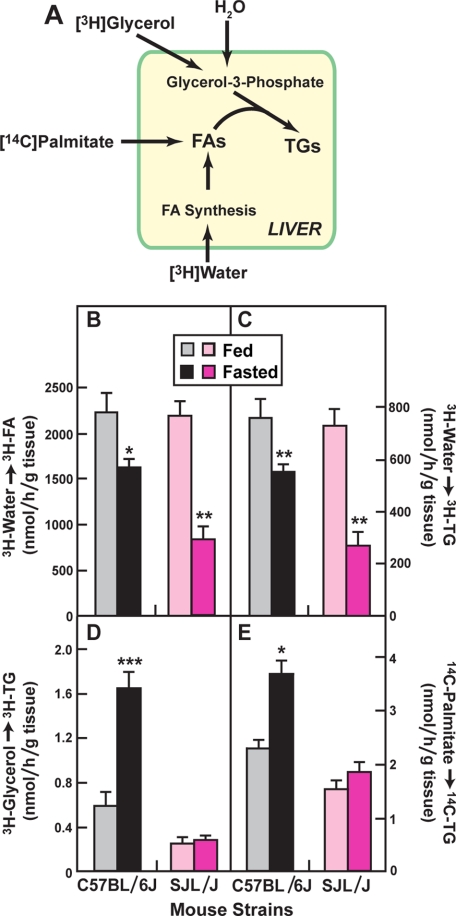
To determine the rates of de novo FA synthesis and FA incorporation into TG, we injected mice with radioactive tracers and measured the incorporation into labeled FA and TG in liver (Fig. 5A). When [3H]water was injected intraperitoneally, the incorporation into hepatic FA and TG was reduced by fasting both in C57BL/6J and SJL/J mice (Fig. 5, B and C), although the reduction in SJL/J mice was somewhat greater. The incorporation of [3H]glycerol and [14C]palmitate into TG increased significantly in the C57BL/6J livers, but not in the SJL/J livers (Fig. 5, D and E). In the C57BL/6J livers, the combination of decreased de novo fatty acid synthesis (Fig. 5B) and increased glycerol incorporation into TG (Fig. 5D) indicates that blood-derived FA constitute the major source of hepatic TG in the fasted mice.
FIGURE 5.
In vivo rates of FA and TG synthesis in livers from fed and fasted C57BL/6J and SJL/J mice. A, schematic diagram of the isotopes used to measure synthesis of FA and TG. B–E, incorporation of [3H]water (B and C), [3H]glycerol (D), and sodium [14C]palmitate-albumin (E) into FA (C), and TG (B, D, E) was measured in living male mice (8–10 weeks of age) as described under “Experimental Procedures.” Each bar represents the mean ± S.E. of values from four mice. Asterisks denote the level of statistical significance between fed and fasted mice of the same strain. *, p < 0.05; **, p < 0.01; ***, p < 0.001. Similar results for D and E were obtained in one other independent experiment. The [3H]water experiments in B and C were done only once.
In the experiments of Fig. 5E, we measured the incorporation of [14C]palmitate into TG without correcting for the difference in dilution attributable to the difference in serum levels of unlabeled palmitate in fed and fasted C57BL/6J and SJL/J mice. Differential dilution did not pose a problem when [3H]glycerol was used as the tracer because the C57BL/6J and SJL/J mice have similar serum levels of glycerol under both fed and fasted conditions (Table 1). However, when [14C]palmitate was used, the tracer was diluted to a different extent by the different levels of serum FA in fasted C57BL/6J mice (1.3 mm) and SJL/J mice (0.57 mm). If one corrects for this differential dilution of the isotope, the relative rate of total FA incorporation into TG in fasted C57BL/6J mice would be increased by 2-fold, enhancing the difference between the two strains even more than shown in Fig. 5E.
Infusion of FA into Fasted SJL/J Mice Leads to Accumulation of TG in Liver
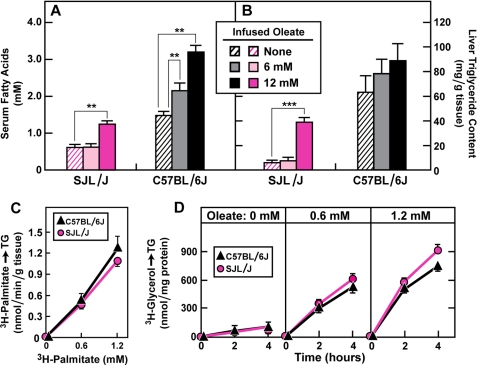
We next conducted a fatty acid infusion experiment designed to determine whether the livers of SJL/J mice are capable of increasing their TG content when the serum FA level is increased by FA infusion so that it reaches the level observed in fasted C57BL/6J mice. When no FA were infused, the fasting concentration of serum FA was 1.5 mm in C57BL/6J mice and 0.51 mm in SJL/J mice (Fig. 6A). Infusion of a solution containing 6 mm oleate into SJL/J mice failed to increase serum FA levels (Fig. 6A) and failed to increase hepatic TG levels (Fig. 6B). Increasing the infusion concentration to 12 mm raised FA levels to 1.3 mm in fasted SJL/J mice, which was 87% of the value seen in non-infused fasted C57BL/6J mice (Fig. 6A). Correspondingly, the liver TG concentration in SJL/J mice rose to 38.9 mg/g, which was 46% of the value seen in non-infused C57BL/6J mice (Fig. 6B). These data indicate that fasted SJL/J livers are capable of synthesizing TG if sufficient amounts of FA reach them.
FIGURE 6.
Relationship between serum FA concentration and liver TG synthesis in fasted mice. All mice were 8–9 weeks of age at the time of the experiments. A and B, serum FA concentration (A) and liver TG content (B) in fasted male C57BL/6J and SJL/J mice infused for 30 min with 0, 6, and 12 mm sodium oleate-albumin as described under “Experimental Procedures.” Asterisks denote the level of statistical significance between groups of animals as shown in the figures. **, p < 0.01; ***, p < 0.001. C, TG synthesis from [3H]palmitate in livers of fasted C57BL/6J and SJL/J mice perfused for 1 min with 20 nm sodium [3H]palmitate-albumin (111 × 106 dpm/nmol) in the presence of the indicated concentration of unlabeled sodium palmitate-albumin. D, TG synthesis in primary hepatocytes isolated from fasted C57BL/6J and SJL/J mice and incubated at 37 °C for the indicated time with 1.5 mm [3H]glycerol (14.6 × 10³ dpm/nmol). Each bar represents the mean ± S.E. of values from four mice.
To test the TG-synthesizing capability of the SJL/J livers more directly, we used liver perfusion (Fig. 6C). Fasted C57BL/6J mice and SJL/J mice were killed, blood was flushed from the liver, and solutions containing varying concentrations of [3H]palmitate were infused for 1 min into the portal vein. The livers were then flushed and excised, and the amount of [3H]palmitate incorporated into [3H]TG was measured. When equal concentrations of [3H]palmitate were infused, the SJL/J livers and the C57BL/6J livers synthesized identical amounts of [3H]TG (Fig. 6C). In a final set of experiments, we isolated hepatocytes from C57BL/6J and SJL/J mice and incubated the cells in vitro with [3H]glycerol in the presence of various concentrations of oleate. The rate of [3H]glycerol incorporation into [3H]TG was indistinguishable in the two sets of hepatocytes at all concentrations of oleate tested (Fig. 6D).
Differential Tissue Distribution of FA in Fasted C57BL/6J and SJL/J Mice
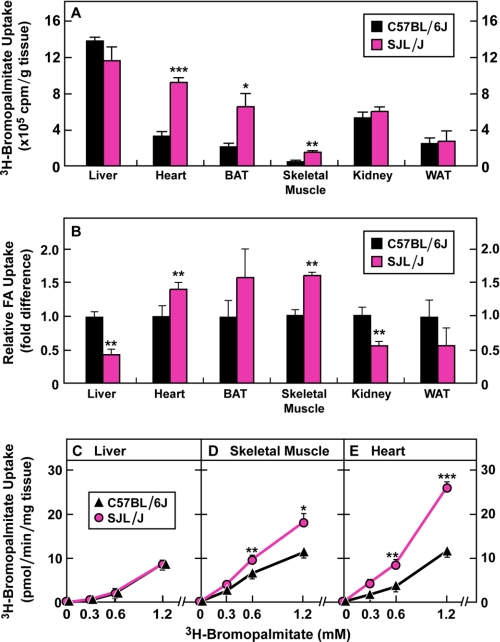
To determine the fate of serum FA in fasted C57BL/6J and SJL/J mice, we infused mice intravenously with an unmetabolizable FA, [3H]bromopalmitate, and then measured the 3H-radioactivity in different tissues. As shown in Fig. 7A, when isotope dilution was not considered, the uptake of [3H]bromopalmitate was comparable in livers from C57BL/6J and SJL/J mice. On the other hand, [3H]bromopalmitate uptake was higher in other tissues (heart, brown adipose tissue, and skeletal muscle) in the fasted SJL/J mice. When we corrected for isotopic dilution by the different serum levels of FA in fasted C57BL/6J mice (1.21 mm) and SJL/J mice (0.57 mm), the corrected total FA uptake was 2.3-fold higher in C57BL/6J liver compared with SJL/J liver (Fig. 7B). Conversely, the corrected values for FA uptake in heart and skeletal muscle were 1.4- and 1.6-fold higher, respectively, in SJL/J mice than in C57BL/6J mice. The corrected FA uptake in white and brown adipose tissue was not significantly different in the two strains (Fig. 7B).
FIGURE 7.
Uptake of FA in different tissues of fasted C57BL/6J and SJL/J mice in vivo and in vitro. All mice were 20 weeks of age at the time of the experiments. A, uptake of [3H]bromopalmitate in different tissues of fasted male C57BL/6J and SJL/J mice 1 min after injection of 39 × 106 cpm of sodium [3H]bromopalmitate-albumin (1 nmol) into the jugular vein. Measurements were carried out as described under “Experimental Procedures.” Each bar represents the mean ± S.E. of values from four mice. BAT, brown adipose tissue; WAT, white adipose tissue. B, relative FA uptake in different tissues of fasted male C57BL/6J and SJL/J mice after correction for isotopic dilution. Total FA uptake was estimated based on the measured uptake of [3H]bromopalmitate in A and the total serum concentration of FA in each mouse. The mean values for serum FA concentrations in the C57BL/6J and SJL/J mice were 1.21 and 0.57 mm, respectively. Each value in the SJL/J mice is expressed relative to that in the C57BL/6J mice, which is set at 1.0. C-E, uptake of [3H]bromopalmitate in isolated tissues from fasted male C57BL/6J and SJL/J mice. The indicated tissue (50 or 150 mg) was incubated for 0 and 10 min at 37 °C with the indicated concentration of [3H]bromopalmitate-albumin (2000 dpm/nmol) as described under “Experimental Procedures.” Measurements were carried out, and blank values (zero-time incubations) were determined as described under “Experimental Procedures.” Each data point represents the mean ± S.E. of values from four mice. A–E, asterisks (*) denote the level of statistical significance between fed and fasted mice. *, p < 0.05; **, p < 0.01; ***, p < 0.001.
Fig. 7C shows an experiment in which we measured the uptake of FA in vitro in liver, gastrocnemius muscle, and heart from fasted C57BL/6J and SJL/J mice. No significant difference in the [3H]bromopalmitate uptake was found in the liver (Fig. 7C), whereas in both skeletal and cardiac muscle [3H]bromopalmitate uptake was significantly higher in SJL/J than in C57BL/6J mice (Fig. 7, D and E). Similar results were observed in an independent experiment.
Elevated FA Oxidation in Skeletal Muscle of SJL/J Mice Correlates with Lack of Fasting-induced Fatty Liver
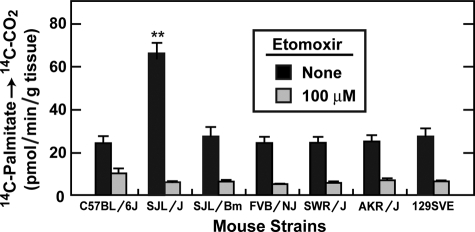
The results thus far suggest that FA released from adipose tissue during fasting have different fates in SJL/J and C57BL/6J mice. In SJL/J mice, the FA are taken up preferentially by muscle. In C57BL/6J mice, a higher fraction of FA escape muscle uptake and reach the liver where they are re-esterified and stored in TG. To determine the fate of the FA taken up by muscle, we incubated skeletal muscle sections in vitro with [14C]palmitate and measured its oxidation to [14C]CO2 (Fig. 8). The experiment was carried out in the absence and presence of etomoxir, an inhibitor of carnitine palmitoyltransferase-1 (CPT-1), the enzyme required for uptake of long chain FA into mitochondria for oxidation (1). We compared these reactions in skeletal muscle fragments from mice in all 7 strains shown in Fig. 1A. FA oxidation in SJL/J muscle was 2-fold greater than seen in any of the other strains (Fig. 8). In all strains, FA oxidation was blocked by etomoxir. Similar results were observed in an independent experiment. In data not shown, we quantified the amount of mitochondria in liver, skeletal muscle, and heart of fasted C57BL/6J and SJL/J mice by determining the ratio of mitochondrial DNA to genomic DNA (18). No significant difference was found in any of these tissues between these two strains, suggesting that an increase in mitochondria is not the explanation for the increased FA oxidation in SJL/J muscle.
FIGURE 8.
Oxidation of FA in skeletal muscle. Portions of gastrocnemius muscle (150 mg) from the indicated strain of male C57BL/6J and SJL/J mice that had been fasted for 24 h were incubated with 11 μm sodium [14C]palmitate-albumin (18 dpm/pmol) in the absence or presence of 100 μm etomoxir for 5 min at 37 °C. The amount of radioactivity incorporated into [14C]CO2 was determined as described under “Experimental Procedures.” All mice were 15 weeks of age except for FVB/NJ (12 weeks) and 129SVE (18 weeks). The 7 strains of mice were studied in the same experiment. Asterisk (*) denotes the level of statistical significance (Student's t test) between SJL/J and other strains of mice. **, p < 0.01. Each bar represents the mean ± S.E. of values from four mice.
DISCUSSION
The current studies began with the observation that C57BL/6J mice and SJL/J mice differ dramatically in their susceptibility to fasting-induced hepatic steatosis even though mice from both strains lose about 60% of their total body TG after a 24 h fast (Table 1). In both strains, the bulk of the fatty acids are oxidized to CO2. However, in C57BL/6J mice, but not SJL/J mice, a fraction of the fatty acids accumulate in liver where they are converted to triglycerides. In C57BL/6J mice, hepatic TG accumulation is sufficient to cause frank steatosis as documented by a grossly pale appearance and by oil red O staining (Fig. 1E).
In an attempt to determine which of the two mouse strains is typical, we examined the occurrence of fatty liver in fasted mice from 5 additional inbred strains. All 5 of the strains developed steatosis upon fasting like the C57BL/6J mice. We concluded, therefore, that the SJL/J mice are atypical and launched a series of studies to determine the reason for their failure to accumulate hepatic fat.
An important clue came from the observation that serum-free FA failed to increase upon fasting in SJL/J mice as they did in C57BL/6J mice (Table 1 and Fig. 1). Moreover, the increase in liver-derived ketone bodies, as indicated by the serum concentration of β-hydroxybutyrate, was much less in SJL/J mice than in C57BL/6J mice (Table 1 and Fig. 1). These data suggested that smaller amounts of adipose-derived FA were reaching the liver for storage or oxidation to ketones in fasted SJL/J mice than in C57BL/6J mice. This conclusion was supported by the finding that SJL/J livers were just as capable of synthesizing TG when the livers were presented with equal concentrations of fatty acids, either through in situ liver perfusion (Fig. 6C) or by incubation of isolated hepatocytes in vitro (Fig. 6D).
If excess FA were not reaching the liver in SJL/J mice, where were they going? Studies of FA uptake in vivo, as measured with [3H]bromopalmitate, indicated that heart and skeletal muscle of fasted SJL/J mice took up twice as much FA as compared with C57BL/6J mice (Fig. 7, A and B). These organs also took up excess FA when incubated with [3H]bromopalmitate in vitro (Fig. 7, D and E). Enhanced uptake correlated with increased FA oxidation in muscle from SJL/J mice (Fig. 8).
Considered together, the data suggest that C57BL/6J mice and SJL/J mice oxidize nearly the same amount of FA upon fasting, but the sites of oxidation differ. In SJL/J mice, a substantial proportion of FA oxidation occurs in muscle and heart. In C57BL/6J, there is less FA uptake into these organs. As a result, the liberated FA reaches the liver where they are oxidized to ketone bodies or stored as TG. In the C57BL/6J mice, some of the hepatic triglycerides are secreted in VLDL. The secreted VLDL-triglycerides plus the ketone bodies serve as a source of substrate for oxidation in muscle. Thus, the total amount of carbons subjected to oxidation in muscle of C57BL/6J mice and SJL/J mice may be similar. The difference is the route by which these carbons reach the muscle. In the SJL/J mice, the carbons reach the muscle directly in the form of fatty acids released from adipose tissue. In the C57BL/6J mice, the fatty acids bypass the muscle and enter the liver, where they are converted to substances that can be taken up more readily by muscle. We cannot exclude the possibility that tissues other than muscle help to direct fatty acids from the liver in fasted SJL/J mice. Considering the relatively large size of muscle mass in the mouse (up to 40% of body weight) (19), it seems clear that the accelerated FA uptake in muscle accounts for most of the diversion.
SJL mice were developed at the Jackson Laboratory in 1955 from 30 generations of repeated brother and sister matings from descendants of three different sources of Swiss Webster mice (20). Among other traits, these mice have a late-onset form of muscular dystrophy, owing to a mutation in the gene encoding Dysferlin, a muscle protein (21, 22). Muscle weakness becomes apparent after 6 months of age. Our SJL/J mice were studied before 5 months of age and typically at 2–3 months of age. We do not believe that the Dysferlin mutation accounts for the high rate of muscle fatty acid uptake in SJL/J mice since we found the same mutation by PCR of genomic DNA from SJL/Bm mice, a closely related strain (see Fig. 1A). The SJL/Bm mice show a normal response to fasting in terms of elevated serum FA, serum ketone bodies, and hepatic TG (Fig. 1, B-D).
A family tree of inbred mouse strains was constructed by Petkov et al. (15) based on an analysis of 1638 polymorphic markers (see Fig. 1A). SJL/J and C57BL/6J mice reside on widely separated branches of this family tree (Groups 2 and 6, respectively). They differ at 734 of the 1638 loci. On the other hand, SJL/J mice are closely related to FVB/NJ mice, differing at only 328 of the 1638 loci. The SJL/Bm mice are even more closely related to the SJL/J mice (Fig. 1A). Nevertheless, the FVB/NJ and SJL/Bm mice show normal hepatic triglyceride accumulation upon fasting (Fig. 1B). The all-or-none difference between the response of SJL/J mice and closely related strains raises the possibility that the accelerated muscle FA uptake and consequent protection from fasting-induced steatosis in SJL/J mice may be due to a mutation at a single locus. We are currently conducting gene mapping studies to determine whether such a locus exists and to identify it.
Acknowledgments
We thank Nicole Muriithi, Isis Soto, and Daniel D. Smith for excellent technical assistance. We also thank our colleagues Hiroaki Okazaki and Jay Horton for helpful comments, and Jay Horton and David W. Russell for critical review of the manuscript.
This work was supported, in whole or in part, by Grants HL20948 and DK81182 from the National Institutes of Health. This work was also supported by the Moss Heart Foundation and Perot Family Foundation.
- TG
- triglyceride(s)
- CPT-1
- carnitine palmitoyltransferase-1
- FA
- fatty acid(s)
- PBS
- phosphate-buffered saline
- VLDL
- very low density lipoproteins
- SREBP
- sterol regulatory element-binding protein.
REFERENCES
- 1.McGarry J. D., Foster D. W. (1980) Annu. Rev. Biochem. 49, 395–420 [DOI] [PubMed] [Google Scholar]
- 2.Cahill G. F., Jr. (2006) Annu. Rev. Nutr. 26, 1–22 [DOI] [PubMed] [Google Scholar]
- 3.Havel R. J. (1997) Proc. Nutr. Soc. 56, 659–666 [DOI] [PubMed] [Google Scholar]
- 4.Matsuda M., Korn B. S., Hammer R. E., Moon Y. A., Komuro R., Horton J. D., Goldstein J. L., Brown M. S., Shimomura I. (2001) Genes Dev. 15, 1206–1216 [DOI] [PMC free article] [PubMed] [Google Scholar]
- 5.Liang G., Yang J., Horton J. D., Hammer R. E., Goldstein J. L., Brown M. S. (2002) J. Biol. Chem. 277, 9520–9528 [DOI] [PubMed] [Google Scholar]
- 6.Kuriyama H., Liang G., Engelking L. J., Horton J. D., Goldstein J. L., Brown M. S. (2005) Cell Metabolism 1, 41–51 [DOI] [PubMed] [Google Scholar]
- 7.Lin X., Yue P., Chen Z., Schonfeld G. (2005) Am. J. Physiol. Gastrointest. Liver Physiol. 288, G1179–G1189 [DOI] [PubMed] [Google Scholar]
- 8.Hannah V. C., Ou J., Luong A., Goldstein J. L., Brown M. S. (2001) J. Biol. Chem. 276, 4365–4372 [DOI] [PubMed] [Google Scholar]
- 9.Goldstein J. L., Basu S. K., Brown M. S. (1983) Methods Enzymol. 98, 241–260 [DOI] [PubMed] [Google Scholar]
- 10.Folch J., Lees M., Sloan Stanley G. H. (1957) J. Biol. Chem. 226, 497–509 [PubMed] [Google Scholar]
- 11.Shimano H., Horton J. D., Hammer R. E., Shimomura I., Brown M. S., Goldstein J. L. (1996) J. Clin. Invest. 98, 1575–1584 [DOI] [PMC free article] [PubMed] [Google Scholar]
- 12.McGarry J. D., Foster D. W. (1971) J. Biol. Chem. 246, 1149–1159 [PubMed] [Google Scholar]
- 13.Yang J., Goldstein J. L., Hammer R. E., Moon Y. A., Brown M. S., Horton J. D. (2001) Proc. Natl. Acad. Sci. U.S.A. 98, 13607–13612 [DOI] [PMC free article] [PubMed] [Google Scholar]
- 14.Cui Y., Huang L., Elefteriou F., Yang G., Shelton J. M., Giles J. E., Oz O. K., Pourbahrami T., Lu C. Y., Richardson J. A., Karsenty G., Li C. (2004) Mol. Cell. Biol. 24, 258–269 [DOI] [PMC free article] [PubMed] [Google Scholar]
- 15.Petkov P. M., Ding Y., Cassell M. A., Zhang W., Wagner G., Sargent E. E., Asquith S., Crew V., Johnson K. A., Robinson P., Scott V. E., Wiles M. V. (2004) Genome Res. 14, 1806–1811 [DOI] [PMC free article] [PubMed] [Google Scholar]
- 16.Horton J. D., Goldstein J. L., Brown M. S. (2002) J. Clin. Invest. 109, 1125–1131 [DOI] [PMC free article] [PubMed] [Google Scholar]
- 17.Yabe D., Komuro R., Liang G., Goldstein J. L., Brown M. S. (2003) Proc. Natl. Acad. Sci. U.S.A. 100, 3155–3160 [DOI] [PMC free article] [PubMed] [Google Scholar]
- 18.He L., Chinnery P. F., Durham S. E., Blakely E. L., Wardell T. M., Borthwick G. M., Taylor R. W., Turnbull D. M. (2002) Nucleic Acids Res. 30, e68–1-e68–6 [DOI] [PMC free article] [PubMed] [Google Scholar]
- 19.Yang J., Ratovitski T., Brady J. P., Solomon M. B., Wells K. D., Wall R. J. (2001) Mol. Reprod. Dev. 60, 351–361 [DOI] [PubMed] [Google Scholar]
- 20.Crispens C. G. (1973) Lab. Anim. Sci. 23, 408–413 [PubMed] [Google Scholar]
- 21.Bittner R. E., Anderson L. V., Burkhardt E., Bashir R., Vafiadaki E., Ivanova S., Raffelsberger T., Maerk I., Höger H., Jung M., Karbasiyan M., Storch M., Lassmann H., Moss J. A., Davison K., Harrison R., Bushby K. M., Reis A. (1999) Nat. Genet. 23, 141–142 [DOI] [PubMed] [Google Scholar]
- 22.Vafiadaki E., Reis A., Keers S., Harrison R., Anderson L. V., Raffelsberger T., Ivanova S., Hoger H., Bittner R. E., Bushby K., Bashir R. (2001) NeuroReport 12, 625–629 [DOI] [PubMed] [Google Scholar]


