Abstract
Protein kinase D (PKD) transduces an abundance of signals downstream of diacylglycerol production. The mammalian PKD family consists of three isoforms, PKD1, PKD2, and PKD3; of these PKD1 and PKD2 contain PDZ-binding motifs at their carboxyl termini. Here we show that membrane-localized NHERF scaffold proteins provide a nexus for tightly controlled PKD signaling via a PDZ domain interaction. Using a proteomic array containing 96 purified PDZ domains, we have identified the first PDZ domain of NHERF-1 as an interaction partner for the PDZ-binding motifs of both PKD1 and PKD2. A fluorescence resonance energy transfer-based translocation assay reveals a transient association of PKD1 and PKD2 with NHERF-1 in live cells that is triggered by phorbol ester stimulation and, importantly, differs strikingly from the sustained translocation to plasma membrane. Targeting a fluorescence resonance energy transfer-based kinase activity reporter for PKD to NHERF scaffolds reveals a unique signature of PKD activation at the scaffold that is distinct from that of general cytosolic or plasma membrane activity. Specifically, agonist-evoked activation of PKD at the scaffold is rapid and sustained but blunted in magnitude when compared with cytosolic PKD. Thus, live cell imaging of PKD activity demonstrates ultrasensitive control of kinase signaling at the scaffold compared with bulk activity in the cytosol or at the plasma membrane.
Protein kinase D (PKD)2 plays a role in numerous processes including cell proliferation, cell survival, immune cell signaling, gene expression, vesicle trafficking, and neuronal development (1). The PKD family consists of three members belonging to the Ca2+/calmodulin-dependent kinase group of serine/threonine protein kinases. Each isoform contains a conserved catalytic core and an amino-terminal regulatory moiety. This regulatory region contains two cysteine-rich (C1) domains and a pleckstrin homology domain that autoinhibits the kinase (2). The C1 domains are membrane-targeting modules that bind diacylglycerol (DAG) and its functional analogues, phorbol esters, thus recruiting PKD to membranes (3). The PKD1 and PKD2 isoforms additionally contain PDZ-binding motifs at their carboxyl termini that can target the kinases to distinct subcellular scaffolds through interactions with PDZ domain-containing proteins (4).
PKD transduces signals downstream of the second messenger DAG. In addition to membrane recruitment by DAG, activation of PKD requires phosphorylation by novel protein kinase C (PKC) family members at two sites within its catalytic core (5, 6). The novel PKCs themselves contain C1 domains and are allosterically activated by DAG-mediated membrane binding; thus, DAG production leads to PKD activation through coincident activation of the novel PKCs and localization of PKD near its upstream kinases. Hence, activation of phospholipase C (PLC)-coupled receptors (such as certain G protein-coupled receptors (GPCRs) or receptor tyrosine kinases) results in the production of second messengers including DAG, and this leads to recruitment and activation of the novel PKCs and thus also PKD.
PDZ (PSD-95, Discs large, ZO-1) domains are compact, globular structures of ∼90 residues, occurring in one or multiple copies within a protein, that mediate protein-protein interactions (7). These interactions occur via binding to other PDZ domains or, more commonly, by recognition of short amino acid motifs in the carboxyl termini of target proteins commonly terminating in a hydrophobic residue (8). In the case of PKD1 and PKD2, the last four amino acids are VSIL and ISVL, respectively. Here we identify Na+/H+ exchanger regulatory factor 1 (NHERF-1) as a PDZ domain-containing protein that interacts with the PDZ-binding motif of both PKD1 and PKD2.
NHERF-1 was originally cloned as a critical protein component for the inhibition of Na+/H+ exchanger 3 by protein kinase A (9). NHERF-1 is 52% identical to NHERF-2, a family member with which it shares the conserved domain structure of two PDZ domains followed by an ezrin-radixin-moesin (ERM)-binding region (10). Parallel studies demonstrating its ability to strongly interact with ezrin independently identified NHERF-1 as ERM-binding phosphoprotein 50 (11). Via this ERM-binding region, NHERF-1 and NHERF-2 are predominantly localized near the actin cytoskeleton, thus poising them near the plasma membrane where they function as scaffolds. Since these original cloning reports, numerous studies have identified over 30 binding partners of these scaffold proteins including GPCRs, tyrosine kinase receptors, other adaptor proteins, signaling enzymes, and ion channels (12, 13).
Here we identify PKD1 and PKD2 as NHERF-1-interacting proteins. Using a fluorescence resonance energy transfer (FRET)-based assay to assess molecular proximity, both PKD1 and PKD2 are shown to transiently associate with NHERF-1 following PKD activation. Furthermore, through use of genetically encoded reporters for PKD activity, we show a unique signature of PKD activation at the NHERF scaffold. Specifically, signaling is more tightly regulated at the scaffold than in the cytosol or bulk plasma membrane. Phosphatase activity is higher at NHERF than at the plasma membrane, resulting in a more rapidly reversible PKD response at the scaffold, and following an agonist-evoked response, PKD signaling is prolonged compared with the length of response in the cytosol. Our data identify NHERF-1 as a novel nexus of PKD signaling and raise the possibility that PKD may act as a novel regulator of proteins at the NHERF scaffold.
EXPERIMENTAL PROCEDURES
Materials
Phorbol 12,13-dibutyrate (PDBu), Gö 6976, and Gö 6983 were obtained from Calbiochem. Histamine was from Sigma-Aldrich. Restriction enzymes, T4 ligase, and Taq polymerase were obtained from New England Biolabs. LR and BP clonase were obtained from Invitrogen. NHERF-1 (ERM-binding phosphoprotein 50) antibody was obtained from Abcam. Phospho-PKD substrate antibody was from Cell Signaling Technology. All other materials were reagent grade.
Plasmid Constructs
DNA encoding the carboxyl-terminal (CT) 25 amino acids of PKD1 or PKD2 was ligated into the pGEX-6P-3 vector (Amersham Biosciences) to generate an in-frame fusion to GST. DKAR has been described previously (14). δCKAR was generated by modification of the peptide sequence in CKAR (15) to one specifically phosphorylated by PKCδ.3 All of the CFP and YFP DNA utilized were the monomeric versions harboring the A206K mutations (16). The membrane-targeted CFP (MyrPalmCFP) was described previously (15). DNA encoding the last 10 amino acids of PHLPP2 (17) was fused in-frame to CFP, DKAR, and δCKAR to create CFP-PDZ, DKAR-PDZ, and δCKAR-PDZ, respectively. FLAG-NHERF-1 was used in overexpression studies and has been described previously (18). CFP-NHERF-1 was generated by subcloning NHERF-1 DNA into a plasmid containing monomeric CFP, resulting in an in-frame fusion to the amino terminus of NHERF-1. mCherry-NHERF-1 was generated by Gateway cloning (Invitrogen) into a Gateway destination vector for NH2-terminal fusion of monomeric Cherry (mCherry) (19). YFP was ligated to PKD1 and PKD2 to create amino-terminally tagged PKD1 and PKD2 (YFP-PKD1 and YFP-PKD2, respectively). YFP-PKD2ΔPDZ was generated by deleting the last three amino acids of PKD2 within YFP-PKD2 following the QuikChange protocol (Stratagene).
Protein Expression and Purification
Expression of GST, GST-PKD1-CT, and GST-PKD2-CT was induced for 4 h with 0.3 mm isopropyl β-d-thiogalactopyranoside in BL21(DE3) Escherichia coli. Pelleted cells were homogenized in 50 mm Tris, pH 7.5, 200 mm NaCl, 1 mm EDTA, 1 mm dithiothreitol, containing 300 nm phenylmethylsulfonyl fluoride, 500 nm benzamidine, 500 ng ml−1 leupeptin, and 1 mg ml−1 lysozyme and rocked for 30 min at 4 °C followed by brief bath sonication. The lysate was treated with 100 μg ml−1 DNase and cleared by centrifugation at 14,000 × g for 30 min at 4 °C. GST fusion proteins were purified from the lysate using the Profinia Protein Purification System according to the manufacturer's specifications (Bio-Rad). The eluted, purified protein was dialyzed against 20 mm HEPES, pH 7.5, 50 mm NaCl.
Overlay Assay
Membranes containing 96 putative PDZ domains were prepared as described (20). 1 mg ml−1 of purified GST, GST-PKD1-CT, or GST-PKD2-CT fusion protein was overlaid onto the array and detected by far Western blotting as described previously (18).
Cell Transfection
MDCK cells were maintained in Dulbecco's modified Eagle's medium/F-12 (Cellgro) containing 10% fetal bovine serum and 1% penicillin/streptomycin at 37 °C in 5% CO2. HeLa cells were maintained in Dulbecco's modified Eagle's medium (Cellgro) containing 10% fetal bovine serum and 1% penicillin/streptomycin at 37 °C in 5% CO2. The cells were plated onto sterilized glass coverslips in 35-mm dishes prior to transfection. Transient transfection of 1 μg of DNA was carried out using Effectene (Qiagen) for MDCK cells and FuGENE 6 (Roche Applied Science) for HeLa cells. For translocation experiments, 0.1 μg of MyrPalmCFP or CFP-NHERF-1 DNA was used in transient transfections. The cells were imaged within 24 h following transfection.
Cell Imaging
The cells were washed once in Hanks' balanced salt solution (Cellgro) and imaged in Hanks' balanced salt solution in the dark at room temperature. The cells were stimulated with 200 nm PDBu, 10 μm histamine, 250 nm Gö 6976, or 500 nm Gö 6983 where indicated. CFP, YFP, and FRET images were acquired and analyzed as described (21). mCherry was visualized through a 560/25-nm excitation filter, a 593-nm dichroic mirror, and a 629/53-nm emission filter.
Western Blotting
HeLa cells were grown to 80% confluency in 60-mm dishes and then transfected using Lipofectamine 2000 (Invitrogen) with 20 nm control or NHERF-1 SMARTpool siRNA (Dharmacon). 48 h post-transfection the cells were rinsed in phosphate-buffered saline and then treated for the indicated times with 10 μm histamine at room temperature. The cells were lysed in 50 mm Na2HPO4, 1 mm Na4P2O7, 20 mm NaF, 2 mm EDTA, 2 mm EGTA, 1% Triton X-100 (supplemented with 1 mm dithiothreitol, 200 μm benzamidine, 40 μg ml−1 leupeptin, 300 μm phenylmethylsulfonyl fluoride, and 1 μm microcystin) and cleared by a high speed spin. The cleared lysates were analyzed by Western blotting to determine the relative amount of NHERF-1, phosphorylated PKD substrates, and actin. The Western blots were developed using chemiluminescence and quantified using Image J (National Institutes of Health).
RESULTS
The PDZ-binding Motif of PKD1 or PKD2 Interacts with NHERF-1
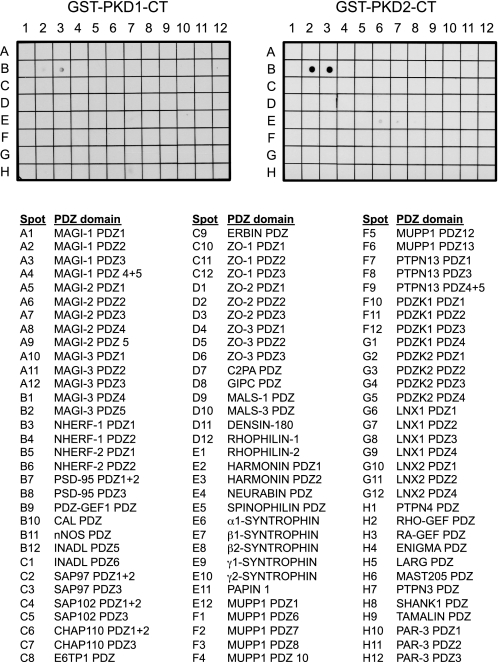
The last four amino acids of both PKD1 and PKD2 (VSIL and ISVL, respectively) comprise a PDZ-binding motif. To identify PDZ domains with which these kinases could interact, a GST fusion protein of the last 25 residues of either PKD1 or PKD2 was overlaid onto a membrane array spotted with 96 unique PDZ domains (20). Binding was detected with GST antibodies. Fig. 1 shows that the PDZ-binding motifs of both PKD1 and PKD2 interact with the first PDZ domain of NHERF-1 (spot B3, NHERF-1 PDZ1). In addition, the PDZ-binding motif of PKD2 bound the fifth PDZ domain of MAGI-3 (spot B2, MAGI-3 PDZ5). No detectable binding was observed when GST alone was overlaid on the array (data not shown).
FIGURE 1.
The PDZ ligands of PKD1 and PKD2 bind to the first PDZ domain of the scaffold NHERF-1. The last 25 residues of PKD1 or PKD2 were fused to GST (GST-PKD1-CT and GST-PKD2-CT, respectively), and the purified fusion proteins were overlaid onto a proteomic array containing 96 PDZ domains. Binding to domains on the overlay was detected with an anti-GST antibody. The purified domain(s) on each spot of the array is listed.
PKD1 and PKD2 Transiently Translocate to NHERF-1
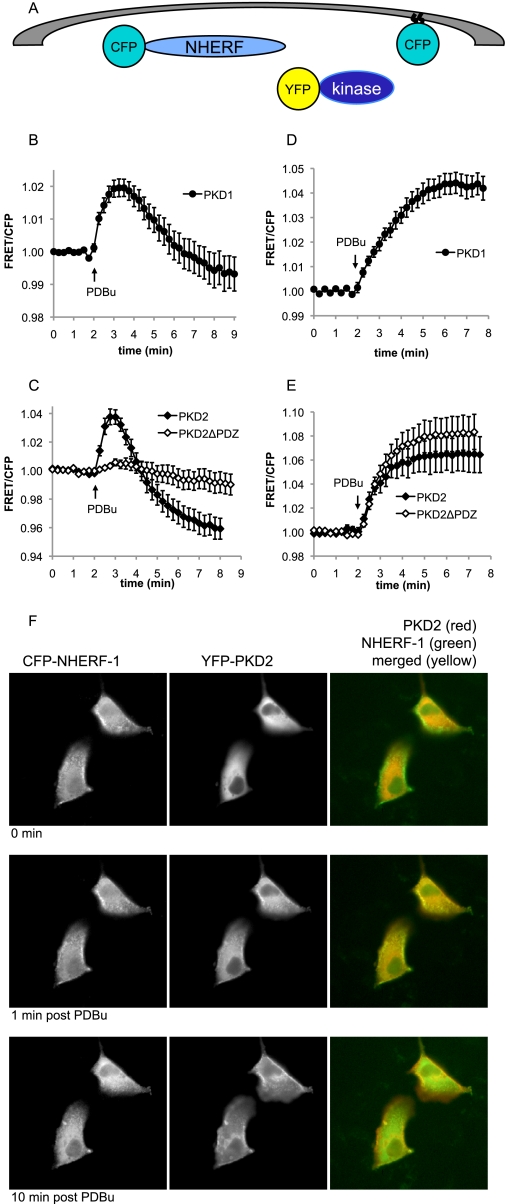
Having identified interactions of the isolated PDZ-binding motifs of PKD1 and PKD2 with NHERF-1, we next addressed whether the full-length proteins could interact in cells. We focused on examining potential cellular associations between the PKD isoforms and NHERF-1 using FRET (Fig. 2A) rather than traditional biochemical approaches, for the following reasons: 1) PDZ domain interactions with PDZ-binding motifs are often weak in nature (22), and 2) the serines within the PDZ-binding motifs of both PKD1 and PKD2 (VSIL and ISVL of PKD1 and PKD2, respectively) are known to become phosphorylated following PKD activation, which would likely destroy the PDZ-binding motifs and further contribute to the transient nature of PKD/NHERF-1 interactions. Because FRET is measured in real time and only occurs when the fluorophores (CFP and YFP in this instance) are within 10 nm of each other, the use of FRET is ideal for allowing the visualization of transient cellular interactions between proteins (23).
FIGURE 2.
PKD1 and PKD2 transiently translocate to NHERF-1. A, schematic representation of the YFP kinase translocation assay to NHERF-1 (CFP-NHERF-1 as the FRET donor) or plasma membrane (MyrPalmCFP as the FRET donor). B–E, CFP-NHERF-1 (B and C) or MyrPalmCFP (D and E) was co-expressed in MDCK cells with YFP-PKD1 (filled circles), YFP-PKD2 (filled diamonds), or YFP-PKD2ΔPDZ (open diamonds). The cells were treated with 200 nm PDBu, and the ratio of yellow to cyan emission (FRET/CFP) was monitored. FRET/CFP ratios were normalized and plotted over time. The data represent the averages ± S.E. from at least two independent experiments. F, fluorescent images of CFP-NHERF-1 (left column) and YFP-PKD2 (middle column) are shown from a representative translocation experiment. The 0-min time point depicts protein localization prior to PDBu addition (top row). The 1-min post PDBu time point (middle row) depicts protein localization at peak FRET as observed in C (filled diamonds), and the 10-min time point shows protein localization at the end of the experiment (bottom row). The merged images (right column) depict co-localization (yellow) of YFP-PKD2 (red) and CFP-NHERF-1 (green) at 1 min after PDBu addition.
CFP-NHERF-1 was co-expressed with either YFP-PKD1 or YFP-PKD2 in MDCK cells, and the change in FRET (plotted as FRET/CFP) was monitored over time following stimulation of the PKD pathway. The data in Fig. 2 (B and C) show that PDBu caused a robust increase in the FRET/CFP ratio for PKD1 and PKD2, revealing translocation of both isoforms to NHERF-1. Phorbol ester-triggered translocation was rapid and transient, peaking within 1 min and then decaying with a half-life of approximately 2 min. This decay of the signal may reflect autophosphorylation at the serine within the PDZ-binding motif of each kinase, because this autophosphorylation event is known to occur with similar kinetics (14). Interestingly, FRET between the PKDs and NHERF-1 decreased to levels below the original base line, suggesting that there was some PKD pre-associated with NHERF-1 prior to PDBu treatment. To verify that this association was dependent on the PDZ-binding motif of the kinase, we generated YFP-PKD2 with its PDZ-binding motif deleted (YFP-PKD2ΔPDZ). No significant changes in FRET were observed following PDBu treatment in cells co-expressing YFP-PKD2ΔPDZ and CFP-NHERF-1 (Fig. 2C, open diamonds). Importantly, all YFP kinase proteins translocated to and remained at the plasma membrane over the same time frame in FRET experiments using MyrPalmCFP as the FRET donor (Fig. 2, D and E).
We next visualized the co-localization of PKD2 and NHERF-1 in cells by fluorescence microscopy. Fig. 2F shows that the CFP-NHERF-1 signal is localized to apical membranes in MDCK cells, as described previously (24), and remains relatively stable over the course of the experiment (left column). In contrast, YFP-PKD2 is present in the cytosol prior to PDBu addition (Fig. 2F, middle column, top panel) and is predominantly at membranes bound to PDBu by the end of the experiment (Fig. 2F, middle column, bottom panel). In support of the FRET data, a high degree of co-localization is apparent after 1 min of PDBu treatment, i.e. when maximal FRET is observed in Fig. 2C (Fig. 2F, middle column, middle panel). This co-localization is further revealed by the yellow signal in the merged images on the right column of Fig. 2F.
Creation of a Reporter for Measuring PKD Activity at NHERF-1
To explore whether the interaction of the PDZ-binding motifs of PKD1 and PKD2 with NHERF coordinates PKD signaling at NHERF scaffolds in cells, we took advantage of a genetically encoded PKD activity reporter, D kinase activity reporter (DKAR) (14), to examine PKD activity at the scaffold. DKAR consists of the FRET pair mCFP (monomeric cyan fluorescent protein) and mYFP (the monomeric version of the yellow fluorescent protein citrine (25)) flanking an FHA2 phosphothreonine-binding domain and a consensus PKD phosphorylation sequence. Phosphorylation of the substrate sequence triggers an intramolecular clamp with the phosphopeptide-binding domain, leading to a change in FRET (14). Both PKD1 and PKD2 efficiently phosphorylate DKAR and induce a change in FRET (data not shown).
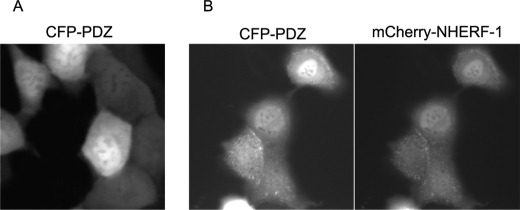
Because it is a genetically encoded reporter, DKAR can be effectively targeted to distinct subcellular compartments by the addition of short targeting sequences (26). Thus, to poise DKAR at the NHERF scaffold to assess localized PKD activity, we designed a reporter with a PDZ-binding motif that would target to NHERF but not necessarily compete with, and potentially disrupt, the interaction of endogenous PKD1 or PKD2 with NHERF-1. To this end, we chose a distinct PDZ-binding motif from the phosphatase PHLPP2 (17) that interacts with both the first and second PDZ domain of NHERF-1 and both PDZ domains of the interacting NHERF-2 (data not shown). To test whether this PDZ-binding motif (which comprises the sequence DTAL) targets to NHERF-1, we expressed a construct of CFP fused to the carboxyl-terminal 10 residues of PHLPP2 in MDCK cells and imaged its localization. Expression of this CFP-PDZ fusion protein alone revealed diffuse cellular staining (Fig. 3A), consistent with no specific targeting. In contrast, co-expression with mCherry-NHERF-1 (Fig. 3B) revealed significant localization of CFP-PDZ to mCherry-NHERF-1 at apical membranes where the NHERF scaffold localizes (24).
FIGURE 3.
CFP can be targeted to NHERF-1 with a short PDZ-binding motif added to its carboxyl terminus. CFP was tagged with a PDZ-binding motif that targets to NHERF proteins (CFP-PDZ). Fluorescent images of CFP-PDZ expressed alone (A) or co-expressed with mCherry-NHERF-1 (B) in MDCK cells are shown.
PKD Activity Is Enriched in the Vicinity of NHERF-1
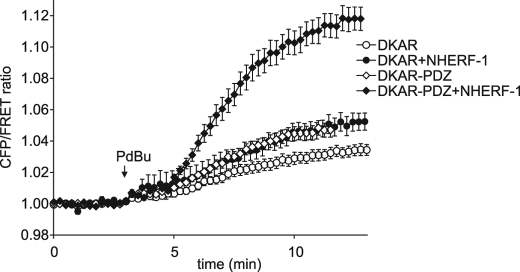
Having identified a PDZ-binding motif distinct from that of PKD1 or PKD2 that targets to NHERF-1, we fused this motif onto DKAR to generate DKAR-PDZ. MDCK cells overexpressing DKAR or DKAR-PDZ with or without overexpression of NHERF-1 were analyzed following stimulation with the phorbol ester PDBu, and the ratio of cyan to yellow emission (FRET ratio) was monitored. The FRET ratio from DKAR (Fig. 4, open circles) and DKAR-PDZ (Fig. 4, open diamonds) increased to similar levels following PDBu treatment. Overexpression of the untargeted DKAR and NHERF-1 gave a similar response (Fig. 4, filled circles). However, co-expression of DKAR-PDZ and NHERF-1 resulted in a significantly enhanced FRET ratio change following PKD activation with PDBu (Fig. 4, filled diamonds); the amplitude of the FRET change increased 2.5-fold. Interestingly, the fluorescent signal from DKAR-PDZ with NHERF-1 overexpressed showed modest, if any, membrane localization (data not shown); however, the increased PKD activity reported by DKAR-PDZ in cells overexpressing NHERF-1 reveals relocalization of the reporter to the scaffold. Note that it is possible that the PDZ ligand on DKAR-PDZ competes some of the endogenous PKD from NHERF-1; however, given the robust and unique DKAR signature at the NHERF scaffold, it is clear that there is sufficient localized PKD to catalyze readily detectable phosphorylation of the reporter poised at NHERF. If anything, the reporter might under-report the true magnitude of PKD activity at the scaffold.
FIGURE 4.
Enhanced PKD signaling at the NHERF scaffold. MDCK cells overexpressing DKAR (circles) or DKAR-PDZ (diamonds) in the absence (open symbols) or presence (closed symbols) of overexpressed NHERF-1 were treated with 200 nm PDBu, and the ratio of cyan emission to yellow emission was monitored with time. FRET ratios were normalized and plotted over time. The data represent the averages ± S.E. from at least three independent experiments.
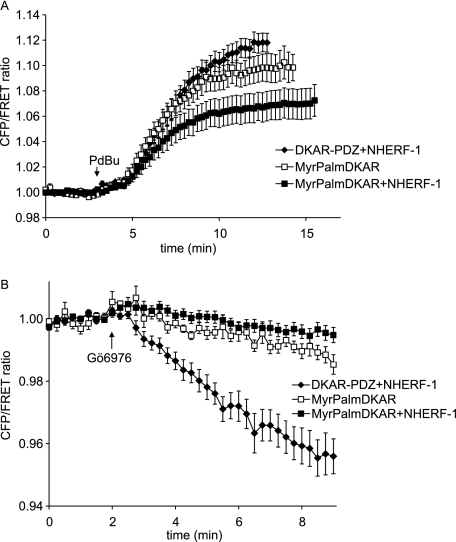
Although DKAR-PDZ is not dramatically relocalized when NHERF-1 is co-expressed, the increased PKD activity observed from the reporter in this context could reflect membrane association, because NHERF-1 is predominantly membrane-associated. To verify that the change in the FRET ratio reflected PKD activity at NHERF-1 as opposed to PKD activity at the plasma membrane, we compared the DKAR signal for reporter scaffolded to NHERF-1 compared with reporter scaffolded to general plasma membrane. Plasma membrane targeting was achieved by the addition of the seven amino-terminal residues derived from Lyn kinase that encode for the myristoylation and palmitoylation of DKAR (MyrPalmDKAR) (16). Treatment of MDCK cells co-expressing MyrPalmDKAR and NHERF-1 (Fig. 5A, filled squares) with PDBu resulted in an almost 2-fold reduction in the amplitude of the FRET ratio change compared with MDCK cells co-expressing DKAR-PDZ with NHERF-1 (Fig. 5A, filled diamonds). Interestingly, expression of MyrPalmDKAR alone, in the absence of NHERF-1 overexpression, resulted in a significant increase in DKAR phosphorylation, suggesting that the scaffold sequestered PKD to NHERF-1 and away from MyrPalmDKAR. These data reveal increased PKD activity at NHERF scaffolds relative to activity at the plasma membrane under conditions where the NHERF-1 protein is overexpressed.
FIGURE 5.
PKD signaling at NHERF-1 is distinct from PKD signaling at the plasma membrane. A, MDCK cells overexpressing DKAR-PDZ and NHERF-1 (closed diamonds), MyrPalmDKAR alone (open squares), or MyrPalmDKAR and NHERF-1 (closed squares) were stimulated with 200 nm PDBu, and the ratio of cyan emission to yellow emission was monitored with time. B, PKD activity in the stimulated cells in A was inhibited following addition of the PKD inhibitor Gö 6976 (500 nm). FRET ratios were normalized and plotted over time. The data represent the averages ± S.E. from at least three independent experiments.
DKAR phosphorylation is reversible, allowing the reporter to read both PKD activation and deactivation (14). To further explore differences in the signature of PKD activity at the NHERF scaffold compared with the plasma membrane, we treated actively signaling cells with the PKD inhibitor Gö 6976 to monitor the rate of DKAR dephosphorylation, in the context of PKD inactivation. Cells expressing DKAR-PDZ with NHERF-1, MyrPalmDKAR with NHERF-1, or MyrPalmDKAR alone were treated with PDBu for 15 min to allow DKAR phosphorylation to plateau, and then cells were treated with the PKD inhibitor. The graph in Fig. 5B shows that inhibition of PKD resulted in rapid dephosphorylation of DKAR-PDZ (filled diamonds) compared with the slow dephosphorylation of MyrPalmDKAR (squares). Thus, the local phosphatase environment around DKAR-PDZ poised at NHERF-1 is relatively high and distinct from the low level of phosphatase activity at the plasma membrane. This distinct response from MyrPalmDKAR indicates that DKAR-PDZ is in fact poised at the NHERF-1 scaffold, and its activity is not simply reflecting PKD signaling at the general plasma membrane.
PKD Signals at NHERF-1 Following Endogenous G Protein-coupled Receptor Activation
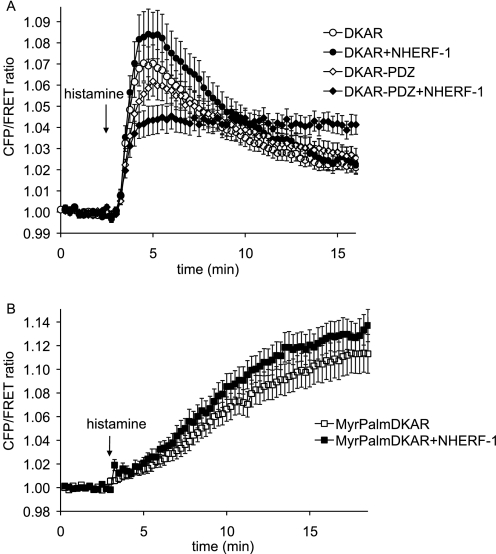
Having established that PKD activity is enriched at NHERF-1 using the potent PKD activator PDBu, we next explored PKD signaling at the scaffold following stimulation of endogenous signaling pathways. Histamine has been shown to activate G protein-coupled receptors in HeLa cells, resulting in the activation of numerous signaling molecules including PKD (14). As described previously, the DKAR response to histamine in HeLa cells is rapid and begins to decay within 2 min (14). Here we expressed DKAR or DKAR-PDZ in HeLa cells with or without NHERF-1 and activated PKD signaling via stimulation of endogenous histamine receptors. The response from DKAR with NHERF-1 or from DKAR-PDZ alone showed a similar transient profile as from DKAR alone (Fig. 6A). However, the FRET response observed from DKAR-PDZ following histamine treatment was significantly different when NHERF-1 was co-expressed; the phosphorylation of DKAR-PDZ was sustained and, additionally, reached a lower initial amplitude than the untargeted reporter (Fig. 6A, filled diamonds). This smaller but prolonged response reflects tight regulation of PKD phosphorylation at NHERF-1 because further PKD stimulation by PDBu did not significantly increase the FRET ratio change, and PKD inhibition by Gö 6976 did not reverse the FRET ratio beyond its base-line value (data not shown).
FIGURE 6.
PKD signaling is prolonged at the NHERF-1 scaffold. A, HeLa cells overexpressing DKAR (circles) or DKAR-PDZ (diamonds) in the absence (open symbols) or presence (closed symbols) of overexpressed NHERF-1 were treated with 10 μm histamine, and the ratio of cyan emission to yellow emission was monitored with time. B, HeLa cells overexpressing MyrPalmDKAR in the absence (open squares) or presence (closed squares) of overexpressed NHERF-1 were treated with 10 μm histamine, and the ratio of cyan emission to yellow emission was monitored with time. FRET ratios were normalized and plotted over time. The data represent the averages ± S.E. from at least three independent experiments.
To verify that the response from DKAR-PDZ with NHERF-1 to histamine was a readout of PKD activity at NHERF-1 as opposed to PKD activity at the plasma membrane, we again utilized MyrPalmDKAR and assessed signaling by PKD at plasma membranes. The FRET response from MyrPalmDKAR in HeLa cells treated with histamine displayed strikingly distinct kinetics from DKAR-PDZ at NHERF-1; the rate of phosphorylation was reduced 8-fold from a half-time of approximately 1 min at the scaffold (Fig. 6A, filled diamonds) to a half-time of ∼8 min at the plasma membrane (Fig. 6B, filled squares). In addition, the amplitude of the signal was 3-fold higher for MyrPalmDKAR compared with DKAR-PDZ. Note that histamine evoked slightly higher phosphorylation of MyrPalmDKAR when NHERF-1 was co-expressed, in contrast to the reduction of activity in cells expressing the membrane-tethered reporter and NHERF-1 following PDBu stimulation. One possible explanation is that histamine signaling complexes (receptor/G protein/PLC) are in close proximity to NHERF so that localized DAG production is likely high near NHERF, resulting in greater phosphorylation of the reporter when endogenous PKD concentrates near overexpressed NHERF. Because PDBu partitions generally in membranes, sequestration of endogenous PKD to NHERF resulted in a decreased readout from a membrane-localized reporter. The unique signature from DKAR-PDZ at NHERF-1 compared with membrane-tethered or cytosolic DKAR is consistent with PKD signaling at the NHERF-1 scaffold. Specifically, GPCR-triggered signaling by PKD at the NHERF scaffold is more rapid than at the plasma membrane and is more persistent than within the cytosol.
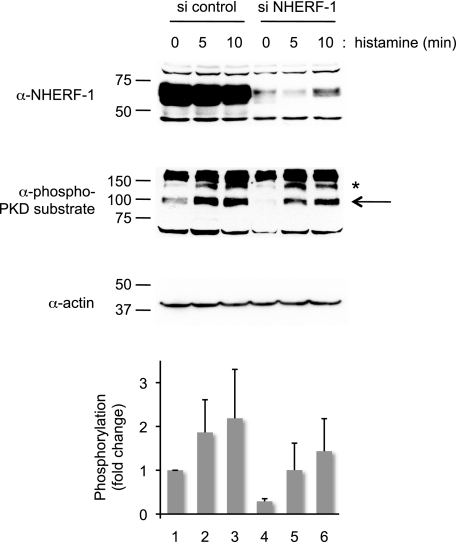
To definitively establish that the scaffolding of PKD to NHERF affects the physiological function of cells, we examined the effect of NHERF-1 depletion on the phosphorylation status of endogenous PKD substrates. HeLa cells were depleted of NHERF-1 by siRNA, and histamine-triggered phosphorylation of PKD substrates was assessed using an antibody that recognizes phosphorylated PKD sequences (27). The Western blot in Fig. 7 shows that NHERF-1 was efficiently depleted (∼90%) in HeLa cells treated with NHERF-1 siRNA. Treatment of control cells with histamine resulted in phosphorylation of a protein migrating with an apparent molecular mass of 100 kDa (Fig. 7, marked by an arrow). The basal phosphorylation of this protein was reduced ∼3-fold in cells depleted of NHERF (compare lanes 4 and 1), and the histamine-evoked phosphorylation was lower than that in control cells. Note that other bands labeled with the phospho-PKD substrate antibody (e.g. band marked with asterisk) were not affected by NHERF-1 knockdown. These data reveal that knockdown of endogenous NHERF inhibits the phosphorylation of select PKD substrates.
FIGURE 7.
NHERF-1 depletion reduces PKD substrate phosphorylation of select substrates. HeLa cells treated with control siRNA (si control) or NHERF-1 siRNA (si NHERF-1) were stimulated for the indicated times with 10 μm histamine. The cell lysates were analyzed by Western blotting using an antibody made against a phosphorylated PKD substrate consensus sequence (α-phospho-PKD substrate). A PKD substrate that co-migrated with the 100-kDa marker displayed reduced phosphorylation in the NHERF-1 knockdown cells (marked by an arrow). The graph depicts the level of phosphorylation of the 100-kDa substrate normalized to the 0-min time point of the siRNA control-treated cells. Actin was used as a loading control. The data represent the averages of two independent experiments. The error bars represent the ranges of the responses.
PKCδ Signaling Is Concentrated at the NHERF-1 Scaffold
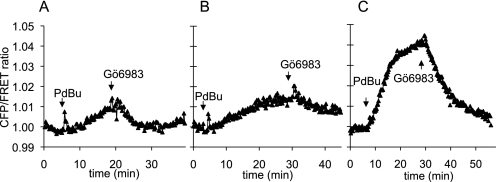
DAG recruits PKD to membranes via its C1 domains, but PKD activation additionally requires phosphorylation at two sites within its catalytic core by novel PKC isozymes such as PKCδ (28). These upstream kinases also contain C1 domains and are activated by binding DAG; thus, DAG production leads to PKD activation through coincident stimulation of the novel PKCs and localization of PKD near these kinases. Although the PKD signaling profile at NHERF-1 suggests that novel PKCs are at the scaffold, these upstream kinases have not been described to be present at NHERF-1. Hence we were interested in assaying the local activity of novel PKCs at NHERF-1. To do so, we took advantage of a newly developed kinase activity reporter that was designed in our laboratory to selectively report PKCδ activity over signaling by other members of the PKC family.3 We tethered the PDZ-binding motif used in our previous experiments onto δCKAR (C kinase activity reporter (15)) to generate δCKAR-PDZ. MDCK cells overexpressing δCKAR in the presence (Fig. 8A) or absence (data not shown) of NHERF-1 exhibited a minor change in the FRET ratio in response to PDBu that was reversed following inhibition of PKCδ by Gö 6983. Similar results were obtained in cells expressing δCKAR-PDZ alone (Fig. 8B). In contrast, PDBu triggered a rapid and robust FRET ratio change in cells co-expressing δCKAR-PDZ and NHERF-1 (Fig. 8C). These data indicate that the activity of PKCδ, the upstream kinase of PKD, is enriched at the NHERF scaffold.
FIGURE 8.
PKCδ signaling is more robust at the NHERF-1 scaffold. MDCK cells overexpressing δCKAR and NHERF-1 (A), δCKAR-PDZ alone (B), or δCKAR-PDZ and NHERF-1 (C) were treated with 200 nm PDBu followed by addition of 250 nm Gö 6983, and the ratio of cyan emission to yellow emission was monitored with time. FRET ratios were normalized and plotted over time. Shown are representative traces from over three independent experiments.
DISCUSSION
Here we identify the PDZ domain-containing protein NHERF-1 as a scaffold for PKD signaling. Specifically, use of a PDZ domain array revealed that the PDZ ligands in the carboxyl termini of PKD1 and PKD2 selectively bind the first PDZ domain of NHERF-1. An association between full-length PKD1 or PKD2 with NHERF-1 was verified using FRET. Targeting a genetically encoded reporter for PKD activity to NHERF-1 allowed us to visualize the rate, magnitude, and duration of PKD signaling at the scaffold following agonist stimulation. We found that PKD signaling is concentrated at NHERF-1, in a signaling environment that is distinct from that of cytosolic or membrane-localized PKD. Notably, PKD activity is more tightly controlled at the scaffold, with greater kinase activity resulting from an enrichment of the kinase. These results afford one of the first examples of the dynamics of kinase signaling at a protein scaffold and reveal that the concentration of signaling molecules at the scaffold allows greater control of signaling output.
The dynamic interaction between the PDZ domain of NHERF-1 and PKD is not of sufficiently high affinity to be observed by co-immunoprecipitation; thus we utilized FRET to visualize their association. For FRET to occur, the two fluorophores must be within 10 nm of one another (23, 29). This resolution is ∼20-fold more sensitive than that obtained when visualizing co-localization via fluorescence microscopy (29). By monitoring FRET between CFP-NHERF-1 and YFP-tagged PKDs, one observes the transient nature of their association (Fig. 2, B and C). That is, peak association occurs within the first minute of an activating stimulus (during PKD translocation via its C1 domains to the plasma membrane), after which PKD becomes autophosphorylated; autophosphorylation by PKD at its carboxyl-terminal serine would be predicted to destroy the consensus PDZ-binding motif and result in dissociation of PKD from NHERF-1. This translocation to NHERF-1 is dependent on the PDZ-binding motif of PKD, because the PKD2ΔPDZ protein failed to interact with NHERF-1 in the FRET assay (Fig. 2C, open diamonds). It is interesting to note that the FRET signal monitored in the translocation experiments declines to levels below the original base line, suggesting that some PKD localizes in the proximity of NHERF-1 under nonstimulating conditions.
To examine the dynamics of PKD activity at the NHERF scaffold, we took advantage of DKAR to directly visualize NHERF-localized PKD signaling. The data in Fig. 4 confirm localization of PKD to NHERF-1 because the DKAR response to phorbol ester, a ligand that activates PKD signaling, is greatly enhanced when NHERF-1 is overexpressed, and DKAR contains a NHERF-interacting PDZ-binding motif (DKAR-PDZ). This enhanced DKAR signal reflects localization of PKD to NHERF-1 and does not merely reflect signaling by PKD that has been concentrated at the plasma membrane, where NHERF-1 is localized; PKD signaling reported by DKAR-PDZ is distinct from that reported by membrane-targeted DKAR (MyrPalmDKAR) in cells overexpressing NHERF-1. First, reversal of the DKAR response following PKD inhibition was much more rapid in NHERF-1-expressing cells when reported at the NHERF scaffold compared with plasma membrane. Second, the rate of PKD activation in response to the natural agonist, histamine, was considerably faster at the NHERF scaffold compared with bulk plasma membrane. Together, these data establish an association of PKD activity with NHERF-1 and demonstrate that the environment at NHERF-1 (higher phosphatase activity and faster activation kinetics) is distinct from that at the plasma membrane. Furthermore, these results highlight the value of utilizing kinase activity reporters as a sensitive means for examining kinase localization because an association between NHERF-1 and PKD is detected by DKAR scaffolded to NHERF-1.
Stimulation of endogenous histamine receptors reveals a unique profile of PKD activity at the NHERF scaffold. Histamine receptors are present in HeLa cells and couple to the Gαq signaling pathway, which leads to PLCβ activation and subsequent DAG production. PKD responses from DKAR-PDZ in NHERF-1-overexpressing cells were 1) sustained and 2) reduced in the initial magnitude compared with cells in which DKAR was untargeted or cells in which NHERF-1 was not co-expressed. Such sustained activation could reflect sustained DAG production resulting from the concentration of PDZ-scaffolded PLC at NHERF; Gαq and PLCβ are both present at the NHERF-1 scaffold (30, 31). A similar blunted, yet sustained response at the NHERF scaffold was recently described: Fam et al. (20) identified an interaction between the P2Y1 receptor and NHERF-2 and showed that Ca2+ signaling downstream of P2Y1 receptor activation was slightly lower in amplitude but persisted longer in cells overexpressing NHERF-2. Thus, signaling at the NHERF scaffold is sustained for at least two receptor types. Despite the concentration of PKD at the scaffold, the amplitude of activation is lower compared with cytosol or bulk plasma membrane. This reduced agonist-evoked increase in activity does not reflect higher basal activity of PKD at NHERF-1, because treatment of unstimulated cells with a PKD inhibitor did not lower the FRET ratio observed from DKAR-PDZ, revealing no significant basal activity (data not shown). These data reveal tight regulation of PKD substrate phosphorylation at the NHERF-1 scaffold. Consistent with NHERF serving as a nexus for PKD signaling, depletion of NHERF by siRNA reduced the phosphorylation of select PKD substrates. These data unveil the NHERF scaffold as a novel nexus for PKD signaling.
Having shown that PKD activity is localized at NHERF-1, we reasoned that the upstream kinases, the novel PKCs, must be active there. In Fig. 8, using a NHERF-1-targeted novel PKC reporter (δCKAR-PDZ), we observed enriched PKCδ signaling at the scaffold. This finding is intriguing in that the novel PKCs do not possess a PDZ-binding motif and thus are not expected to interact with NHERF. However, PKCδ has been shown to bind actin, which in turn is associated with NHERF via the ERM-binding domain at the carboxyl terminus (32). In addition, because Gαq and PLCβ are scaffolded to NHERF-1 (30, 31), localized accumulation of DAG at NHERF-1 would effectively recruit PKCδ to the vicinity of NHERF. Indeed, the subcellular location of novel PKC isozymes is acutely controlled by direct binding to DAG (33, 34). Thus, the co-localization and enrichment of binding partners and lipid second messenger likely accounts for the enhanced PKCδ signaling we observe from δCKAR-PDZ when NHERF-1 is overexpressed.
Fig. 9 presents a model of the PKD signaling complex at NHERF-1 scaffolds. Stimulation of Gq-coupled receptors leads to the activation of Gαq and PLCβ, two effectors scaffolded to NHERF-1 (30, 31). Active PLC then hydrolyzes phosphatidylinositol bisphosphate to form two second messengers, DAG and inositol trisphosphate. NHERF-1-localized DAG production results in the activation of PKCδ (the upstream kinase for PKD), which is present near the scaffold by binding actin (32), which itself has been shown to interact with the ERM-binding region of NHERF (11). PKD also binds DAG, allowing it to become phosphorylated by PKCδ and thereby activated. Activated PKD1 and PKD2 then autophosphorylate at their extreme carboxyl termini at the serine residue within the PDZ-binding motif (35, 36); this phosphorylation disrupts the interaction with the PDZ domain of NHERF-1 releasing active PKD1/2 from the scaffold to phosphorylate local substrates. Indeed, β-catenin, also a NHERF-1-associated protein, has recently been shown to be a PKD substrate; phosphorylation of β-catenin by PKD1 represses its transcriptional activity (37, 38). Furthermore, De Kimpe et al. (39) recently identified cortactin, an actin-binding protein, as an in vivo substrate of PKD. Via its association with actin, NHERF-1 would serve to localize PKD in the vicinity of cortactin where it can phosphorylate it downstream of activating signals. Our data are also consistent with the presence of phosphatases that suppress basal signaling by PKD at the scaffold, control the amplitude of PKD activity, and allow rapid termination of activity following inhibition of PKD.
FIGURE 9.
Model showing the concentration of PKD, Gαq, PLCβ, and PKCδ at the NHERF-1 scaffold. Stimulation of GPCRs leads to activation of PLCβ, resulting in the local generation of DAG. DAG within the plasma membrane results in the recruitment of both PKD and its upstream kinase PKCδ by binding to their C1 domains. PKCδ is in the vicinity of NHERF-1 by associating with actin, which is linked to NHERF-1 via ezrin. PLCβ and Gαq are known to be associated with NHERF-1 via a PDZ interaction. The enrichment of PKD and these upstream components at NHERF-1 results in a concentrated PKD response downstream of activating stimuli.
NHERF-1 is capable of robust multimerization (18, 40–42), both by forming complexes with itself as well as with its family member NHERF-2 (18). Thus, the finding that Gαq, PLCβ, and PKD all interact with the same PDZ domain of NHERF-1 does not preclude their co-existence at the same complex. In addition, a number of Gq-coupled GPCRs have also been found to interact with these two NHERF proteins; they include the previously mentioned P2Y1 receptor (20), as well as the parathyroid hormone 1 receptor (43), lysophosphatidic acid 2 receptor (44), and metabotropic glutamate receptor 5 (45). Therefore, our finding that NHERF-1 associates with PKD isoforms suggests that anchoring PKD in the vicinity of Gq-coupled receptors would enhance the efficiency of PKD activation and downstream signaling emanating from all of these receptors.
NHERF-1 was originally identified as the essential protein component necessary to mediate protein kinase A inhibition of the Na+/H+ exchanger 3 (9). Our identification of a distinct protein kinase, PKD, as a NHERF-1 associated protein provides a potential mechanism for phosphorylation and modulation of the function of NHERF itself or NHERF-localized proteins. The possibility that PKD controls the architecture of the NHERF signaling complex is particularly attractive given that NHERF-1 is a phospho-protein, with some phosphorylation sites controlling intramolecular interactions that regulate accessibility of the PDZ motifs and others directly controlling complex formation (46, 47).
Acknowledgments
We thank Lisa L. Gallegos, C. C. King, and other Newton lab members for helpful discussions.
This work was supported, in whole or in part, by National Institutes of Health Grant P01 DK54441 (to A. C. N.).
T. Kajimoto and A. C. Newton, unpublished data.
- PKD
- protein kinase D
- PKC
- protein kinase C
- NHERF
- Na+/H+ exchanger regulatory factor
- FRET
- fluorescence resonance energy transfer
- DKAR
- D kinase activity reporter
- DAG
- diacylglycerol
- GPCR
- G protein-coupled receptor
- PLC
- phospholipase C
- PDBu
- phorbol-12,13-dibutyrate
- ERM
- ezrin-radixin-moesin
- CT
- carboxyl-terminal
- GST
- glutathione S-transferase
- CKAR
- C kinase activity reporter
- CFP
- cyan fluorescent protein
- YFP
- yellow fluorescent protein
- MDCK
- Madin-Darby canine kidney
- siRNA
- small interfering RNA.
REFERENCES
- 1.Toker A. (2005) EMBO Rep. 6, 310–314 [DOI] [PMC free article] [PubMed] [Google Scholar]
- 2.Rykx A., De Kimpe L., Mikhalap S., Vantus T., Seufferlein T., Vandenheede J. R., Van Lint J. (2003) FEBS Lett. 546, 81–86 [DOI] [PubMed] [Google Scholar]
- 3.Kazanietz M. G. (2002) Mol. Pharmacol. 61, 759–767 [DOI] [PubMed] [Google Scholar]
- 4.Sánchez-Ruiloba L., Cabrera-Poch N., Rodríguez-Martínez M., López-Menéndez C., Jean-Mairet R. M., Higuero A. M., Iglesias T. (2006) J. Biol. Chem. 281, 18888–18900 [DOI] [PubMed] [Google Scholar]
- 5.Iglesias T., Waldron R. T., Rozengurt E. (1998) J. Biol. Chem. 273, 27662–27667 [DOI] [PubMed] [Google Scholar]
- 6.Rozengurt E., Rey O., Waldron R. T. (2005) J. Biol. Chem. 280, 13205–13208 [DOI] [PubMed] [Google Scholar]
- 7.Hung A. Y., Sheng M. (2002) J. Biol. Chem. 277, 5699–5702 [DOI] [PubMed] [Google Scholar]
- 8.Stiffler M. A., Chen J. R., Grantcharova V. P., Lei Y., Fuchs D., Allen J. E., Zaslavskaia L. A., MacBeath G. (2007) Science 317, 364–369 [DOI] [PMC free article] [PubMed] [Google Scholar]
- 9.Weinman E. J., Steplock D., Wang Y., Shenolikar S. (1995) J. Clin. Invest. 95, 2143–2149 [DOI] [PMC free article] [PubMed] [Google Scholar]
- 10.Donowitz M., Cha B., Zachos N. C., Brett C. L., Sharma A., Tse C. M., Li X. (2005) J. Physiol. 567, 3–11 [DOI] [PMC free article] [PubMed] [Google Scholar]
- 11.Reczek D., Berryman M., Bretscher A. (1997) J. Cell Biol. 139, 169–179 [DOI] [PMC free article] [PubMed] [Google Scholar]
- 12.Shenolikar S., Voltz J. W., Cunningham R., Weinman E. J. (2004) Physiology 19, 362–369 [DOI] [PubMed] [Google Scholar]
- 13.Weinman E. J., Hall R. A., Friedman P. A., Liu-Chen L. Y., Shenolikar S. (2006) Annu. Rev. Physiol. 68, 491–505 [DOI] [PubMed] [Google Scholar]
- 14.Kunkel M. T., Toker A., Tsien R. Y., Newton A. C. (2007) J. Biol. Chem. 282, 6733–6742 [DOI] [PMC free article] [PubMed] [Google Scholar]
- 15.Violin J. D., Zhang J., Tsien R. Y., Newton A. C. (2003) J. Cell Biol. 161, 899–909 [DOI] [PMC free article] [PubMed] [Google Scholar]
- 16.Zacharias D. A., Violin J. D., Newton A. C., Tsien R. Y. (2002) Science 296, 913–916 [DOI] [PubMed] [Google Scholar]
- 17.Brognard J., Sierecki E., Gao T., Newton A. C. (2007) Mol. Cell 25, 917–931 [DOI] [PubMed] [Google Scholar]
- 18.Lau A. G., Hall R. A. (2001) Biochemistry 40, 8572–8580 [DOI] [PubMed] [Google Scholar]
- 19.Campbell R. E., Tour O., Palmer A. E., Steinbach P. A., Baird G. S., Zacharias D. A., Tsien R. Y. (2002) Proc. Natl. Acad. Sci. U.S.A. 99, 7877–7882 [DOI] [PMC free article] [PubMed] [Google Scholar]
- 20.Fam S. R., Paquet M., Castleberry A. M., Oller H., Lee C. J., Traynelis S. F., Smith Y., Yun C. C., Hall R. A. (2005) Proc. Natl. Acad. Sci. U.S.A. 102, 8042–8047 [DOI] [PMC free article] [PubMed] [Google Scholar]
- 21.Kunkel M. T., Ni Q., Tsien R. Y., Zhang J., Newton A. C. (2005) J. Biol. Chem. 280, 5581–5587 [DOI] [PMC free article] [PubMed] [Google Scholar]
- 22.Chen J. R., Chang B. H., Allen J. E., Stiffler M. A., MacBeath G. (2008) Nat. Biotechnol. 26, 1041–1045 [DOI] [PMC free article] [PubMed] [Google Scholar]
- 23.Sekar R. B., Periasamy A. (2003) J. Cell Biol. 160, 629–633 [DOI] [PMC free article] [PubMed] [Google Scholar]
- 24.Georgescu M. M., Morales F. C., Molina J. R., Hayashi Y. (2008) Curr. Mol. Med. 8, 459–468 [DOI] [PubMed] [Google Scholar]
- 25.Griesbeck O., Baird G. S., Campbell R. E., Zacharias D. A., Tsien R. Y. (2001) J. Biol. Chem. 276, 29188–29194 [DOI] [PubMed] [Google Scholar]
- 26.Gallegos L. L., Kunkel M. T., Newton A. C. (2006) J. Biol. Chem. 281, 30947–30956 [DOI] [PubMed] [Google Scholar]
- 27.Döppler H., Storz P., Li J., Comb M. J., Toker A. (2005) J. Biol. Chem. 280, 15013–15019 [DOI] [PubMed] [Google Scholar]
- 28.Tan M., Xu X., Ohba M., Ogawa W., Cui M. Z. (2003) J. Biol. Chem. 278, 2824–2828 [DOI] [PubMed] [Google Scholar]
- 29.Piston D. W., Kremers G. J. (2007) Trends Biochem. Sci. 32, 407–414 [DOI] [PubMed] [Google Scholar]
- 30.Rochdi M. D., Watier V., La Madeleine C., Nakata H., Kozasa T., Parent J. L. (2002) J. Biol. Chem. 277, 40751–40759 [DOI] [PubMed] [Google Scholar]
- 31.Tang Y., Tang J., Chen Z., Trost C., Flockerzi V., Li M., Ramesh V., Zhu M. X. (2000) J. Biol. Chem. 275, 37559–37564 [DOI] [PubMed] [Google Scholar]
- 32.López-Lluch G., Bird M. M., Canas B., Godovac-Zimmerman J., Ridley A., Segal A. W., Dekker L. V. (2001) Biochem. J. 357, 39–47 [DOI] [PMC free article] [PubMed] [Google Scholar]
- 33.Dries D. R., Gallegos L. L., Newton A. C. (2007) J. Biol. Chem. 282, 826–830 [DOI] [PubMed] [Google Scholar]
- 34.Carrasco S., Merida I. (2004) Mol. Biol. Cell 15, 2932–2942 [DOI] [PMC free article] [PubMed] [Google Scholar]
- 35.Sturany S., Van Lint J., Muller F., Wilda M., Hameister H., Hocker M., Brey A., Gern U., Vandenheede J., Gress T., Adler G., Seufferlein T. (2001) J. Biol. Chem. 276, 3310–3318 [DOI] [PubMed] [Google Scholar]
- 36.Matthews S. A., Rozengurt E., Cantrell D. (1999) J. Biol. Chem. 274, 26543–26549 [DOI] [PubMed] [Google Scholar]
- 37.Shibata T., Chuma M., Kokubu A., Sakamoto M., Hirohashi S. (2003) Hepatology 38, 178–186 [DOI] [PubMed] [Google Scholar]
- 38.Du C., Jaggi M., Zhang C., Balaji K. C. (2009) Cancer Res. 69, 1117–1124 [DOI] [PubMed] [Google Scholar]
- 39.De Kimpe L., Janssens K., Derua R., Armacki M., Goicoechea S., Otey C., Waelkens E., Vandoninck S., Vandenheede J. R., Seufferlein T., Van Lint J. (2009) Cell Signal. 21, 253–263 [DOI] [PubMed] [Google Scholar]
- 40.Shenolikar S., Minkoff C. M., Steplock D. A., Evangelista C., Liu M., Weinman E. J. (2001) FEBS Lett. 489, 233–236 [DOI] [PubMed] [Google Scholar]
- 41.Fouassier L., Yun C. C., Fitz J. G., Doctor R. B. (2000) J. Biol. Chem. 275, 25039–25045 [DOI] [PubMed] [Google Scholar]
- 42.Maudsley S., Zamah A. M., Rahman N., Blitzer J. T., Luttrell L. M., Lefkowitz R. J., Hall R. A. (2000) Mol. Cell. Biol. 20, 8352–8363 [DOI] [PMC free article] [PubMed] [Google Scholar]
- 43.Mahon M. J., Donowitz M., Yun C. C., Segre G. V. (2002) Nature 417, 858–861 [DOI] [PubMed] [Google Scholar]
- 44.Oh Y. S., Jo N. W., Choi J. W., Kim H. S., Seo S. W., Kang K. O., Hwang J. I., Heo K., Kim S. H., Kim Y. H., Kim I. H., Kim J. H., Banno Y., Ryu S. H., Suh P. G. (2004) Mol. Cell. Biol. 24, 5069–5079 [DOI] [PMC free article] [PubMed] [Google Scholar]
- 45.Paquet M., Asay M. J., Fam S. R., Inuzuka H., Castleberry A. M., Oller H., Smith Y., Yun C. C., Traynelis S. F., Hall R. A. (2006) J. Biol. Chem. 281, 29949–29961 [DOI] [PMC free article] [PubMed] [Google Scholar]
- 46.Li J., Poulikakos P. I., Dai Z., Testa J. R., Callaway D. J., Bu Z. (2007) J. Biol. Chem. 282, 27086–27099 [DOI] [PubMed] [Google Scholar]
- 47.Voltz J. W., Brush M., Sikes S., Steplock D., Weinman E. J., Shenolikar S. (2007) J. Biol. Chem. 282, 33879–33887 [DOI] [PubMed] [Google Scholar]


