Abstract
Correlated variation in shape and size (allometry) is a major component of natural diversity. We examined the evolutionary and genetic basis for allometry using leaves and flower petals of snapdragon species (Antirrhinum). A computational method was developed to capture shape and size variation in both types of organ within the Antirrhinum species group. The results show that the major component of variation between species involves positively correlated changes in leaf and petal size. The correlation was maintained in an F2 population derived from crossing two species with organs of different sizes, suggesting that developmental constraints were involved. Identification of the underlying genes as quantitative trait loci revealed that the larger species carried alleles that increased organ size at all loci. Although this was initially taken as evidence that directional selection has driven diversity in both leaf and petal size, simulations revealed that evolution without consistent directional selection, an undirected walk, could also account for the parental distribution of organ size alleles.
INTRODUCTION
Allometry describes the correlated variation in shape and size that can occur within one type of organ or involve the relative proportions of different organs (Huxley, 1932). Even closely related species can show very different allometries, raising the question of how these differences arise. One possibility is that correlations result from selection. For example, if water conservation is promoted by smaller leaves and petals (Galen, 2006; McDonald et al., 2003), selection could drive shifts in the sizes of both organs, even if the underlying genes affect each organ independently. Developmental constraints provide another explanation (Maynard Smith et al., 1985). Leaves and petals, for example, are homologous organs sharing mechanisms of developmental control (Anastasiou and Lenhard, 2007), so that genes that act pleiotropically on both organ types might give rise to coordinate changes in shape or size.
The genetic and evolutionary basis for allometric variation remains poorly understood. Crosses between members of the same or closely related species have identified genes that may underlie correlated variation in individual organs or between functionally and developmentally related organs, such as those of the flower (e.g., Zheng et al., 2000; Klingenberg et al., 2001; Conner, 2002; Frary et al., 2004; Juenger et al., 2005). However, it is not clear how these findings relate to wider evolutionary patterns of allometric variation between species.
Though evolutionarily important, allometric variation between species has been difficult to quantify. One problem is that many common measures of shape, such as length:width ratios, do not capture shape variation fully (Klingenberg, 2003). A further problem is how to integrate analysis of shape and size. One approach has been to use separate metrics for shape and for size and then analyze correlations between them (e.g., Frary et al., 2004). However, a more attractive option is to have a single system that captures allometric variation directly without making a prior separation. A third problem is how to incorporate different types of organ within the same framework.
Previously, we used a computational approach to quantify allometric variation within leaves of snapdragon (Antirrhinum) species (Langlade et al., 2005). Covariation in the positions of multiple points around leaf outlines was described in terms of principal components (PCs) that captured variation in both shape and size. This allometric model was based on genetically determined variation that segregated in an F2 population of two Antirrhinum species. Though based on genetic differences between only two species, the PCs could describe allometric variation within the Antirrhinum species group as a whole.
The Antirrhinum species group is suited to such analyses because it consists of ∼25 members that evolved from a single common ancestor, probably within the last 4 million years (Gübitz et al., 2003; Vargas et al., 2009). All species are able to form fertile hybrids, allowing identification of the genes that underlie their differences as quantitative trait loci (QTL). The species group has traditionally been divided into three morphological subsections. (1) Subsection Antirrhinum comprises species with large leaves and flowers and includes the wild ancestor of cultivated A. majus. (2) Subsection Kickxiella comprises species with small leaves and flowers, including Antirrhinum charidemi, which is endemic to a dry coastal desert in southeastern Spain and has the smallest leaves and flowers within the species group, about one-tenth of the area of A. majus. (3) Subsection Streptosepalum consists of two species with organs that are approximately intermediate in size between those of subsections Antirrhinum and Kickxiella (Rothmaler, 1956; Webb, 1971; Sutton, 1988).
Here, we show that allometric models can be used to measure variation involving different organ types. Applying this to Antirrhinum leaves and petals together reveals the same kind of covariation between species as in an F2 population from a species cross. This suggests that developmental constraints have been involved in correlated evolution of Antirrhinum leaves and petals, rather than selection of genes that affect leaves or petals independently. To test whether the underlying genes might have been subject to directional selection, we identified the underlying QTL. The parental distribution of QTL alleles was initially suggestive of directional selection for diversity in leaf and petal size. However, when the choice of parents used to make the F2 was taken into account, the null hypothesis of an undirected walk could not be eliminated.
RESULTS
Quantifying Allometric Variation in the Antirrhinum Species Group
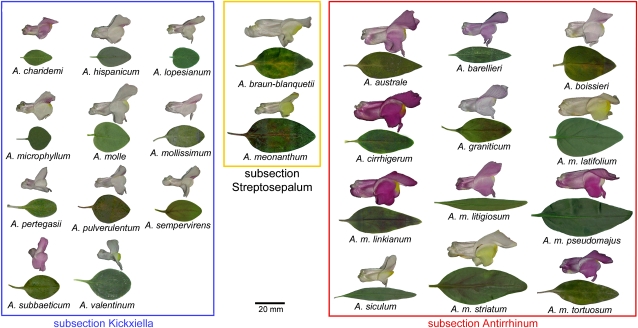
To examine allometric variation between leaves and petals within the Antirrhinum species group, we compared 24 species (11 from each of the subsections Antirrhinum and Kickxiella and both Streptosepalum species). Seeds were collected in the wild from plants representing the geographic range of each species and grown in a glasshouse. Considerable variation in the shapes and sizes of leaves and petals was apparent within the species group (Figure 1).
Figure 1.
Variation in Leaves and Petals within the Antirrhinum Species Group.
Representative leaves taken from the fourth node from the base and flowers are shown for 25 members of the Antirrhinum species group.
[See online article for color version of this figure.]
One approach to quantifying allometric variation in both leaves and petals would be to measure each organ type separately and then look at correlations between them. However, this has the disadvantage that the measurements that are initially chosen may not be the most appropriate ones. An alternative approach is to treat the data from the two organs collectively, allowing overall trends to be identified.
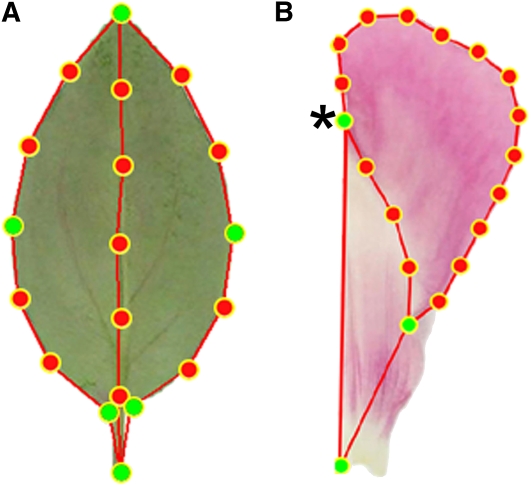
We therefore sampled up to 10 individuals from each species. A digital image was made of a flattened leaf taken from the fourth node from the base of each plant, and 19 points were placed around the leaf outline using the leaf (Le) template shown in Figure 2A. The resulting leaf shapes were aligned by translation and rotation (Procrustes alignment; Goodall, 1991) to generate a data set in which the outline of a leaf was represented by the Cartesian coordinates of its 19 points, each expressed in standard deviations from the mean position of the point within the collection of leaves. An equivalent procedure was used to generate a petal data set using a 20-point petal (Pe) template (Figure 2B). To ensure equal weighting of leaf and petal data, leaf size for all plants was multiplied by a constant factor so that the variance in the Le and Pe data sets was equal. The Le and Pe data sets were then combined to give an LePe data set in which each plant from the species group was represented by 39 points (19 from Le and 20 from Pe) or 78 coordinate values. It was likely that variation in organ outlines could be described in fewer than these 78 axes because secondary points (shown in red in Figure 2) had been equally spaced and neighboring points were further constrained in position by the shape of the outline. Therefore, principal component analysis (PCA) was applied to the LePe data set to detect correlated variation in the positions of points and so identify trends in shape and size variation between plants.
Figure 2.
Describing Leaf and Petal Allometry.
A 19-point template was fitted to images of leaves (Le) (A) and a 20-point template to flattened dorsal petals (Pe) (B). Green points were positioned manually and red points spaced automatically between them. Points 2 and 20 in the petal image (asterisk) are superimposed.
[See online article for color version of this figure.]
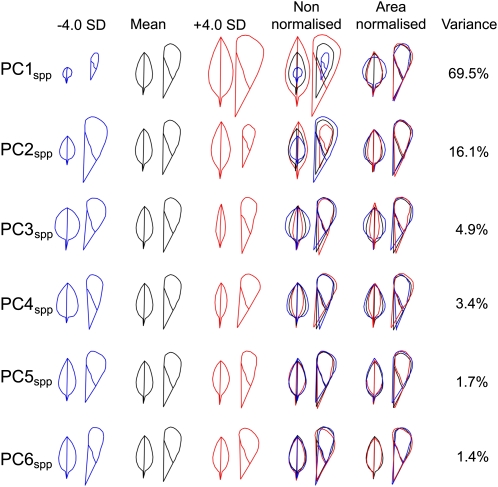
PCA revealed that 97% of the variance in organ shape and size could be accounted for by six PCs. These PCs are given the subscript spp as they describe variation between species and are ranked according to the amount of variation they explain (with PC1 ranking highest). The variation in leaf and petal outlines corresponding to changes in each PCspp is shown in Figure 3. In each case, a reduction (blue) or increase (red) in the PC of four standard deviations is shown relative to the mean outline (black). A higher value of PC1spp corresponds to an increase in both petal and leaf size. As PC1spp accounts for most of the variance (70%), this shows that the major source of variation between species is a strong positive correlation in leaf and petal size. This correlation is also apparent in comparisons of leaf and petal areas in Supplemental Figure 1A online. However, PC1spp also captures some correlations in organ shape, with leaves and petals varying in opposite directions: larger leaves have a narrower shape, while larger petals have a broader shape.
Figure 3.
An Organ Allometry Model for the Antirrhinum Species Group.
Variation in leaves and petals is described by variation along the first six PCs of a combined leaf and petal allometry model. The effects on the leaf and petal outlines corresponding to decreasing or increasing each PC by four standard deviations from the mean for all 177 species samples are shown on the left. Overlaid outlines are shown to the right, after adjusting to the same area (Area Normalized), to illustrate the effects of each PC on organ shape, or without normalization (Non-normalized). The proportion of the total variance in organ shape and size within the species group that is captured by each PC is given as a percentage.
[See online article for color version of this figure.]
While PC1spp describes a positive correlation between leaf and petal size, PC2spp captures a negative correlation as increasing PC2spp corresponds to an increase in leaf size but a decrease in petal size. This reflects most of the residual variation in organ size that is not captured by PC1spp. That is, PC2spp describes the extent to which leaves and petals vary in size independently of each other. PC2spp also captures variation in organ shape, with larger PC2spp values corresponding to a narrower shape.
PC3spp captures variation in organ width, with petals and leaves being positively correlated. Width variation is also captured by PC4spp, though in contrast with PC3spp, variation in leaves and petals are negatively correlated. PC5spp and PC6spp capture more minor shape variations that are positively correlated between leaves and petals for PC5spp and negatively correlated for PC6spp.
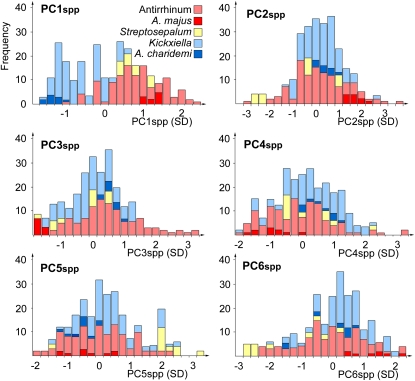
When species were compared according to PC1spp, members of subsection Antirrhinum clustered around higher values of PC1spp and subsection Kickxiella toward the opposite extreme, reflecting their smaller leaves and petals (Figure 4). The two Streptosepalum species had similar values of PC1spp that overlapped with those of the other two subsections. PC1spp therefore correlated with classical taxonomic subdivisions. By contrast, there was no significant difference between subsections Antirrhinum and Kickxiella for the remaining five PCs (Figure 4).
Figure 4.
Variation along Each PC within the Antirrhinum Species Group.
Each histogram represents the distribution of 25 Antirrhinum species along one of the PCs from the species allometry model. PC values are given in standard deviations from the mean leaf and petal outline.
[See online article for color version of this figure.]
The allometric relationships captured by PCspp reflect both genetic differences and environmental variation within the glasshouse in which plants were grown. An estimate of the relative genetic contribution was made by comparing the variance of each PCspp between species (which is largely due to genetic differences) to that within each species, which can have other causes. Estimates from an average of eight plants from each of 25 species suggested that most of the variance (60% for PC4spp and >82% for the other five PCs) had an underlying genetic basis. These estimates are conservative because they ignore the effects of any genetic variation within each species.
Developmental Constraints Play a Role in Allometric Variation between Species
The positive correlation in leaf and petal size captured by PC1spp might reflect the direct effects of selection on organ size. For example, diversifying selection could have fixed alleles of genes that affect leaf size and genes that affect petal size independently. Alternatively, the correlations might reflect variation in genes that act on both petal and leaf size in a similar manner (i.e., developmental constraints). These hypotheses can be distinguished by analyzing the genes underlying the species differences.
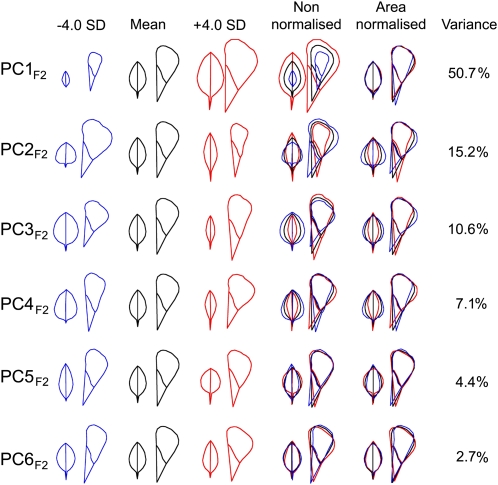
To address this question, we analyzed an F2 population of 175 plants produced by crossing two of the species, A. majus and A. charidemi (Langlade et al., 2005). A. majus is a member of subsection Antirrhinum and has large leaves and flowers, lying toward the upper end of PC1spp (Figure 4). By contrast, A. charidemi is in subsection Kickxiella and has small leaves and flowers, representing the other end of the PC1spp range. A LePe allometric model was constructed for leaves and petals of the F2 population in the same way as for the species group. Its PCs are given the suffix F2 to distinguish them from PCs of the species data set.
The first six PCs captured >90% of the variation within the F2 population (Figure 5). An increase in the value of PC1F2 corresponded to an increase in both leaf and petal size, indicating that there is a strong positive correlation between leaf size and petal size in the F2 population, as in the species group (see Supplemental Figure 1B online). This argues against selection having been the direct cause of the size correlation in the species group, as such a correlation would have been broken by segregation in the F2. Instead, it suggests that the F2 segregates for genes that affect both types of organ in the same way and therefore that size correlations in the species can be explained by developmental constraints.
Figure 5.
An Organ Allometry Model for an F2 Hybrid Population.
Allometric variation within the A. majus × A. charidemi F2 population described by variation along six principal components, as in Figure 2.
[See online article for color version of this figure.]
One notable difference between allometric models was that independent variation of leaves and petals was more significant in the species group compared with the F2. The negative size correlation captured with PC2spp, for example, accounted for 16% of the variation between species (Figure 3), whereas the most significant negative correlation in the F2 (captured by PC4F2) accounted for only 7% of the F2 variance (Figure 5). This suggests that many of the loci responsible for independent leaf and petal variation in the species group are not represented in A. majus and A. charidemi. Consistent with this, A. majus and A. charidemi had similar values for PCs describing negative correlations. PC2spp, for example, varied over 6.5 sd across the species group but only by 1.5 sd between A. majus and A. charidemi (Figures 3 and 4).
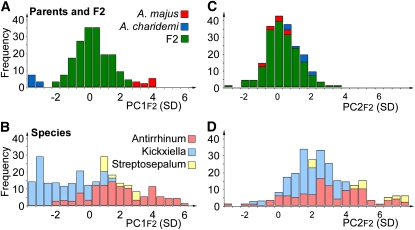
As a further comparison of allometric variation between species with that in the F2 population, we used the PCs from the F2 to describe variation between species (i.e., we projected the species onto PCF2 space; Figure 6). The first six PCs from the F2 were able to describe a large proportion (82%) of the variation in the species group. A. majus and A. charidemi lie toward the extremes of PC1F2 variation, as they do for PC1spp (Figure 6A). However, A. majus and A. charidemi are similar to each other and to the mean for the other PCs, which mainly capture variation in organ shape. PC2F2, for example, varies by 11 sd across the species group, while A. majus and A. charidemi differ by only 3.1 sd (Figures 6C and 6D).
Figure 6.
Allometric Variation between Species Compared with F2 Hybrids.
The variation of F2 hybrids and their parents along PC1F2 (A) and PC2F2 (C). PC values are given as standard deviations from the mean organ outlines for the F2 population. The first two PCs from the F2 population were used to describe organ outlines for the species, allowing variation in the species group to be compared directly to the F2 population ([B] and [D]).
[See online article for color version of this figure.]
QTL Distributions Are Consistent with Evolution of PC1 by Undirected Walks
Selection appears not to be directly responsible for the correlations between leaf and petal size captured by PC1spp, as these reflect the action of pleiotropic loci. However, it is possible that selection has been important in fixing alleles at these loci during the evolution of the species group. One way of testing whether selection is involved is through the Orr sign test (Orr, 1998). According to the null hypothesis of no directional selection, QTL underlying differences between two species are equally likely to act in either direction, as mutations that increase or decrease a trait have the same probability of being fixed. However, a history of directional selection would be expected to bias QTL such that they lie in the parental directions (i.e., the parent with the higher trait value would have a disproportionately high number of QTL alleles that increase the trait). A stringent version of the Orr sign test also considers the magnitude of QTL effects, to allow for the possibility that directional selection might initially go beyond a fitness optimum leading to selection of minor-effect QTL acting in the opposite direction.
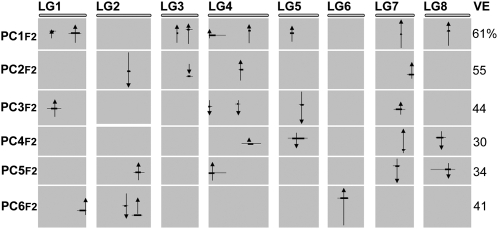
To determine the QTL underlying allometric variation in the F2 between A. majus and A. charidemi, each PCF2 was treated as a quantitative trait and the underlying genes mapped as QTL (Figure 7). Nine QTL were found to explain 61% of the variance in PC1F2, and all alleles acted in the parental direction (i.e., alleles from A. majus always increased organ size). This is consistent with the lack of transgressive segregation for PC1F2 seen the F2 population (Figure 6A).
Figure 7.
QTL Underlying Allometric Variation.
Each QTL is shown by an arrow at its most likely position within the eight linkage groups (LG) of the Antirrhinum genome. The length of each arrow is proportional to the additive effect of the QTL and its direction shows the effect of the A. majus allele (i.e., an arrow pointing upwards shows that the A. majus allele increases the PCF2 value). Broad horizontal lines show the 0.95 confidence interval and narrow lines the 0.99 confidence interval for the position of each QTL, estimated as the region in which the log of odds (LOD) score for the likelihood of the QTL remains within 1 LOD (broad line) or 2 LOD (narrow line) of its maximum value. The position at which the horizontal line bisects an arrow represents the relative PCF2 value of heterozygotes; when the line is shown above or below an arrow, it denotes a locus with an allele from A. majus that is either overdominant or underdominant, respectively.
For each of the other PCs, four or five QTL were found to account for ∼40% of its variance (Figure 7). In contrast with the situation for PC1F2, about half of these QTL acted in the parental and half in the opposite direction. As expected, all of the PCs showed transgressive segregation in the F2 population (Figure 6C; see Supplemental Figure 2 online). In several cases, QTL for different PCs were found to map to similar positions. This could reflect the same QTL affecting more than one PC or linkage between different QTL. Many of the QTL underlying correlations between leaves and petals were also detected as QTL that affected both leaves and petals when each was analyzed individually (see Supplemental Figure 3 online), consistent with developmental constraints involving QTL effects on both organ types.
Finding that the nine QTL underlying variation PC1F2 all act in the parental direction appears to suggest that directional selection for organ size might have played a role in fixing QTL. This hypothesis was supported by the stringent Orr sign test, which showed that such a distribution of alleles is very unlikely (P ≤ 0.006) to have arisen from an undirected walk. However, the test assumes that the parents of the F2 used in trait analysis were chosen at random. This assumption was untrue for our analysis as A. majus and A. charidemi were specifically chosen because they lie at the extremes of organ size and PC1F2 variation. To determine how this might affect the expected distribution of QTL, we performed a series of computer simulations.
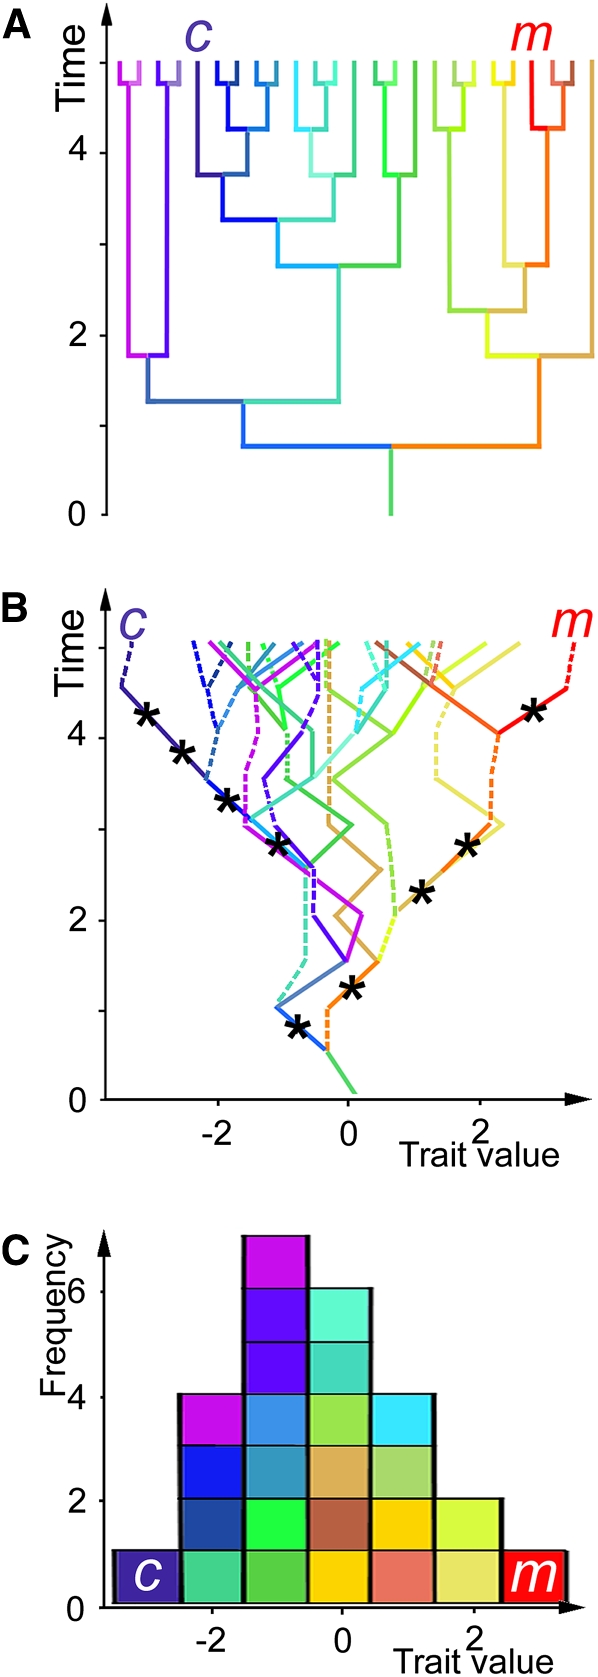
Because it has not yet been possible to resolve a phylogeny for Antirrhinum based on DNA sequence variation (e.g., Vargas et al., 2009), we first simulated different phylogenies representing a range of potential evolutionary relationships between species (Figure 8A). Two maximally unrelated individuals were chosen at random to represent A. majus and A. charidemi (a reasonable assumption given that these two species are in different taxonomic subsections). Undirected walks of trait evolution were then simulated within each phylogeny. An ancestor was allowed to accumulate increasing or decreasing mutations with equal probabilities, and the two lineages arising from a speciation event were able to continue independent undirected walks (Figure 8B). The magnitude of each mutation was assigned randomly between 0 and 1 so that the walk was bounded.
Figure 8.
Simulating Evolution of PC1 in Undirected Walks.
(A) Phylogenies were simulated for 25 Antirrhinum species and two maximally unrelated individuals chosen at random to represent A. majus (m) and A. charidemi (c). Time is in arbitrary units.
(B) PC1 was allowed to evolve within each species phylogeny as an undirected walk of increasing and decreasing mutations. Minor-effect mutations that would be undetectable in a QTL analysis are shown by broken lines. Trait values are shown in arbitrary units, and the maximum effect of any mutation is ± 1 unit. Only walks in which A. majus and A. charidemi reached opposite extremes of trait value and differed by nine detectable mutations (marked with asterisks) were considered further. For the phylogeny shown in (A), A. majus and A. charidemi accumulated only alleles with parental effects in 124 of 1000 undirected walks.
(C) Distribution of trait values across the species group resulting from the walk in (B). Corresponding lineages in the phylogeny (A) and undirected walk (B) are shown in the same colors as the species trait values in (C).
[See online article for color version of this figure.]
From a population of many different walks, we considered only the subset in which A. majus and A. charidemi reached opposite extremes of the trait value, as they do for PC1. After setting an arbitrary threshold for the magnitude of mutations that might be detected as QTL, we determined the proportion of 1000 walks in which A. majus had accumulated only increasing QTL alleles and A. charidemi only decreasing alleles. For nine detectable mutations, equivalent to the QTL found for PC1F2, we found that this happened in >10% of the walks. This frequency was not significantly affected by the topology of the phylogenetic tree in which PC1F2 evolved, providing that A. majus and A. charidemi were among the most unrelated species. These simulations therefore suggest that an undirected walk cannot be ruled out as an explanation for the evolution of differences in organ size.
DISCUSSION
We used allometric models to quantify organ shape and size variation across the Antirrhinum species group. Our results show that positively correlated changes in leaf and petal size provide the major component of allometric variation between species. Similar results were obtained from an F2 population derived from a cross between Antirrhinum species with extreme differences in organ size. This argues against size correlation being the result of selection acting on genes that affect leaf or petal size independently because independent segregation of such genes would have broken the correlation in the F2. A more likely explanation is that the correlated evolution of leaf and petal size has involved developmental constraints. This view is further supported by detection of QTL affecting both leaf size and petal size.
Constrained development of leaves and petals is not unexpected, given that these homologous organs share mechanisms of developmental regulation (Anastasiou and Lenhard, 2007). However, not all the variation between Antirrhinum species can be readily attributed to developmental constraints because the species and F2 shape models captured subtly different kinds of variation. Most notably, increases in organ size described by PC1spp were associated with a narrower leaf shape, whereas variation in PC1F2 was not associated with a change in leaf shape. These correlations might be the result of selection. For instance, larger leaves might have narrower shapes to mitigate the effects of shading on lower leaves or on heat loss by convection (Parkhurst and Loucks, 1972; Stokes et al., 2006). Alternatively, the differences between PC1spp and PC1F2 may reflect the fact that the parental species used for the F2 do not carry allometry alleles that are fully representative of variation in the species group as a whole.
Another difference revealed by the allometry models is that the species group shows more independent variation of leaves and petals than the F2. This can be attributed to additional genetic variation in the species group that is not present in A. majus and A. charidemi. Mutations that uncouple developmental constraints might allow independent adaptation of leaves and petals (Berg, 1960).
Regardless of the origins of developmental constraints, the underlying genes might themselves be subject to directional selection. In the case of the organ size variation described by PC1F2, the QTL all act in the parental direction, as would be expected if diversifying directional selection had driven species apart (Orr, 1998; Macdonald and Goldstein, 1999; Albertson et al., 2003; Bratteler et al., 2006). Initial analysis using the Orr sign test supports the conclusion that selection was involved. However, the test assumes that parents of the QTL mapping population were chosen at random from candidates that differ for the trait. This was not the case here because the parental species A. majus and A. charidemi were chosen to represent the extremes of organ size variation within the species group. Although simulations have suggested that extreme parents do not make the sign test more prone to falsely reject the null hypothesis of an undirected walk (Anderson and Slatkin, 2003), the simulations assumed that all potential parents have pursued independent undirected walks, as expected of individuals that are equally unrelated. Our simulations, by contrast, consider the extent to which potential parents share evolutionary histories. When these factors are taken into account, we find that our results are consistent with an undirected walk and therefore do not provide support for the selection hypothesis. Our analysis therefore illustrates the importance of taking account of any phenotypic or phylogenetic bias in choosing parents. It further suggests that previous QTL studies may have overemphasized the role of directional selection in promoting phenotypic diversity (e.g., Rieseberg et al., 2002; Langlade et al., 2005).
Although undirected walks are characteristic of evolution under neutrality, they might also results from fluctuating selection, as populations experience different fitness optima in space or time. The proposed origin of Antirrhinum species in the Mediterranean region during the early to mid-Quaternary period (Vargas et al., 2009) is consistent with the involvement of fluctuating selection because the later Quaternary involved cyclic variations in climate, vegetation, and pollinator availability (Robertson and Grasso, 1995; de Jong, 1998; Moe and Smith, 2005).
The evolutionary relationships within the Antirrhinum species group are important for this study in two respects. First, the null hypothesis of an undirected walk would be unlikely to explain the extreme PC1F2 differences of A. majus and A. charidemi if these species diverged relatively recently. Such recent divergence would be more consistent with directional selection, which can cause faster accumulation of mutations (Kimura, 1962). Second, PC1spp is correlated with classical taxonomic subdivisions. It could be that this taxonomy is the natural one, so that PC1spp detects divergence in traits over time. Alternatively, it is possible that the taxonomy has been based on features captured by PC1spp (organ size and shape; Rothmaler, 1956). This would lead to an automatic correlation between taxonomy and PC1spp. These possibilities can only be addressed with a better resolved phylogeny for the Antirrhinum species group.
METHODS
Plants and Allometry Modeling
The inbred Antirrhinum majus cultivar, JI7, was crossed to an Antirrhinum charidemi plant grown from seeds collected in the wild, and a single F1 plant was self-pollinated. F2 seedlings (n = 175) were selected at random and grown together in a glasshouse. At flowering, a leaf was taken from node 4 (where cotyledons are at node 1), and the dorsal petals of two fully opened flowers were separated from the rest of the corolla. Leaves and petals were flattened and photographed. Other Antirrhinum species were grown together in a glasshouse from open-pollinated seeds collected in the wild and measured as for F2 individuals. Up to 10 plants of each of 24 species (an average of 8.3 plants per species) were used in the analysis. Where possible, plants were grown from different parents collected from different populations across the geographic range of each species (an average of 5.5 parents from 3.7 populations per species; see Supplemental Table 1 online). Seeds of the species are available on request.
Image analysis and PCA were performed in Matlab using functions of AAMToolbox (available on request). Nineteen points were placed around each leaf silhouette, and similarly 20 points were placed around each dorsal petal (Figure 2). The Cartesian coordinates of these points were saved independently for each organ as a matrix file. Leaf matrices were automatically transposed and rotated to set their centroids at the origin and to minimize variance in the positions of points within the set of leaves. Petals images were treated in a similar way. Leaf matrices were scaled to equalize the total variance in the set of leaves with that in petals, and the leaf and petal matrices for each plant were combined. PCA was then used to partition the variance of point coordinates into orthogonal PCs. PCA identifies PCs on the basis of linear correlations between data. Its use in this case appeared valid because linear relationships both within and between organs approximated to linear (see Supplemental Figure 1 online).
The variation described by each of the PCs was represented by plotting the mean positions of all 39 points for the group of plants and the positions corresponding to +4 sd and −4 sd along the PC. Points were joined to create leaf and petal outlines. To represent the shape variation captured by each PC, outlines at +4 sd, 0 sd, and −4 sd were scaled to enclose the same area and superimposed.
QTL Analysis
F2 plants were genotyped at up to 174 loci (96 codominant markers and 78 dominant markers), with an average spacing of 4 centimorgans between loci (see Supplemental Table 2 online). QTL affecting PC values were identified by linear regression of phenotypes onto inferred genotypes at 1-centimorgan intervals in QTL Express, accounting for both additive and dominance effects of alleles (Seaton et al., 2002). After each regression step, the most significant QTL was fixed as a cofactor for the next round of regression until no additional QTL could be detected with at least 95% confidence, as estimated by permutation. Each QTL was then remapped, with the effects of the others fixed as cofactors, until no further changes in map positions or QTL effects occurred. The Orr sign test was performed using Monte Carlo simulation software kindly provided by Alan Orr (Orr, 1998). For this test, the detected QTL were assumed to represent the upper end of an exponential distribution of QTL effects. The scale parameter, α, of this distribution was estimated by fitting to the effects of the QTL detected for each trait (α = 0.35 for PC1). The threshold for QTL detection was taken as twice the additive effect of the most minor significant QTL.
Simulated Speciation and Trait Evolution
Simulation of speciation and undirected trait evolution were performed in Matlab using the function Randevol (available on request). Species evolution was simulated assuming constant probabilities of speciation and extinction until a phylogeny with 25 terminal species was obtained. Two maximally unrelated species were assigned at random to represent A. majus and A. charidemi. Trait evolution was simulated within the phylogeny under the assumption that mutations accumulate at similar rates in different lineages. The effect of each mutation was assigned at random between −1 and 1. This step was repeated until a history of trait evolution was obtained in which A. majus had the highest trait value and A. charidemi the lowest value with the difference between the two involving exactly nine detectable mutations with a magnitude of at least 0.4 (assumed as an arbitrary threshold for detection of QTL effects). This step was repeated to obtain 1000 trait histories meeting the criteria and the proportion in which all nine mutations created alleles acting in the parental direction was recorded. For nine mutations, the frequency distribution for the magnitude of QTL effects in each simulation approximates the upper tail of a positive gamma distribution assumed by Orr (1998) and Anderson and Slatkin (2003).
Accession Numbers
Sequence data from this article can be found in the GenBank/EMBL database under the accession numbers presented in Supplemental Table 2 online.
Supplemental Data
The following materials are available in the online version of this article.
Supplemental Figure 1. Correlations in Size within and between Organs.
Supplemental Figure 2. Segregation of PCF2 Values in F2 Hybrids.
Supplemental Figure 3. Loci Underlying Variation in Leaves or Petals.
Supplemental Table 1. Antirrhinum Accessions.
Supplemental Table 2. A Molecular Recombination Map for the A. majus × A. charidemi F2 Population.
Supplementary Material
Acknowledgments
We thank Isabel Mateu-Andrés, Thomas Gübitz, and Christophe Thébaud for providing seeds of various Antirrhinum species and Monique Burrus and Christophe Thébaud for help in collecting additional species accessions. This work was supported by Biotechnology and Biological Sciences Research Council (BBSRC) Grants BB/D5220891 to A.H., BB/D5223701 to A.B., and BB/D5224381 to E.C. Y.W. was supported by a BBSRC studentship and fieldwork grants from the Genetics Society and University of Edinburgh Development Trust.
The author responsible for distribution of materials integral to the findings presented in this article in accordance with the policy described in the Instructions for Authors (www.plantcell.org) is: Andrew Hudson (andrew.hudson@ed.ac.uk).
Some figures in this article are displayed in color online but in black and white in the print edition.
Online version contains Web-only data.
References
- Albertson, R.C., Streelman, J.T., and Kocher, T.D. (2003). Directional selection has shaped the oral jaws of Lake Malawi cichlid fishes. Proc. Natl. Acad. Sci. USA 100 5252–5257. [DOI] [PMC free article] [PubMed] [Google Scholar]
- Anastasiou, E., and Lenhard, M. (2007). Growing up to one's standard. Curr. Opin. Plant Biol. 10 63–69. [DOI] [PubMed] [Google Scholar]
- Anderson, E.C., and Slatkin, M. (2003). Orr's quantitative trait loci sign test under conditions of trait ascertainment. Genetics 165 445–446. [DOI] [PMC free article] [PubMed] [Google Scholar]
- Berg, R.L. (1960). The ecological significance of correlation pleiades. Evolution 14 171–180. [Google Scholar]
- Bratteler, M., Lexer, C., and Widmer, A. (2006). Genetic architecture of traits associated with serpentine adaptation in Silene vulgaris. J. Evol. Biol. 19 1149–1156. [DOI] [PubMed] [Google Scholar]
- Conner, J.K. (2002). Genetic mechanisms of floral trait correlations in a natural population. Nature 420 407–410. [DOI] [PubMed] [Google Scholar]
- de Jong, H. (1998). In search of historical biogeographic patterns in the western Mediterranean terrestrial fauna. Biol. J. Linn. Soc. Lond. 65 99–164. [Google Scholar]
- Frary, A., Fritz, L.A., and Tanksley, S.D. (2004). A comparative study of the genetic bases of natural variation in tomato leaf, sepal, and petal morphology. Theor. Appl. Genet. 109 523–533. [DOI] [PubMed] [Google Scholar]
- Galen, C. (2006). Solar furnaces or swamp coolers: costs and benefits of water use by solar-tracking flowers of the alpine snow buttercup, Ranunculus adoneus. Oecologia 148 195–201. [DOI] [PubMed] [Google Scholar]
- Goodall, C. (1991). Procrustes methods in the statistical analysis of shape. J. R. Stat. Soc., B 53 285–339. [Google Scholar]
- Gübitz, T., Caldwell, A., and Hudson, A. (2003). Rapid molecular evolution of CYCLOIDEA-like genes in Antirrhinum and its relatives. Mol. Biol. Evol. 20 1537–1544. [DOI] [PubMed] [Google Scholar]
- Huxley, J.S. (1932). Problems of Relative Growth. (London: Methuen & Co.).
- Juenger, T., Pérez-Pérez, J.M., Bernal, S., and Micol, J.L. (2005). Quantitative trait loci mapping of floral and leaf morphology traits in Arabidopsis thaliana: Evidence for modular genetic architecture. Evol. Dev. 7 259–271. [DOI] [PubMed] [Google Scholar]
- Kimura, M. (1962). On the probability of fixation of mutant genes in a population. Genetics 47 713–719. [DOI] [PMC free article] [PubMed] [Google Scholar]
- Klingenberg, C.P. (2003). Quantitative genetics of geometric shape: Heritability and the pitfalls of the univariate approach. Evolution 57 191–195. [DOI] [PubMed] [Google Scholar]
- Klingenberg, C.P., Leamy, L.J., Routman, E.J., and Cheverud, J.M. (2001). Genetic architecture of mandible shape in mice: Effects of quantitative trait loci analysed by geometric morphometrics. Genetics 157 785–802. [DOI] [PMC free article] [PubMed] [Google Scholar]
- Langlade, N.B., Feng, X., Dransfield, T., Copsey, L., Hanna, A.I., Thebaud, C., Bangham, A., Hudson, A., and Coen, E. (2005). Evolution through genetically controlled allometry space. Proc. Natl. Acad. Sci. USA 102 10221–10226. [DOI] [PMC free article] [PubMed] [Google Scholar]
- Macdonald, S.J., and Goldstein, D.B. (1999). A quantitative genetic analysis of male sexual traits distinguishing the sibling species Drosophila simulans and D. sechellia. Genetics 153 1683–1699. [DOI] [PMC free article] [PubMed] [Google Scholar]
- Maynard Smith, J., Burian, R., Kauffman, S., Alberch, P., Campbell, J., Goodwin, B., Lande, R., Raup, D., and Wolpert, L. (1985). Developmental constraints and evolution. Q. Rev. Biol. 60 265–286. [Google Scholar]
- McDonald, P.G., Fonseca, C.R., Overton, J.M., and Westoby, M. (2003). Leaf-size divergence along rainfall and soil-nutrient gradients: is the method of size reduction common among clades? Funct. Ecol. 17 50–57. [Google Scholar]
- Moe, A.P., and Smith, D.M. (2005). Using pre-quaternary diptera as indicators of paleoclimate. Palaeogeogr. Palaeoclimatol. Palaeoecol. 221 203–214. [Google Scholar]
- Orr, H.A. (1998). Testing natural selection vs. genetic drift in phenotypic evolution using quantitative trait locus data. Genetics 149 2099–2104. [DOI] [PMC free article] [PubMed] [Google Scholar]
- Parkhurst, D.F., and Loucks, O.L. (1972). Optimal leaf size in relation to environment. J. Ecol. 60 505–537. [Google Scholar]
- Rieseberg, L.H., Widmer, A., Arntz, A.M., and Burke, J.M. (2002). Directional selection is the primary cause of phenotypic diversification. Proc. Natl. Acad. Sci. USA 99 12242–12245. [DOI] [PMC free article] [PubMed] [Google Scholar]
- Robertson, A.H.F., and Grasso, M. (1995). Overview of the later Tertiary-Recent tectonic and palaeo-environmental development of the Mediterranean region. Terra Nova 7 114–127. [Google Scholar]
- Rothmaler, W. (1956). Taxonomische Monographie de Gattung Antirrhinum. (Berlin: Academie-Verlag).
- Seaton, G., Haley, C.S., Knott, S.A., Kearsey, M., and Visscher, P.M. (2002). QTL Express: Mapping quantitative trait loci in simple and complex pedigrees. Bioinformatics 18 339–340. [DOI] [PubMed] [Google Scholar]
- Stokes, V., Morecroft, M.D., and Morison, J.I.L. (2006). Boundary layer conductance for contrasting leaf shapes in a deciduous broadleaved forest canopy. Agric. For. Meteorol. 139 40–54. [Google Scholar]
- Sutton, D.A. (1988). A revision of the tribe Antirrhineae. (Oxford, UK: Oxford University Press).
- Vargas, P., Carrió, E., Guzmán, B., Amat, E., and Güemez, J. (2009). A geographical pattern of Antirrhinum (Scrophulariaceae) speciation since the Pliocene based on plastid and nuclear DNA polymorphism. J. Biogeogr. 36 1297–1312. [Google Scholar]
- Webb, D.A. (1971). Taxonomic notes on Antirrhinum L. Bot. J. Linn. Soc. 64 271–275. [Google Scholar]
- Zheng, Z.B., Liu, J., Stam, L.F., Kao, C.H., Mercer, J.M., and Laurie, C.C. (2000). Genetic architecture of a morphological shape difference between two Drosophila species. Genetics 154 299–310. [DOI] [PMC free article] [PubMed] [Google Scholar]
Associated Data
This section collects any data citations, data availability statements, or supplementary materials included in this article.


