

Abstract
We used DNA microarrays to measure transcription and iTRAQ 2D liquid chromatography-mass spectrometry/mass spectrometry (a mass-tag labeling proteomic technique) to measure protein expression in 14 strains of Escherichia coli adapted for hundreds of generations to growth-limiting concentrations of either lactulose, methylgalactoside, or a 72:28 mixture of the two. The two ancestors, TD2 and TD10, differ only in their lac operons and have similar transcription and protein expression profiles. Changes in transcription and protein expression are observed at 30–250 genes depending on the evolved strain. Lactulose specialists carry duplications of the lac operon and show increased transcription and translation at lac. Methylgalactoside specialists are galS– and so constitutively transcribe and translate mgl, which encodes a transporter of methylgalactoside. However, there are two strains that carry lac duplications, are galS–, and show increased transcription and translation at both operons. One is a generalist, the other a lactulose specialist. The generalist fails to sweep to fixation because its lac+, galS+ competitor expresses the csg adhesin and sticks to the chemostat wall, thereby preventing complete washout. Transcription and translation are sometimes decoupled. Lactulose-adapted strains show increased protein expression at fru, a fructose transporter, without evidence of increased transcription. This suggests that fructose, produced by the action of β-galactosidase on lactulose, may leach from cells before being recouped. Reduced expression, at “late” flagella genes and the constitutive gat operon, is an adaptation to starvation. A comparison with two other long-term evolution experiments suggests that certain aspects of adaptation are predictable, some are characteristic of an experimental system, whereas others seem erratic.
Keywords: evolution, specialists, generalists, protonomics, E. coli, lac, chemostats
Introduction
One obvious product of evolution is life's diversity—trees, birds, fish, germs, etc. Much of this diversity reflects ecological specialization. Trade-offs are commonly assumed to cause ecological specialization, yet rarely are demonstrated in rigorous controlled experiments. Other mechanisms can also produce specialists. Adaptation in different environments leads to independent specializations. Escherichia coli adapting to high temperatures do not lose fitness at low temperatures; E. coli adapting to low temperatures do not lose fitness at high temperatures (Bennett and Lenski 1993, 2007). Accumulation of mutations that are neutral in the current environment, but deleterious in other environments, such as temperature-sensitive mutations (Bennett and Lenski 1993) can produce specialists (Cooper and Lenski 2000). Independent specialization and mutation accumulation produce specialists without trade-offs.
Trade-offs, independent specializations, and mutation accumulation are not mutually exclusive mechanisms. Efforts to quantify their relative contributions in long-term adaptation experiments remain inconclusive (Elena and Lenski 2003; MacLean and Bell 2003). The role of trade-offs in ecological specialization remains elusive.
We are exploring the evolution of specialists and generalists using laboratory populations of E. coli competing for two limiting sugars, lactulose (galactosylfructose) and methylgalactoside, either singly or as a 72:28 mixture (Dykhuizen and Dean 2004; Zhong et al. 2004). Theory predicts, and experiments demonstrate, that two specialists may coexist whenever differential resource consumption generates stabilizing frequency-dependent selection (Lunzer et al. 2002). Small changes in fitness are predicted to destabilize the polymorphism, resulting in a selective sweep. Nevertheless, both initial specialists are usually retained for extended periods. In those cultures where one is lost, two newly evolved specialists derived from the remaining strain can be isolated. Not only do polymorphisms of specialists routinely evolve in long-term chemostat cultures but, even more remarkably, strains commonly switch resource specializations. Generalists are rare. The repeated independent evolution of resource specialists and resource switching strongly suggests, but is not definitive proof of, a role for trade-offs.
Genomic analysis of evolved strains (Zhong et al. 2004) reveals a major role for insertion sequences (ISs) in adaptation. IS-induced duplications of the lac operon are associated with specialization toward lactulose. IS insertions in galS disrupt the repressor of the mgl transport system and are associated with specialization toward methylgalactoside. Only one of 42 strains analyzed carries both a lac duplication and a galS disruption and appears to be a generalist. Other IS mutations, deletions extending into the fli operon (part of the flagellar regulon), and two deletions of the constitutively expressed gat operon, presumably confer their benefits by eliminating unnecessary gene expression. Regulation and gene expression are evidently major targets of adaptation.
RNA transcription profiling has been used to quantify gene expression changes during experimental evolution. Ferea et al. (1999) found parallel changes in transcript levels at genes responsible for glucose uptake and utilization in three lines of yeast evolved in glucose-limited cultures. Cooper et al. (2003) compared transcript profiles of two strains evolved for 20,000 generations by serial transfer in glucose minimal medium and showed parallel changes in 59 genes. Riehle et al. (2005) identified gene expression changes, some of which might be related to the evolution of the temperature niche. With the exception of the increased expression of transport systems during prolonged starvation (Novick and Horiuchi 1961; Horiuchi et al. 1962, 1963; Dean 1989; Sonti and Roth 1989; Ferea et al. 1999; Zhong et al. 2004), the deletion of unneeded constitutively expressed genes (Zhong et al. 2004), and the increased expression of enzymes involved in cross-feeding in an evolved commensalistic community derived from a single clone of E. coli (Rosenzweig et al. 1994), the physiological mechanisms underpinning adaptation to novel environments are not well understood, even when parallel beneficial mutations have been identified.
Several studies have shown that changes in transcription need not be matched by similar changes in protein expression (Griffin et al. 2002; Corbin et al. 2003; Greenbaum et al. 2003). This decoupling of transcription from translation means that microarray data alone are insufficient to make strong inferences with respect to organismal phenotypes, fitnesses, and adaptation. Although essential to many studies, microarray data should form only part of a more comprehensive approach to the study of adaptive evolution.
Here, we explore the evolution of gene regulation using microarray RNA transcript profiling and iTRAQ two-dimensional liquid chromatography mass spectrometry/mass spectrometry (2D LC–MS/MS) (Ross et al. 2004) protein expression profiling. Our goal is to identify changes in transcript levels and protein expression associated with specialization toward lactulose and methylgalactoside, to identify other changes in expression associated with adaptation to slow growth chemostats in general, and to determine whether these changes are always associated with IS mobilization or whether other mutations (e.g., base substitutions) also contribute.
Materials and Methods
Bacterial Strains
Escherichia coli strains TD2 and TD10 are the ancestral strains used to initiate all long-term experiments (table 1). They carry different lac operons but are otherwise genetically identical. Strains designated R (e.g., TD10R) carry a selectively neutral genetic marker, fhuA, that confers resistance to the bacteriophage, T5. TD10(R) and TD2(R) form a frequency-dependent balanced polymorphism on a 72:28 lactulose:methylgalactoside mixture (Lunzer et al. 2002). Long-term chemostat cultures were initiated with a pair of strains, one T5 sensitive and one T5 resistant (e.g., TD10 with TD10R or TD2R and TD10, etc.). Strains designated DD (e.g., DD2261) are isolates from long-term chemostat cultures with lactulose, methylgalactoside, or a 72:28 mixture of both as limiting resources (Dykhuizen and Dean 2004). After hundreds of generations of evolution, one sensitive and one resistant isolate were randomly chosen from each chemostat. Isolates from chemostats fed mixed sugars were shown capable of reestablishing the equilibrium T5R frequency seen in each evolved population at the time of sampling (and which had evolved away from the initial equilibrium). This demonstrates that the isolates are representative of the dominant lineages in each chemostat (Dykhuizen and Dean 2004).
Table 1.
Evolved Strains (Dykhuizen and Dean 2004)
| Chemostat | Sugars | Ancestor | Strain | Specializationa | Generation Isolated | Fitnessb on LU | Fitnessb on MG |
| TD2 | LU (ancestor) | ||||||
| TD10R | MG (ancestor) | 0.91 ± 0.004 | 1.31 ± 0.004 | ||||
| 1 | LU | TD2 | DD2459 | 598 | |||
| 1 | LU | TD2 | DD2460 | 598 | |||
| 10 | MG | TD2 | DD2557 | 332 | |||
| 10 | MG | TD2 | DD2558 | 332 | |||
| 19 | Mix | TD10 | DD2268 | Both | 471 | 1.23 ± 0.02 | 1.22 ± 0.01 |
| 19 | Mix | TD10R | DD2269R | 471 | |||
| 20 | Mix | TD2R | DD2253R | MG | 260 | ||
| 20 | Mix | TD10 | DD2255 | LU | 260 | 1.11 ± 0.01 | 0.78 ± 0.01 |
| 21 | Mix | TD10R | DD2302R | LU | 610 | 1.26 ± 0.01 | 0.90 ± 0.01 |
| 21 | Mix | TD2 | DD2304 | MG | 610 | ||
| 22 | Mix | TD10R | DD2261R | LU | 335 | 1.36 ± 0.02 | 0.48 ± 0.01 |
| 22 | Mix | TD2 | DD2262 | MG | 335 | ||
| 23 | Mix | TD10 | DD2266 | MG | 471 | ||
| 23 | Mix | TD10R | DD2267R | LU | 471 | 1.67 ± 0.001 | 0.39 ± 0.01 |
LU, lactulose; MG, methylgalactoside; Mix, 72:28 mixture of laculose:methylgalactoside; and R, resistance to phage T5.
Specialization as determined from relative fitnesses on pure sugars.
Fitness of evolved strain relative to its evolved partner.
The fitness of TD10R with respect to TD2 is 0.91 on lactulose and 1.31 on methygalactoside (table 1). Similarly, for example, the fitness of DD2255 with respect to DD2253 is 1.11 on lactulose and 0.78 on methylgalactoside. Specialists are defined by their fitnesses: DD2255 is a lactulose specialist and DD2253 is a methylgalactoside specialist. Fitnesses are not given for strains isolated from chemostats limited by single sugars. Partitioning the contribution to fitness made by specialization toward the limiting sugar from the contribution made by adaptation to the chemostat environment in general will require extensive genetic manipulations that, though planned, are beyond the scope of this study.
Transcript Profiling
RNA Extraction
Strains were grown at 37 °C in 30-ml chemostats at a dilution rate of 0.3 h−1 in minimal medium (Davis Salts; 40 mM K2HPO4, 15 mM KH2PO4, 7.6 mM (NH4)2SO4, 1.7 mM Na3Citrate, 1 mM MgCl2 at pH 7.3) (Miller 1972) with 0.2 g/l of either lactulose or methylgalactoside as the sole limiting resource and 10 μM isopropyl-β-D-thiogalactopyranoside (IPTG) (Dykhuizen and Dean 2004). After the population density (OD600) had stabilized (18–20 h after inoculation), the entire culture from each chemostat was poured into a 50-ml conical tube containing 3 ml of ice-cold ethanol/phenol stop solution (5% water-saturated phenol, pH < 7.0, in ethanol), centrifuged (4,000 rpm for 10 min at 4 °C), and the cell pellets stored at −80 °C. Total RNA was extracted using a Master RNA purification kit (Epicentre, Madison, WI) according to the manufacturer's instructions.
Microarrays and Data Analysis
Gene expression changes were identified by using parallel 2-color cDNA hybridizations to whole-genome E. coli MG1655 spotted DNA microarrays, which were designed and printed as described and contained 98.8% of all annotated open reading frames (Khodursky et al. 2000, 2003). Cy3 dUTP or Cy5 dUTP (Amersham Pharmacia) was incorporated into cDNA made from 15 to 20 g of total RNA using Scribe First-strand cDNA labeling Kit (Amersham Pharmacia). The labeled cDNA was purified using a Microcon-30 (Millipore). Replicate experiments were performed with a dye swap using two RNA samples from independent replicate populations (the number of RNA preparations was higher for strains TD2 and TD10 because 1) they were used in every hybridization and so more RNA needed to be extracted and 2) some preparations were thrown out because they had already increased levels of expression at lac or galS, both of which are strongly favored). Following data normalization, outliers and missing data were replaced by mean log2 ratio values (evolved strain:ancestor) from the other replicates. A fixed model analysis of variance (ANOVA) was performed for transcript level ratios of each evolved strain with respect to its ancestor. No significant Genes × Dyes interaction effects were detected and dyes swaps were treated as four independent replicates. Each analysis therefore had Genes and Sugars as main effects and a Genes × Sugars interaction effect. The Sugars main effect is zero because the data were normalized. Significant changes in transcript levels were identified using a 1% false discovery rate (Benjamini and Hochberg 1995).
iTRAQ Proteomics
Growth of Strains
Evolved strains were grown at 37 °C in 100-ml chemostats at a dilution rate of 0.3 h−1 using the same medium to which they had been adapted (minimal medium with 0.2 g/l of either lactulose, methylgalactoside, or a 72:28 mixture of both as the sole limiting resource and 10 μM IPTG). The ancestral strains, TD2 and TD10, were grown with lactose as the sole carbon/energy source to avoid selected changes in expression at lac and galS that arise rapidly. After reaching steady state (22–24 h after inoculation), the entire culture from each chemostat was harvested by centrifugation (4,000 rpm for 10 min at 4 °C), quick frozen, and stored at −80 °C. Each pair of evolved strains and their ancestors were grown in sets of four parallel chemostats.
Protein Extraction and iTRAQ Labeling
For the proteomic studies, iTRAQ Reagents (Applied Biosystems, Foster City, CA) were used to label protein samples, which enabled the simultaneous identification and quantification of peptides/proteins from four different samples in a single experiment. For each experiment, the growth, protein extraction, and iTRAQ labeling of the evolved strains and their ancestral strain were done in parallel sets of four.
Samples from four chemostats, including the ancestral strain, were prepared and labeled in parallel for analysis by 2D LC–MS/MS. The cell pellet from each chemostat was first resuspended in 500 μl of 0.5 M triethylammonium bicarbonate (pH 8.5) containing 0.1% CHAPS and 0.05% sodium dodecylsulfate as denaturants. The suspensions were sonicated three times for 20 s each on ice with a Branson Digital Sonifier (Model 250) equipped with a microtip at 25% amplitude. The suspensions were allowed to cool on ice between sonications. The samples were then centrifuged at 16,000 × g for 10 min at 4 °C. The supernatants (cell extracts) were divided into aliquots and stored at −80 °C. Protein concentrations were determined using the Bio-Rad Protein Assay Reagent with IgG as a standard.
The four samples were labeled in parallel, each with a separate iTRAQ Reagent, as recommended by the manufacturer (Applied Biosystems). Briefly, each extract was diluted in sonication buffer to 5 mg/ml protein, a 100 μg of protein reduced, and all cysteines blocked with the reagents supplied by the manufacturer. Proteins were digested overnight at 37 °C with 4 μg trypsin and the resulting peptides covalently labeled with an isobaric iTRAQ reagent at lysine side chains, N-terminal groups, and tyrosines. It is important to note that a labeled peptide displays the same mass and chromatographic properties whether labeled with iTRAQ Reagent 114, 115, 116, or 117.
Strong Cation Exchange Chromatography of Differentially iTRAQ-Labeled Sample Mixture
The strong cation exchange (SCX) chromatography of the labeled peptide mixture was conducted by the Center for Mass Spectrometry and Proteomics (University of Minnesota, Minneapolis, MN). The four differentially labeled sample digests were combined, the mixture dried in vacuo, resuspended in 0.1% trifluroacetic acid (TFA), and applied to a Sep-Pak C18 cartridge (Waters Corp., Milford, MA). After washing with 0.1% TFA, the peptide mixture was eluted with 80% acetonitrile (ACN) in 0.1% TFA. The eluted peptide mixture was dried in vacuo, reconstituted in 350 μl of Solution A (20% ACN, 5 mM KH2PO4 at pH 3.2), and subjected to SCX chromatography. The chromatography was performed on a Magic 2002 high-performance liquid chromatography system (Michrom Bioresources, Auburn, CA) using a polysulfoethyl A column (1.0 mm ID × 150 mm; 5-μm particles with 300 Å pores; Poly LC, Columbia, MD). Peptides were eluted at a flow rate of approximately 33 μl/min with Solution A and Solution B (Solution A containing 500 mM KCl) over a gradient of 0–20% B in 40 min, 20–100% B in 20 min, and constant 100% for 10 min. The absorbance of the eluent was monitored at 214 nm (peptide bonds) and 280 nm (aromatic residues) with fractions collected at 3-min intervals. Typically, the peptides eluted in 17 fractions, which showed mAU280 values >2. These fractions were dried in vacuo and then analyzed by reversed-phase LC–MS/MS.
Reversed-Phase LC–MS/MS Analysis
LC–MS/MS analysis of SCX fractionated peptides was performed by the Center for Mass Spectrometry and Proteomics (University of Minnesota, Minneapolis, MN) on a QSTAR Pulsar i mass spectrometer (Applied Biosystems) with an online Dionex/LC Packings (LCP, Sunnyvale, CA) C18 capillary liquid chromatography system as described previously (Nelsestuen et al. 2005). Each of the dried SCX fractions was reconstituted in 30 μl of the reversed-phase loading solution (2% ACN, 0.1% formic acid). The entire volume of fractions having an mAU280 value < 10 was loaded onto the LCP C18 precolumn (0.3 mm ID × 5 mm). Fractions having an mAU280 value > 10 (typically 12 fractions) were loaded and run twice. Half of the sample was loaded and the tandem mass spectrometry (MS/MS) data were collected as described below. The remaining portion of the fraction was then loaded and data collected using an exclusion list containing the acquired precursor mass/charge ratios (m/z) values from the first run.
After loading onto the C18 precolumn, each sample was washed with the loading solution for 17 min at a flow rate of 35 μl/min. Peptides were then eluted at the same flow rate onto an analytical capillary C18 column (75 μm ID) with solvents A (5% ACN, 0.1% formic acid) and solvent B (95% ACN, 0.1% formic acid) over a gradient of 0–35% B in 40 min, 35–80% B in 5 min, and 80–100% B in 2 min. Product ion spectra were collected in an information-dependent acquisition mode with continuous cycles of one full scan from 400 to 1100 m/z per 1.5 s followed by four product ion scans from 50 to 2000 m/z at 3 s each. The four precursor m/z values with the highest intensities were automatically selected for MS/MS fragmentation by the Analyst QS software (ABI) from the MS scan during acquisition. Collision energy was increased 20% for fragmentation of iTRAQ peptides. Neutral loss of the iTRAQ Reagent balancer groups during MS/MS fragmentation produces four reporter group ions in the 113–119 m/z region that can be used to quantify peptide expression. Unlabeled b and y ions are also generated and used for peptide identification.
Data Processing
The identification and quantification of the relative abundance of proteins was determined from the MS/MS data using the ProteinPilot 2.0 software (Applied Biosystems). All of the MS/MS data files obtained from the peptide fractions of a single SCX chromatography were searched together against the NCBI E. coli K12 protein database (RefSeq NC000913 and AC000091, Riley et al. 2006) which contains 8,772 proteins. The “thorough search effort” algorithm was used with the threshold for protein identification at 95% confidence. Common biological modifications and amino acid substitutions were automatically included in every search. The ProteinPilot software determines the relative abundance of each peptide in the evolved strain verses its ancestor by calculating the ratio of the peak areas of their iTRAQ reporter ions. These results are then compiled into protein groups based on the database search. Peptides shared between distinct proteins are not used in quantification. The average of the peptide iTRAQ ratios is calculated for each protein. This average ratio includes only those peptides for which all four iTRAQ reporter ions were detected. Data are normalized assuming that the majority of proteins do not show differential expression and that the median iTRAQ ratio of all the proteins is 1.
All proteins discussed were identified with a minimum of three peptides for quantification. The MS and MS/MS spectra of each was inspected manually and curated based on the precursor ion spectra.
Standard Polymerase Chain Reaction (PCR) and DNA Sequencing
Primers, used to amplify galS (the repressor of the mgl operon) and gat (the galactitol operon was amplified in two sections), were designed using the genomic sequence of E. coli K12 strain MG1665. Herculase DNA polymerase (Stratagene) was used with the following cycling conditions: 95 °C for 15 min, 35 cycles of 94 °C for 30 s, 60 °C for 90 s, 72 °C for 2 min, and a final extension step at 72 °C for 10 min. Amplicons were sized by agarose electrophoresis with a 1-kb DNA ladder as a standard. GalS fragments were purified using StrataPCR purification columns and sequenced by the Advanced Genetic Analysis Center at the University of Minnesota.
Curli Expression
Expression of the extracellular adhesin protein Curli was confirmed by the intense red staining of colonies on minimal glucose plates containing 0.1 g/l congo red (Hammar et al. 1995).
Results
Ancestral Strains TD2 and TD10
Ancestral strains TD2 and TD10 are genetically identical derivatives of E. coli strain K12 that carry different lac operons (Lunzer et al. 2002). Thus, except for the expression of the lactose operon, we expect the transcription profile and the protein expression for these two strains to be the same regardless of the environment. The next two sections test this assumption. But they also test the ability to use transcription profiling and proteomics to determine evolutionary change. If we find many genes that are expressed differently between these strains, we would question the reliability of these methods to distinguish evolutionary differences.
Transcription in Ancestral Strains TD2 and TD10
Overall, transcript profiles are similar for each strain regardless of which sugar, lactulose or methylgalactoside, was the limiting resource (i.e., all TD2LU:TD2MG transcript ratios ≈ 1 and all TD10LU:TD10MG transcript ratios ≈ 1, so that changing the chemostat sugar does not greatly affect transcription). An ANOVA of lactulose:methylgalactoside transcript ratios (table 2) produces no significant SxG (Strains by Genes) interaction term, indicating transcription responds similarly in both strains to the change in resource. Significance of the Genes term indicates transcription differs during growth on lactulose and on methylgalactoside. Seven genes (table 3) were identified with a 1% false discovery rate (Benjamini and Hochberg 1995). However, the changes in transcription are modest (generally less than 1.5-fold) and, with the possible exception of galP (a transporter that might be induced to scavenge galactose), there are no obvious reasons why any should be differentially expressed on the two sugars. We suspect these changes in transcript levels are either incidental or spurious. Data normalization eliminates any difference in the mean lactulose:methylgalactoside transcript ratios between the strains.
Table 2.
ANOVAs of Variance of Lactulose:Methylgalactoside Transcript Ratios in Ancestors TD2 and TD10
| Item | df | SS | MS | F | P |
| Strains | 1 | 0.0 | 0.0 | 0.0 | 1 |
| Genes | 4,141 | 563.4 | 0.136 | 1.39 | <0.0001 |
| S × G | 4,141 | 312.2 | 0.754 | 0.77 | 1 |
| Error | 10,612 | 1,039.6 | 0.979 | ||
| Total | 18,895 | 1,915.1 |
df, degrees of freedom; SS, sum of squares.
Table 3.
Seven Genes Differentially Expressed on Different Sugars in Ancestors TD2 and TD10
| b-Number | log2 LU/MG | SE | Gene | Function |
| b0719 | 0.45 | 0.11 | ybgD | Predicted fimbrial-like adhesin |
| b0879 | −0.51 | 0.11 | macB | Subunit of MacAB–TolC macrolide efflux |
| b1639 | 0.66 | 0.16 | mliC | Inhibitor of c-type lysozyme |
| b2943 | 0.52 | 0.11 | galP | Galactose transporter |
| b3287 | 0.36 | 0.08 | def | Peptide deformylase |
| b3306 | 0.66 | 0.16 | rpsH | 30S ribosomal subunit protein S8 |
| b3508 | 0.48 | 0.11 | yhiD | Predicted Mg++ transport ATPase |
SE, standard error.
When the ancestoral strains are compared directly, an ANOVA of TD2LU:TD10LU and TD2MG:TD10MG transcript ratios (table 4) on each of the two resources produces no significant R × G (Resources by Genes) interaction term. This supports our contention that transcription responds similarly to the change in resource in both strains. Significance of the Genes term indicates transcription at some genes differs between the strains. Twenty genes with modest changes in transcription were identified using a 1% false discovery rate (table 5). Again, there are no obvious reasons why any should be differentially expressed on the two resources. Other genes cotranscribed with the four genes, flgM, flgF, rpsD, and metE, show no evidence of changed expression. We suspect these changes in transcript levels are spurious. Data normalization eliminates any difference in the mean TD2:TD10 transcript ratios between the strains. We conclude that transcription profiles of the two ancestral strains are very similar—if they differ at all, they do so in minor ways.
Table 4.
ANOVA of TD2:TD10 Transcript Ratios on Lactulose and Methylgalactoside
| Item | df | SS | MS | F | P |
| Resources | 1 | 0.0 | 0.0 | 0.0 | 1 |
| Genes | 4,141 | 484.1 | 0.117 | 1.62 | <0.0001 |
| R × G | 4,141 | 309.5 | 0.075 | 1.04 | 0.0763 |
| Error | 29,508 | 2,133.0 | 0.072 | ||
| Total | 37,791 | 2,926.6 |
Table 5.
Twenty Genes Differentially Expressed in Ancestors TD2 and TD10 on Lactulose and Methylgalactoside
| b-Number | log2 LU/MG | SE | Gene | Function |
| b0308 | 0.29 | 0.07 | ykgG | Predicted transporter |
| b0473 | 0.33 | 0.07 | htpG | HSP90 chaperone subunit |
| b0532 | 0.46 | 0.10 | sfmD | Predicted outer membrane protein |
| b1023 | −0.42. | 0.10 | pgaB | Predicted esterase |
| b1071 | −0.32. | 0.07 | flgM | Anti-sigma factor for fliA |
| b1077 | −0.31. | 0.07 | flgF | Flagellar protein |
| b1241 | 0.43 | 0.10 | adhE | Alcohol dehydrogenase |
| b1272 | 0.20 | 0.05 | sohB | Predicted peptidase |
| b1348 | 0.45 | 0.10 | lar | Prophage gene |
| b1972 | 0.38 | 0.10 | yedZ | Inner membrane protein |
| b1973 | 0.63 | 0.10 | yedY | Reductase |
| b2742 | 0.41 | 0.10 | nlpD | Predicted outer membrane lipoprotein |
| b2761 | −0.19. | 0.05 | ygcB | Predicted protein |
| b3296 | 0.40 | 0.10 | rpsD | 30S ribosomal subunit protein S4 |
| b3591 | 0.48 | 0.10 | secG | Protein secretion complex |
| b3829 | 0.46 | 0.10 | metE | Methionine biosynthesis |
| b3890 | −0.44. | 0.10 | yiiF | Predicted protein |
| b4104 | 0.32 | 0.07 | phnE | Organophosphate ester transport |
| b4286 | −0.38. | 0.10 | b4286 | Predicted protein |
| b4347 | −0.38. | 0.10 | symE | Predicted toxin |
Protein Expression in Ancestral Strains TD2 and TD10
Protein expression was explored using trypsin-digested samples labeled with iTRAQ, mixed samples being fractionated by strong cation high-pressure liquid chromatography and separated by reversed-phase high-pressure liquid chromatography immediately before entering an electrospray ion trap mass spectrometer for peptide identification and quantification. The sample preparation used is biased against hydrophobic (e.g., membrane) proteins.
An example of iTRAQ 2D LC–MS/MS proteomics data (fig. 1) illustrates how a single peptide can be isolated, fragmented, sequenced, and expression quantified in four strains simultaneously. Mass spectrometry is extraordinarily precise in determining mass charge (m/z) ratios so sequencing errors are rare. Intensities, being subject to vagaries in sample preparation, are less precisely determined. Often, as in this example, numerous peptides from the same protein can be identified. Averaging them improves expression estimates. iTRAQ proteomics routinely identifies peptides from more than 450 proteins and can be used to confirm changes in transcription rates and, where systematic discrepancies arise, point to the possibility of translational regulation of specific mRNAs.
FIG. 1.—
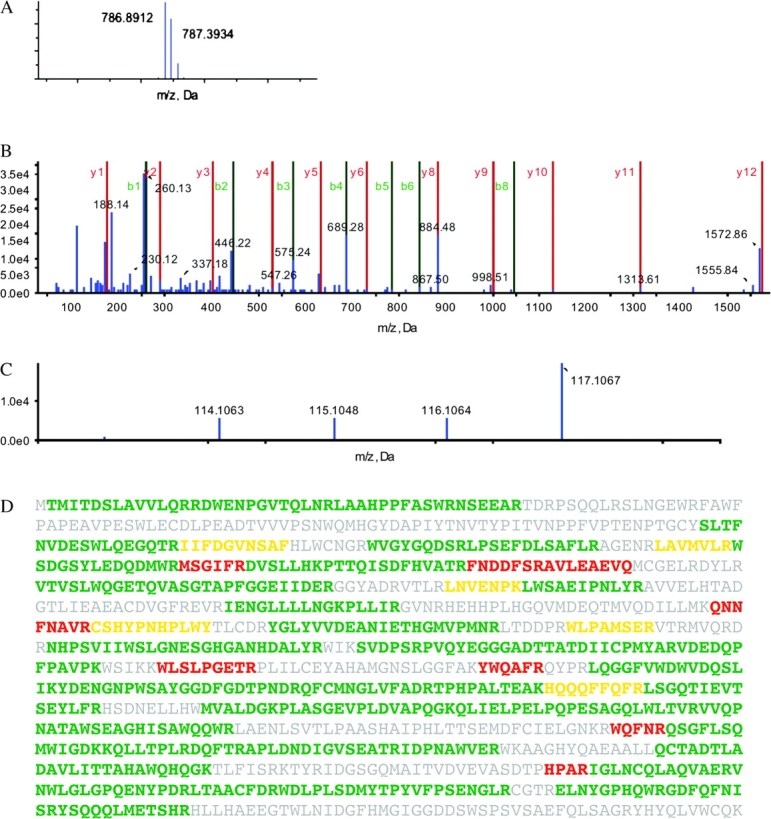
iTRAQ data for a β-galactosidase peptide from ancestors TD10 and TD10R and the evolved specialists DD2266 (methylgalactoside) and DD2267R (lactulose). (A) The precursor ion spectrum of the peptide DWENPGVTQLNR—intensity plotted against m/z ratio. The three peaks represent differences in stable isotope composition. The mass of the dominant peak differs from expected by 1 in 105. (B) The MS/MS (tandem mass spectrometry) spectrum of the DWENPGVTQLNR peptide showing the b and y ions produced by random fragmentation of its peptide bonds. Peptide sequences are determined from the differences in the m/z (mass/charge) ratios of sequential ions. Although many b and y ions (red and green) are not observed because the DWENPGVTQLNR is only partially fragmented, a sufficient number (blue) match the expected to allow unambiguous identification and quantification. (C) The reporter ion spectrum reveals that only the lactulose specialist (DD2267R) has increased expression: 114.1 TD10 (ratio 1:1), 115.1 TD10R (ratio 0.92:1), 116.1 DD2266 (ratio 0.81:1), 117.1 DD2267R (ratio 3.54:1). (D) Peptide coverage of β-galactosidase. Identification confidence: >95%, green; >50%, yellow; <50%, red; no match, gray.
Strains TD2 and TD10 showed very similar patterns of protein expression. TD2 showed significantly higher expression of LacA than TD10 (log2(TD2/TD10) = 3.45 ± 0.75). No other significant differences in expression were detected among the 740 proteins quantified. We conclude that translation profiles of the two ancestral strains are very similar.
Transcription in Evolved Strains
We analyzed transcript levels in seven pairs of evolved strains that had evolved together: one pair adapted to 100% lactulose, one pair adapted to 100% methylgalactoside, and five pairs adapted to a 72:28 lactulose:methylgalactoside mixture. Unlike the other five strains, the first two pairs could have a common ancestor within the experiment. Each evolved strain was grown in a chemostat on a pure resource, RNA isolated, reverse transcribed, and competitive hybridization used to assess any changes in transcript levels between the ancestor and the descendent. ANOVAs of evolved strain:ancestor transcript Log2 ratios are strongly significant with respect to differences in gene expression (many are greater than 4-fold). The frequency distribution of 906 effects determined to be significant (α = 0.01) by ANOVAs for the 14 evolved strains analyzed (fig. 2) shows that transcript levels of certain genes are routinely changed during evolution. In contrast, R × G interactions are rare and more nearly binomially distributed. One possibility is that R × G interactions are erratic in their evolution. More probably they are artifacts of sophisticated experimental procedures. Most are weakly significant (the overwhelming majority of which are less than 1.5-fold) and the one notable exception described below is indeed an artifact.
FIG. 2.—

Plot showing the frequency distribution of effects determined to be significant (α = 0.01) by ANOVAs for each of 16 strains analyzed. The line denotes the frequencies expected from a binomial distribution: (α + (1 − α))n, with significance level α = 0.01 and n = 14. A large excess of Gene effects (dots) indicates that transcript levels of certain genes routinely change during evolution. The R × G interaction (squares) effects are rare and more nearly binomially distributed. Either R × G interaction effects are erratic in their evolution or they are artifacts of sophisticated experimental procedures. A 1% false discovery rate yields a similar plot in which the number of strains with a uniquely significant effect is reduced.
Given the huge number of comparisons made, keeping a significance level at α = 0.01 is likely to produce a considerable number of unique false positives. We therefore used a 1% false discovery rate (Benjamini and Hochberg 1995) to identify significant changes in expression in individual strains. By this criterion, 661 transcript levels (rather than 906) of 4,141 genes were identified as changed using a 1% false discovery rate.
Each strain had a unique pattern of transcriptional change. However, an overall impression of the pattern of transcriptional evolution can be obtained by summing the number of significant increases and decreases in transcription for each gene (fig. 3). Increased transcript levels are common at lac, mgl, and galP. Increased transcription at the maltose regulon (malEKM, malP, and lamB) is also observed in some strains. Lower transcript levels are evident at gat. Lower transcript levels are routinely observed at fliE-R, fliC-T, and other genes involved with motility (flgK-M, trg, che, aer, yhjH, and tsr). However, some genes involved with motility often show increased levels of expression (flgA-J, flhA, and fliAZY). Changes in gene transcription of outer membrane proteins are common, with increases at yraJ and fec and reductions at ompA, ompC, fadL, and fimA.
FIG. 3.—

Repeatability of experimental evolution across the Escherichia coli chromosome for genes with at least three significant changes. For each gene, the number of significant increases is summed and the number of significant decreases subtracted. Genes within the dashed lines have only three or four significant changes. Genes within boxes are genes of a single operon. Red, sugar transport and metabolism; blue, motility; brown, cell wall; black, known functions; and white circles, unknown functions.
Protein Expression in Evolved Strains
With between 450 and 600 proteins quantified per strain, coverage of protein expression is not as extensive as that for transcription. Changes in protein expression ratios (evolvant:ancestor) correlate with changes in transcript ratios (fig. 4). A linear regression, with different slopes for different evolved strains, yields an r2 = 0.32 (r2 range from 0.01 to 0.49 for individual strains). By definition, r2 = 0 for regressions of an ancestor on itself (in the absence of changes all ratios are unity and all deviations are experimental errors). Consequently, the correlations depend on the number and magnitude of evolved changes in expression that have arisen. Removing ratios not significantly different from unity for both RNA and protein improves the fit with an r2 = 0.57 (r2 range from 0.04 to 0.68 for individual strains). One expects an r2 = 1 if transcription and translation are tightly coupled. Some of the scatter is undoubtedly caused by experimental error. However, some changes do not appear coupled. In particular, a number of highly expressed proteins show no evidence of similar changes in RNA transcript levels. Even when the analysis is restricted to significant changes in both protein expression and transcription levels, 24% of observations involve a significant increase in one and a significant decrease in the other (table 6). These results suggest that a significant amount of posttranscriptional regulation occurs in E. coli.
FIG. 4.—

The correlation between changes in protein expression and changes in transcript levels for 14 evolved strains. Correlated changes involved with resource use (red circles) include duplications at lac and lowered constitutive expression at, or deletion of, gat. Correlated changes involved with motility (blue circles) are mostly deletions involving the fli and lowered expression at che. Other correlated changes (black circles) include changes at modA and pps and unique events. Increased protein expression is not always associated with changes in transcript levels. Increases in protein abundances for fructose metabolism (fru, red dots) and motility (flgA, flgM, and fliA, blue dots) repeatedly occur without change in transcript levels. The other proteins that increase uniquely in one culture are shown as black dots.
Table 6.
Contingency Table of Significant Changes in Transcript Levels and Protein Abundance of Evolved Strains Relative to Ancestors
| Protein |
||
| – | + | |
| RNA | ||
| – | 148 | 36 |
| + | 35 | 80 |
Notable Changes in Expression
Below we describe changes in expression, either in transcription or translation, that either occur repeatedly across replicate chemostat experiments or unique events that are supported by additional experimental evidence.
Increases in lac Expression
Though they vary greatly in size and number of repeats, every IS-generated lac duplication spans a small region extending from prpC through the entire operon into lacI (Zhong et al. 2004). Every lac duplication shows increased transcription (fig. 5). Adjacent genes codAB (cytosine salvage pathway), cynX (putative cyanate transporter), and mhpR (transcriptional regulator of the 3-hydroxyphenylpropionate degradation pathway) routinely produce increased transcript levels when duplicated, though whether or not these affect fitness is not known. Not all duplicated genes show significant changes in transcription, however (fig. 5). iTRAQ proteomics, with less coverage than microarrays, nevertheless confirms increased protein expression of CodA, LacA, and LacZ and, in some lac-duplicated strains, of PrpC and MhpR (table 7).
FIG. 5.—

The effect of gene dosage on transcription. Duplications (horizontal lines with strain numbers) center on the lac operon. Increased transcription at linked genes is partly attributable to gene dosage (note the decline as one moves away from lac) and partly to other causes (the correlation is not perfect), including experimental error.
Table 7.
Changes in Transcription and Translation
| DD Strain | 2459 | 2460 | 2557 | 2558 | 2268 | 2269 | 2253 | 2255 | 2302 | 2304 | 2261 | 2262 | 2266 | 2267 |
| Ancestor | TD2 | TD2 | TD2 | TD2 | TD10 | TD10 | TD2 | TD10 | TD10 | TD2 | TD10 | TD2 | TD10 | TD10 |
| Specialty | LU | LU | MG | MG | Both | — | MG | LU | LU | MG | LU | MG | MG | LU |
| Medium | LU | MG | Mix | Mix | Mix | Mix | Mix | |||||||
| Specialist Resource Usage | ||||||||||||||
| lacZYA | ||||||||||||||
| DNA | dup | dup | — | — | dup | — | — | dup | — | — | dup | — | — | dup |
| RNA | ↑ | ↑ | — | — | ↑ | — | — | ↑ | ↑ | — | ↑ | — | — | ↑ |
| Protein | ↑ | ↑ | — | — | ↑ | — | — | ↑ | ↑ | — | ↑ | — | — | ↑ |
| mglBAC | ||||||||||||||
| galS | — | — | — | IS | IS | — | mis | — | — | mis | mis | mis | IS | — |
| RNA | — | — | — | ↑ | ↑ | — | ↑ | — | — | ↑ | ↑ | ↑ | ↑ | — |
| Protein | — | — | — | ↑ | ↑ | — | ↑ | — | — | ↑ | ↑ | ↑ | ↑ | — |
| Cross-Feeding or Recouping | ||||||||||||||
| fruBKA | ||||||||||||||
| DNA | — | — | — | — | — | — | — | — | — | — | — | — | — | — |
| RNA | — | — | — | — | — | — | — | — | — | — | — | — | — | — |
| Protein | ↑ | ↑ | — | — | ↑ | ↑ | ↑ | ↑ | ↑ | ↑ | ↑ | — | ↑ | ↑ |
| gal | ||||||||||||||
| DNA | — | — | — | — | — | — | — | — | — | — | — | — | — | — |
| RNA | — | — | — | — | — | — | — | — | — | — | — | — | — | — |
| Protein | — | — | — | ↑ | — | — | ↑ | — | — | ↑ | — | — | — | — |
| manXYZ | ||||||||||||||
| DNA | — | — | — | — | — | — | — | — | — | — | — | — | — | — |
| RNA | — | — | ↓ | — | — | — | ↑ | — | — | ↓ | ↑ | — | — | — |
| Protein | ↑ | ↑ | ↓ | — | — | ↑ | ↑ | ↑ | — | — | — | ↑ | — | — |
| aceBKA | ||||||||||||||
| DNA | — | — | — | — | — | — | — | — | — | — | — | — | — | — |
| RNA | — | — | ↑ | — | — | — | — | — | — | — | — | — | — | — |
| Protein | ↓ | ↓ | ↑ | — | — | — | ↓ | — | ↓ | ↓ | — | ↓ | ↓ | ↓ |
| Chemostat | ||||||||||||||
| malGFE/malKL(lamB)M | ||||||||||||||
| DNA | — | — | — | — | — | — | — | — | — | — | — | — | — | — |
| RNA | — | — | — | — | — | — | — | — | ↑ | — | ↑ | — | — | ↓ |
| Protein | ↓ | ↓ | — | ↓ | ↓ | ↓ | — | ↓ | ↓ | — | — | — | ↓ | ↓ |
| gat | ||||||||||||||
| DNA | — | Δ | — | — | — | — | — | — | — | — | — | — | — | — |
| RNA | ↓ | ↓ | ↓ | — | — | — | — | ↓ | ↓ | ↓ | ↓ | ↓ | — | ↓ |
| Protein | ↓ | ↓ | ↓ | — | — | — | — | ↓ | ↓ | ↓ | ↓ | ↓ | — | ↓ |
| cheZYBRtar, cheWA,motBA, tsr | ||||||||||||||
| DNA | — | — | — | — | — | — | — | — | — | — | — | — | — | — |
| RNA | ↓ | ↓ | — | — | ↓ | ↓ | — | ↓ | ↓ | ↓ | ↓ | — | ↓ | ↓ |
| Protein | ↓ | ↓ | — | — | ↓ | ↓ | — | ↓ | ↓ | ↓ | ↓ | — | ↓ | ↓ |
| fliF-K, fliL-R | ||||||||||||||
| DNA | Δ | Δ | — | — | Δ | — | — | Δ | Δ | Δ | Δ | — | — | — |
| RNA | ↓ | ↓ | — | — | ↓ | ↓ | — | ↓ | ↓ | ↓ | ↓ | — | — | — |
| Protein | ↓ | ↓ | — | — | ↓ | ↓ | — | ↓ | ↓ | ↓ | ↓ | — | — | — |
| flgB-L | ||||||||||||||
| DNA | — | — | — | — | — | — | — | — | — | — | — | — | — | — |
| RNA | ↑ | — | ↑ | — | ↑ | ↓ | ↑ | ↑ | ↑ | ↑ | ↑ | — | — | ↑ |
| Protein | ↑ | — | — | — | ↑ | ↓ | — | ↑ | ↑ | ↑ | ↑ | — | — | ↑ |
| fliZYA/flgM | ||||||||||||||
| DNA | — | — | — | — | — | — | — | — | — | — | — | — | — | — |
| RNA | ↑ | ↑ | — | — | — | — | — | — | ↑ | ↑ | ↑ | — | — | ↑ |
| Protein | ↑ | ↑ | — | — | ↑ | ↓ | — | ↑ | ↑ | ↑ | ↑ | — | — | ↑ |
LU lactulose, MG methylgalactoside, dup duplication, Δ deletion, and mis missense mutation, ↑ increased expression, ↓ decreased expression.
Strong R × G interactions were detected at lac. Transcript levels were consistently higher in cells harvested from lactulose-limited chemostats than in cells of the same strain harvested from methylgalactoside-limited chemostats. Duplications at lac have never been observed during adaptation to methylgalactoside (Dykhuizen and Dean 2004). Not only are tandem duplications highly unstable (Bergthorsson et al. 2007), but also overexpression of lac proteins is strongly deleterious during starvation in chemostats (Stoebel et al. 2008). We consider the lower transcript levels seen in strains grown on methylgalactoside an artifact generated by selection favoring newly arisen lineages with contracted lac duplications.
Increases in fruBKA Expression
iTRAQ protein expression data shows many evolved strains have increased protein expression of FruA, FruB, and FruK, albeit without evidence of increased transcription at fruBKA (table 8). However, there is a real concern that the increased protein expression of FruA, FruB, and FruK seen in the evolved strains grown on the mixed sugars might be an artifact of having to grow the ancestors on lactose where there is no fructose (a product of lactulose hydrolysis) available to induce transcription at fruBKA.
Table 8.
ANOVA of Transcript Ratios at fruBKA in Evolved Strains
| Item | df | SS | MS | F | P |
| Strain | 9 | 0.879 | 0.098 | 1.01 | 0.43 |
| Resource | 1 | 0.019 | 0.019 | 0.19 | 0.66 |
| Gene | 2 | 0.106 | 0.053 | 0.55 | 0.58 |
| S × R | 9 | 1.279 | 0.142 | 1.48 | 0.16 |
| S × G | 18 | 1.869 | 0.104 | 1.08 | 0.38 |
| R × G | 2 | 0.494 | 0.247 | 2.57 | 0.08 |
| S × R × G | 18 | 0.790 | 0.044 | 0.45 | 0.97 |
| Error | 123 | 11.839 | 0.096 | ||
| Total | 182 | 17.361 |
Evolved strains grown on methylgalactoside have the same fruBKA transcript levels as the ancestors grown on methylgalactoside and evolved strains grown on lactulose have the same fruBAK transcript levels as the ancestors grown on lactulose (table 8). Crucially, ancestors grown on methylgalactoside have the same fruBAK transcript levels as ancestors grown on lactulose (table 9). Therefore, transcript levels at fruBAK are unchanged in all strains in all environments. The increased protein expression of FruA, FruB, and FruK seen in the evolved strains occurs without change in fruBAK transcript levels, although whether this is a physiological or an evolved response is yet to be determined.
Table 9.
ANOVA of Lactulose:Methylgalactoside Transcript Ratios at fruBKA in Ancestors TD2 and TD10
| Item | df | SS | MS | F | P |
| Strains | 1 | 0.071 | 0.071 | 0.51 | 0.50 |
| Genes | 2 | 0.192 | 0.096 | 0.68 | 0.54 |
| S × G | 2 | 0.176 | 0.088 | 0.62 | 0.57 |
| Error | 6 | 0.845 | 0.141 | ||
| Total | 11 | 1.284 |
Fructose, liberated during the hydrolysis of lactulose by β-galactosidase, might leach from cells only to be recouped by the PTS transport system's fructose-specific components FruA and FruB. The fructose, now phosphorylated and less membrane permeable, is converted by FruK (1-phosphofructokinase) into fructose 1,6 bisphosphate, which enters central metabolism. Increased protein expression of FruA, FruB, and FruK is sometimes accompanied by increased protein expression of PTS transport system components (table 7) including Hpr and PtsI and PtsG (glucose specific) and ManX (hexose, including fructose, specific). This supports the idea that hexoses are being recouped. Although sometimes confirmed by increased transcript levels at manX, the result is not confirmed by increased cotranscription of manY and manZ. However, the source of phosphoenolpyruvate used by the PTS system, the ppsA-encoded phosphoenolpyruvate synthetase, is generally less abundant than in the ancestral strains with no apparent change in rates of transcription. Thus, the data are consistent with cross-feeding, although the extent to which the physiological changes are attributable to an evolutionary adaptive response is yet to be determined.
Increases in mgl Expression
IS inserts in galS disrupt the repressor of the mgl operon that encodes a glucose–galactose transport system with a serendipitous affinity for methylgalactoside. All strains with IS inserts in galS have greatly increased mgl transcript levels. Four strains, DD2253, DD2261, DD2262, and DD2304 do not have IS inserts in galS yet also display increased mgl transcript levels. Sequencing reveals each galS allele carries either a nonsense mutation or a missense mutation. Evidently, increases in expression at mgl are adaptations to growth on methylgalactoside whatever their provenance. iTRAQ proteomics confirms increased protein expression at mgl.
Increases in gal Expression
Increased transcription at galP is common and suggests that galactose, liberated by the intracellular action of β-galactosidase, may leach from cells only to be recouped by the high affinity H+-coupled galactose symporter. iTRAQ proteomics failed to identify GalP peptides. Transcription at galETKM is significantly higher in strains DD2261 and DD2262 and iTRAQ proteomics results, although not significant, confirm the trend. Strains DD2558, DD2253, and DD2304 show no evidence of increased transcription yet iTRAQ proteomics consistently shows increased Gal protein expression.
Changes in mal Expression
Increased transcription at the maltose regulon (malEKM, malP, and lamB) is found in strains DD2557 and DD2261 but iTRAQ proteomics finds no evidence of changed protein levels. iTRAQ proteomics reveals reduced protein expression in many strains (DD2459, DD2460, DD2268, DD2269, DD2255, and DD2302) but without any evident reductions in transcript levels. Only in DD2267 are reduced transcript levels matched by reduction in protein expression.
Reductions in gat Expression
Wild-type E. coli K12 has an IS3 inserted in gatR that disrupts the repressor of the galactitol operon. Many evolved strains display lowered transcript levels at gat. In strains DD2459 and DD2460, the IS3 transposed into yegW to delete the entire gat operon (Zhong et al. 2004). Other evolved strains with lower gat transcript levels retain the operon (confirmed by PCR). iTRAQ proteomics confirms that protein expression at gat is reduced in these strains.
Changes in Motility Gene Expression
Transcription of fliE-R, fliC-T, and many other motility genes (flgK-M, ycgR, trg, che, aer, yhjH, and tsr) is reduced in many strains. In all but one case, an IS1-d inserted at yedX in the ancestors TD2 and TD10 transposes into the fliE-R operon (Zhong et al. 2004). Crucially, the deletions either remove or disrupt fliR, a component of the flagellar export apparatus needed, among other things, to export the flgM encoded anti-σ28 factor. Transcription from class III flagellar promoters requires the fliA-encoded σ28. Unable to export FlgM, σ28-dependent transcription of the “late” flagellar genes is suppressed. Deletion or reduced transcription of fliT, an inhibitor of transcription from class II promotors, probably accounts for the increased transcription of the “middle” flagellar genes in the flg, flh, and fliAZY operons. iTRAQ proteomics confirms that protein expression is reduced for FliG, FliC, CheZ, CheY, Tar, CheW, CheA, Tsr, Aer, Trg, and YcgR and increased for FlgH, FlgM, and FliA.
These deletions necessarily remove dsrB (unknown function), dcm, vsr, rcsA, and dsrA, which lie between yedX and fliR. Low levels of expression make changes in transcription and protein expression difficult to identify (occasionally dsrB and dcm display significantly reduced levels of transcription). Dcm is a DNA cytosine methylase that methylates the second C in 5′-CCWGG sequences (Lieb and Bhagwat 1996). Vsr is the very short patch repair mismatch endonuclease that nicks DNA in 5′-CTWGG sequences following deamination of the 5-methylcytosine to thymine in the second position. Deleting both genes eliminates both mutator and repair system and is anticipated to produce a modest reduction in the mutation rate (Lieb 1991). RcsA is a transcriptional regulator of flagella, capsular polysaccharide, and curli synthesis (Vianney et al. 2005). However, we find no evidence that loss of RcsA has any impact on transcription in the capsular polysaccharide (wza, wzb, wzc, and wcaAB) and curli (csg) operons. dsrA is a small antisense RNA that stimulates translation of the alternative sigma factor RpoS (Majdalani et al. 2005).
Changes in Expression of Outer Membrane Proteins
We find significant changes in the transcription of outer membrane proteins; increases at yraJ and fec and reductions at ompA, ompC, fadL, and fimA. iTRAQ proteomics failed to detect some hydrophobic proteins.
Changes in the Expression of the csg Operon
Strain DD2269 was observed to stick to chemostat glass walls. There was a significant increase in transcription of the csg operon in strain DD2269. Proteomic anaylses failed to identify csg-encoded proteins as upregulated. However, protein sample preparations bias against hydrophobic proteins. Instead, the hypothesis that expression of curli adhesins increased was confirmed by staining cells with congo red (Hammar et al. 1995).
Other Changes in Transcription and Translation
A number of genes show significantly increased transcription in some strains and significantly reduced transcription in others. For example, cspD shows increased transcription in three strains and decreased transcription in three others. Other changes are difficult to rationalize without extensive biochemical and physiological investigations. Reduced transcription of two tricarboxylic acid cycle enzymes (sdh and suc) and increased transcription of the dicarboxylate transporter (dctA) are just a few of many examples. Hierarchical clustering (Eisen et al. 1998) failed to resolve these transcriptional changes into known regulons (fig. 6). Occasional increases and decreases in the transcription of individual genes may reflect experimental noise, particularly when other cotranscribed genes evince no changes.
FIG. 6.—

Hierarchical clustering (Eisen et al. 1998) identifies changes at the mgl, lac, gat, and motility operons but fails to resolve other transcriptional changes into known regulons.
iTRAQ proteomics confirms changes in transcription at many genes, for example, with reduced expression of the molybdate ABC-type transporter (ModA) and increased expression of the ATP-driven copper transporter (CopA). In other instances, iTRAQ proteomics fails to confirm the changes anticipated from microarray studies. For example, lower transcript levels at melA appear as increases in protein expression of the encoded α-galactosidase. As with FruA, FruB, and FruK, iTRAQ proteomics sometimes detects changes in protein expression where no changes in transcript levels are apparent.
Discussion
As FruBKA dramatically demonstrates, reproducible changes in protein expression can be produced without changes in transcript levels. There is indirect evidence in Salmonella that fruBKA protein expression is regulated at the level of translation (Sittka et al. 2008). Deletion of hfq, which encodes a global posttranslational small RNA dependent regulator, results in higher expression of fruB among many other proteins. Hfq is not implicated in other discrepancies apparent in table 7. Regardless of the mechanism, our parallel data sets show that changes in transcription and translation need not move in parallel.
A number of experimental evolution experiments and population genetic surveys have made use of genomewide transcript profiling (e.g., Gilad et al. 2006; Agudelo-Romero et al. 2008; Genissel et al. 2008; Le Gac et al. 2008; St-Cyr et al. 2008; Vijayendran et al. 2008). Patterns of transcription differ among individuals, populations, ancestors, descendents, and closely related species. Correlations with other patterns of variation can be shown to be statistically significant. But as to why they differ is rarely explored further and hardly ever subjected to definitive testing.
Our approach has been to devise a structured experiment to explore a ubiquitous bipartite phenomenon—the evolution of specialists and generalists. Specialists can arise through any of three mechanisms (Elena and Lenski 2003): passively accumulated neutral mutations that prove deleterious in another environment (mutation accumulation), beneficial mutations that prove selectively neutral in another environment (independent specialization) and, lastly, beneficial mutations that are deleterious in another environment (antagonistic pleiotropy). Populations growing on pure sugars can specialize by any or all of these three mechanisms. Those growing on mixed sugars cannot specialize by mutation accumulation because any mutation selectively neutral for one sugar and deleterious for the second must be purged by selection. Independent specialization is expected to produce generalists. Antagonistic pleiotropy forces specialization.
Specialists and Generalists
Duplicating lac is an adaptation to growth on lactulose (Zhong et al. 2004). Constitutive mgl expression (galS−) is an adaptation to growth on methylgalactoside (Zhong et al. 2004). In both cases, benefits are predicted to derive from the increased transport of limiting nutrients, although increased rates of hydrolysis by β-galactosidase will make a small contribution in the case of lac duplications (Dean 1989, 1995). Evolution in a limiting mixture of 72:28 lactulose:methylgalactoside usually produces a balanced polymorphism of two specialists: one ecotype carries a lac duplication and is fittest on lactulose, the other ecotype is mgl constitutive and is fittest on methylgalactoside. Only one of 26 strains isolated from 13 long-term evolution experiments on the mixed sugars is a galS−,lacdup generalist (Dykhuizen and Dean 2004). Although these observations suggest specialization through antagonistic pleiotropy, the presence of just one generalist shows that antagonistic pleiotropy is not ubiquitous.
Invading a New Niche
How is the galS+,lac+ strain DD2269 maintained in the presence of the galS−,lacdup generalist DD2268? DD2269 manages to persist at low frequency (ca. 1%) even though transcription and protein expression at mgl and lac are no different from wild type. This is achieved by increased expression of csg, the curli operons, which produce and export a fibrous surface protein (the presence of which was confirmed by staining with congo red, Hammar et al. 1995) that enables cells to stick to the glass wall of the chemostat, thereby preventing complete washout. Perhaps in response to increased curli expression transcription of clpB, which encodes a protein that resolubilizes aggregated proteins, is also increased. Similar to the adaptive radiation of Pseudomonas in static microcosms (Rainey and Travisano 1998), the spatial heterogeneity provided by a chemostat wall represents a new niche to be exploited.
Genotype versus Phenotype
Another galS−,lacdup strain, DD2261, is not a generalist but a lactulose specialist; DD2261 is fitter on lactulose and less fit on methylgalactoside than its galS− competitor DD2262 (Dykhuizen and Dean 2004). The suggestion that lacdup might reduce galS− fitness on methylgalactoside points to a role for “antagonistic pleiotropy” in the evolution of specialists and generalists. Certainly, antagonistic pleiotropy between lacdup and galS− alleles provides a handy explanation for why specialists are commonplace, but it does not explain why generalists exist. Perhaps rare—and as yet unidentified—background mutations negate the proposed antagonistic pleiotropy.
Cross-Feeding or Recouping?
Cross-feeding among evolved strains can also maintain diversity (Rosenzweig et al. 1994). Increased protein expression of fruBKA is evident following adaptation to pure lactulose (hydrolysis of which releases galactose and fructose) but not methylgalactoside (hydrolysis of which releases galactose and methanol). Similar increases in protein expression are seen in strains adapted to mixed sugars, including methylgalactoside specialist. Whether extensive cross-feeding between competitors occurs is by no means certain, for the majority of fructose leached into the periplasm of either strain might be recouped before it ever has a chance to diffuse into the environment. Moreover, the potential impact of cross-feeding in maintaining diversity might possibly be negated by the fact that all strains increase expression of fruBKA in the presence of lactulose.
Increased protein expression, but not increased transcription, is sometimes evident at galETKM following adaptation to methylgalactoside. Similar increases seen during adaptation to mixed sugars are found in several methylgalactoside specialists but not in the six lactulose specialists. It is not obvious why increases in gal protein expression should be so restricted—galactose is released upon the hydrolysis of either sugar. Increased transcription at galP, the low affinity galactose transporter, is evident in many strains but iTRAQ proteomics protocol did not detect this hydrophobic membrane protein. Again, whether or not extensive cross-feeding between competitors occurs is not known.
Strains DD2557 and DD2558 were isolated from a culture adapted to pure methylgalactoside. DD2558 was, as expected, galS− with the expected strong increases in transcription and translation at the mgl operon. By contrast, DD2557 is galS+ and showed no evidence of increases in transcription and translation at mgl, whereas transcription and translation at gat is greatly reduced. How can DD2557 persist in the face of a superior methylgalactoside specialist? Increases in transcription and translation of crp increase transcription and translation of a number of catabolite repressed genes. In particular, increased transcription and translation at aceBAK, which encodes enzymes of the gyloxylate bypass, suggests DD2557 may utilize the acetate fermented by DD2558 as a major source of carbon and energy (see Fischer and Sauer 2003 for an alternative possibility).
Three Long-Term Evolution Experiments
A detailed series of experiments dissecting adaptation by E. coli strain MC4100 to glucose-limited chemostats (i.e, Death and Ferenci 1994, reviewed by Ferenci 2008) reveal that beneficial increased rates of glucose transport are caused by mutations that increase activities at mgl (a high affinity glucose/galactose transporter), ptsG (the glucose-specific PTS permease), and increase expression of the nonspecific OmpC and OmpF porins and the glucose-/maltdextran-specific LamB porin of the outer cell wall.
In our experiments, adaptation to methylgalactoside also favors high transport rates at mgl. We also find increased expression at ptsG. Unlike Ferenci, we cannot account for this directly because our strains were not grown on limiting glucose. Instead, we suggest selection favors increased expression of the cotranscribed ptsH and ptsI components common to all PTS systems. These might increase transport of both galactose and fructose. Indeed, increased translation at ptsH and ptsI is seen only in strains displaying increased translation at gal and/or fru, whereas the converse is not necessarily true (table 7). Nor do Ferenci and coworkers (Ferenci 2008) report the increased expression we detect in the nonspecific hexose PTS transporter ManX. The extent to which these are involved with galactose and fructose cross-feeding is yet to be ascertained. It could very well be minor, with increased expression being primarily associated with recouping leached monosaccharides. Transcription at ompC is increased in three strains, reduced in seven more, and unchanged in four others. No changes in OmpC protein levels were detected. No changes in transcription were observed at ompF although one strain shows increased protein expression and three others reduced expression. Lastly, increases in transcription at mal are not matched by increases in translation—most strains show lower mal protein expression (table 7). This supports the contention that our strains are unlikely to be transporting glucose.
Strains, such as MC4100, that express high levels of the alternative sigma factor RpoS benefit greatly from its loss during very slow growth in chemostats (Ferenci 2003, 2005). All yedX-fliR deletions necessarily remove dsrA, a small antisense RNA that stimulates translation of rpoS (Soper and Woodson 2008). Loss of dsrA may therefore confer an advantage in addition to reduced motility gene expression. However, RpoS levels vary even among E. coli K12 strains (e.g., MG1655 has lower levels, Spira et al. 2008) and so it is not altogether surprising that we should find attenuated rpoS transcription in only three strains and no changes in the others.
Rosenzweig et al. (1994) discovered that adaptation by E. coli strain JA122 to a glucose-limited chemostat produced a community of three specialists, one fermenting the primary resource to acetate and glycerol, with each of these products consumed by one of two other specialists. The acetate specialist had increased acetyl-CoA synthetase activity (Acs) and the glycerol specialist had increased glycerol kinase activity (GlpK). Treves et al. (1998) showed that similar acetate specialists appeared in 6 of 12 subsequent long-term evolution experiments. Studies of adaptation by E. coli strain MC4100 to a glucose-limited chemostat provide no evidence of cross-feeding (reviewed by Ferenci 2008). We find weak evidence for it at best with the DD320 background. Of the 14 strains studied, only DD2266 shows increased transcription at acs—yet without evidence of increased translation. DD2557 overexpresses aceBAK (needed to assimilate acetate and possibly attributable to overexpression of Crp) instead of acs. However, this might instead reflect glucose catabolism via the novel phosphoenolpyruvate–glyoxylate cycle (Fischer and Sauer 2003). If true, the polymorphism is transient (pure scramble competition for a single limiting resource—glucose—is incapable of maintaining both strains). Our failure to find evidence of glycerol cross-feeding is likely attributable to an IS30 insertion in glpF, the glycerol channel (Zhong et al. 2004).
How Idiosyncratic Is Evolution?
Improved uptake of a limiting resource is a common adaptive response to starvation, one frequently achieved through increased protein expression of specific transporters (Horiuchi et al. 1962, 1963; Dean 1989; Sonti and Roth 1989; Ferea et al. 1999; Zhong et al. 2004; Ferenci 2008). Another, attaching to the side of the chemostat, establishes a subpopulation immune to washout (so-called wall growth). Loss of motility is possibly the most common adaptive phenotype during routine laboratory culture, repeatedly appearing in otherwise identical E. coli K12 strains (Macnab 1992).
Other changes are strain specific. Transcription at gat is routinely downregulated in TD2 and TD10 because it just happens to be constitutive in these strains. MC4100 usually reduces its high endogenous RpoS expression as it adapts to starvation. Similar changes were detected in only 3 of 14 cases with TD2 and TD10. During starvation on glucose, JA122 often evolves into a community, whereas MC4100 never does. Other changes are environment specific. Lac duplications are specific to limitation by certain galactosides but not methylgalactoside. Increased protein expression at fru is dependent on the presence of fructose. The benefits conferred by rpoS mutants are higher at low growth rates.
Perspective
Genomics and proteomics produce so much data that one can easily lose sight of the trees, let alone the forest and end up concentrating only on a large pile of leaves. In this section, we will try to provide a framework for these data, trying to look at the “forest” again, by assessing the results in terms of the major question that motivated this work. We want to understand the causes of natural selection; how environment and genetic variation produce natural selection. The main experimental model used is to grow E. coli in a chemostat and investigate genetic changes promoted by natural selection. Enough work has now been done that we can suggest certain generalizations.
There is selection for constitutive expression in regulated systems involved with the uptake and dissemination into metabolism of the limiting nutrient, up to the point that the substrates cannot escape from the cell. We have selected for constitutive mutations in all sugars tested (10), which includes maltose, rhamnose, and fructose, used as the limiting resource in chemostats (unpublished data). The general principle is that there will be selection for any genetic change that increases the gradient of the concentration of the limiting nutrient between the outside and inside of the cell.
Metabolic systems with constitutive mutations not used by cells in selective environments, such as gat in our strains, are eliminated. This principle of selection against the production of unneeded proteins is quite general (Stoebel et al. 2008). We predict that if our chemostats had been run for a longer time, gat would be eliminated in all cultures, just as rbs is eliminated in all long-term cultures of E. coli B (Cooper et al. 2001). The selection coefficient on a repressed operon is sufficiently small that deletions that remove the operon are effectively neutral (Stoebel et al 2008). However, the rbs operon was eliminated by deletion even though it was regulated (Cooper et al. 2001). The basal level of rbs proteins was evidently high because there was a significant decrease in expression in the strains where the operon was deleted (Cooper et al. 2003). Presumably, this was because of regulatory interactions with a constitutive duplication of most of the rbs operon unique to E. coli B (Lin 1996).
Metabolic systems induced in the environment used, but not required, are selectively eliminated or downregulated. Two obvious examples are the flagellar genes (flagella are useless in a homogeneous, rapidly mixed liquid environment as is the chemostat) and the RpoS system. Again, unneeded proteins are selected against. However, the RpoS system includes a large number of proteins, some of which might be advantageous and others detrimental, so the outcome of selection can vary from culture to culture. Points 2 and 3 are changes caused by the same mechanism, selection against unneeded proteins, but are different in that the constitutives in point 2 are strain specific and are present either because of chance or history, whereas the induction in point 3 will be a natural induction specific to the environment and found across most strains.
When there are multiple replaceable limiting resources, it is likely that some of the resources are at a concentration where only part of the population selects for upregulation of the uptake and initial metabolism, because of the trade-off between selection for uptake and the selection against overexpression. For example, in mixed lactose–maltose chemostats not all the cells are selected for lactose constitutivity when 10% of the sugar is lactose, but all are when 25% of the sugar is lactose (Dykhuizen and Davis 1980). The low concentration resources can be waste products from fermentation as ethanol or acetate or can be an intermediate compound that can diffuse out of the cell as fructose seemingly does in the experiment reported here.
These four generalizations involve only two causes of selection: Selection to increase the concentration gradient of the limiting nutrient across the cell membrane and selection against unnecessary protein synthesis. Except for RpoS−, these changes happen regularly and quickly in most cultures of an experiment. Thus, we can conclude that these two causes explain the initial adaptation of bacteria to a chemostat environment. Are there other causes for adaptation in these experiments? If not, then competition for resources is likely to be a minor part of evolution, becuase there are so many other genes performing so many other functions. However, numerous changes are found in only a minority of replicate chemostat experiments. These are often in genes that are not obviously related to the functions given above. We might expect that these represent other causes of natural selection. The reasoning for this statement is given in the next paragraph.
The initial temptation is to assume these uncommon changes are chance events where selectively neutral mutations hitchhike with advantageous mutations. This is unlikely, because the mutation rate of 10−10 per nucleotide per generation for E. coli is so much smaller than the inverse of the number of nucleotides in the E. coli genome (5 × 10⁶ nt). This means that only 1 in 2 × 10³ cells has a new mutation in each generation. After 500 generations, only one of four cells will have a nucleotide change. In a chemostat after 500 generations, if there is no selection, we expect only 25% of cells to differ by a single nucleotide from the ancestral cell. Thus, for most cells, there will be no neutral mutations present. However, because selection is present, all the cells will differ from the ancestoral cell by a number of changes. This implies almost all the phenotypic changes we see involve a genetic change that was selected. On the other hand, there are about 3 × 10⁹ cells in the chemostat so that nearly every nucleotide change appears multiple times in the first 10 generations. This could give rise to considerable clonal interference.
The selection coefficients for upregulation of uptake systems and against the production of unnecessary proteins will be large and these mutations will be fixed initially. After these are fixed, genetic changes with lower selection coefficients will be selected. There may be many of these with small, nearly equal, selection coefficients, giving considerable clonal interference. Which one is present in any cell will be a matter of chance and a diversity of these changes should be found in a population. For example, some of the cells will increase metabolic efficiency, others uptake efficiency (Ferenci 2008; MacLean 2008). Thus, we might expect a much richer array of causes at this second level of selection.
Supplementary Material
Supplementary material is available at Molecular Biology and Evolution online (http://www.mbe.oxfordjournals.org/).
Supplementary Material
Acknowledgments
We thank Arkady Khodursky for use of his microarray facilities and Kyeong Jeong for conducting the hierarchical clustering analysis. This work was supported by a Public Health Service Grant (GM06380) to A.M.D. and D.E.D.
References
- Agudelo-Romero P, Carbonell P, Perez-Amador MA, Elena SF. Virus adaptation by manipulation of host's gene expression. PLoS ONE. 2008;3:e2397. doi: 10.1371/journal.pone.0002397. [DOI] [PMC free article] [PubMed] [Google Scholar]
- Benjamini Y, Hochberg Y. Controlling the false discovery rate: a practical and powerful approach to multiple testing. J Roy Statist Soc B. 1995;57:289–300. [Google Scholar]
- Bennett AF, Lenski RE. Evolutionary adaptation to temperature. II. Thermal niches of experimental lines of Escherichia coli. Evolution. 1993;47:1–12. doi: 10.1111/j.1558-5646.1993.tb01194.x. [DOI] [PubMed] [Google Scholar]
- Bennett AF, Lenski RE. An experimental test of evolutionary trade-offs during temperature adaptation. Proc Natl Acad Sci USA. 2007;104:8649–8654. doi: 10.1073/pnas.0702117104. [DOI] [PMC free article] [PubMed] [Google Scholar]
- Bergthorsson U, Andersson DI, Roth JR. Ohno's dilemma: evolution of new genes under continuous selection. Proc Natl Acad Sci USA. 2007;104:17004–17009. doi: 10.1073/pnas.0707158104. [DOI] [PMC free article] [PubMed] [Google Scholar]
- Button DK. Kinetics of nutrient-limited transport and microbial growth. Microbiol Rev. 1985;49:270–297. doi: 10.1128/mr.49.3.270-297.1985. [DOI] [PMC free article] [PubMed] [Google Scholar]
- Cooper TF, Rozen DE, Lenski RE. Parallel changes in gene expression after 20,000 generations of evolution in E. coli. Proc Natl Acad Sci USA. 2003;100:1072–1077. doi: 10.1073/pnas.0334340100. [DOI] [PMC free article] [PubMed] [Google Scholar]
- Cooper VS, Lenski RE. The population genetics of ecological specialization in evolving E. coli populations. Nature. 2000;407:736–739. doi: 10.1038/35037572. [DOI] [PubMed] [Google Scholar]
- Cooper VS, Schneider D, Blot M, Lenski RE. Mechanisms causing rapid and parallel losses of ribose catabolism in evolving populations of Escherichia coli B. J Bacteriol. 2001;183:2834–2841. doi: 10.1128/JB.183.9.2834-2841.2001. [DOI] [PMC free article] [PubMed] [Google Scholar]
- Corbin RW, Paliy O, Yang F, et al. (11 co-authors) Toward a protein profile of Escherichia coli: comparison to its transcription profile. Proc Natl Acad Sci USA. 2003;100:9232–9237. doi: 10.1073/pnas.1533294100. [DOI] [PMC free article] [PubMed] [Google Scholar]
- Dean AM. Selection and neutrality in lactose operons of Escherichia coli. Genetics. 1989;123:441–454. doi: 10.1093/genetics/123.3.441. [DOI] [PMC free article] [PubMed] [Google Scholar]
- Dean AM. A molecular investigation of genotype by environment interactions. Genetics. 1995;139:19–33. doi: 10.1093/genetics/139.1.19. [DOI] [PMC free article] [PubMed] [Google Scholar]
- Death A, Ferenci T. Between feast and famine:endogenous inducer synthesis in the adaptation of Escherichia coli to growth with limiting carbohydrates. J Bacteriol. 1994;176:5101–5107. doi: 10.1128/jb.176.16.5101-5107.1994. [DOI] [PMC free article] [PubMed] [Google Scholar]
- Dykhuizen D, Davies M. An experimental model: bacterial specialists and generalists competing in chemostats. Ecology. 1980;61:1213–1227. [Google Scholar]
- Dykhuizen DE, Dean AM. Evolution of specialists in an experimental microcosm. Genetics. 2004;167:2015–2026. doi: 10.1534/genetics.103.025205. [DOI] [PMC free article] [PubMed] [Google Scholar]
- Eisen MB, Spellman PT, Brown PO, Botstein D. Cluster analysis and display of genome-wide expression patterns. Proc Natl Acad Sci USA. 1998;95:14863–14868. doi: 10.1073/pnas.95.25.14863. [DOI] [PMC free article] [PubMed] [Google Scholar]
- Elena SF, Lenski RE. Evolution experiments with microorganisms: the dynamics and genetic bases of adaptation. Nat Rev Genet. 2003;4:457–469. doi: 10.1038/nrg1088. [DOI] [PubMed] [Google Scholar]
- Ferea TL, Botstein D, Brown PO, Rosenzweig RF. Systematic changes in gene expression patterns following adaptive evolution in yeast. Proc Natl Acad Sci USA. 1999;96:9721–9726. doi: 10.1073/pnas.96.17.9721. [DOI] [PMC free article] [PubMed] [Google Scholar]
- Ferenci T. What is driving the acquisition of mutS and rpoS polymorphisms in Escherichia coli. Trends Microbiol. 2003;11:457–461. doi: 10.1016/j.tim.2003.08.003. [DOI] [PubMed] [Google Scholar]
- Ferenci T. Maintaining a healthy SPANC balance through regulatory and mutational adaptation. Mol. Microbiol. 2005;57:1–8. doi: 10.1111/j.1365-2958.2005.04649.x. [DOI] [PubMed] [Google Scholar]
- Ferenci T. Bacterial physiology, regulation and mutational adaptation in a chemostat environment. Adv Microb Physiol. 2008;53:169–229. doi: 10.1016/S0065-2911(07)53003-1. [DOI] [PubMed] [Google Scholar]
- Fischer E, Sauer U. A novel metabolic cycle catalyzes glucose oxidation and anaplerosis in hungry Escherichia coli. J Biol Chem. 2003;278:46446–46451. doi: 10.1074/jbc.M307968200. [DOI] [PubMed] [Google Scholar]
- Genissel A, McIntyre LM, Wayne ML, Nuzhdin SV. Cis and trans regulatory effects contribute to natural variation in transcriptome of Drosophila melanogaster. Mol Biol Evol. 2008;25:101–110. doi: 10.1093/molbev/msm247. [DOI] [PubMed] [Google Scholar]
- Gilad Y, Oshlack A, Smyth GK, Speed TP, White KP. Expression profiling in primates reveals a rapid evolution of human transcription factors. Nature. 2006;440:242–245. doi: 10.1038/nature04559. [DOI] [PubMed] [Google Scholar]
- Greenbaum D, Colangelo C, Williams K, Gerstein M. Comparing protein abundance and mRNA expression levels on a genomic scale. Genome Biol. 2003;4:117. doi: 10.1186/gb-2003-4-9-117. [DOI] [PMC free article] [PubMed] [Google Scholar]
- Griffin TJ, Gygi SP, Ideker T, Rist B, Eng J, Hood L, Aebersold R. Complementary profiling of gene expression at the transcriptome and proteome levels in Saccharomyces cerevisiae. Mol Cell Proteomics. 2002;4:323–333. doi: 10.1074/mcp.m200001-mcp200. [DOI] [PubMed] [Google Scholar]
- Hammar M, Arnqvist A, Bian Z, Olsén A, Normark S. Expression of two csg operons is required for production of fibronectin- and congo red-binding curli polymers in Escherichia coli K-12. Mol Microbiol. 1995;18:661–670. doi: 10.1111/j.1365-2958.1995.mmi_18040661.x.. [DOI] [PubMed] [Google Scholar]
- Horiuchi T, Horiuchi S, Novick A. The genetic basis of hyper-synthesis of β-galactosidase. Genetics. 1963;48:157–169. doi: 10.1093/genetics/48.2.157. [DOI] [PMC free article] [PubMed] [Google Scholar]
- Horiuchi T, Tomizawa J, Novick A. Isolation and properties of bacteria capable of high rates of β-galactosidase synthesis. Biochem Biophys Acta. 1962;55:152. doi: 10.1016/0006-3002(62)90941-1. [DOI] [PubMed] [Google Scholar]
- Khodursky AB, Bernstein JA, Peter BJ, Rhodius V, Wendisch VF, Zimmer DP. Escherichia coli spotted double-strand DNA microarrays: RNA extraction, labeling, hybridization, quality control, and data management. Methods Mol Biol. 2003;224:61–78. doi: 10.1385/1-59259-364-X:61. [DOI] [PubMed] [Google Scholar]
- Khodursky AB, Peter BJ, Cozzarelli NR, Botstein D, Brown PO, Yanofsky C. DNA microarray analysis of gene expression in response to physiological and genetic changes that affect tryptophan metabolism in Escherichia coli. Proc Natl Acad Sci USA. 2000;97:12170–12175. doi: 10.1073/pnas.220414297. [DOI] [PMC free article] [PubMed] [Google Scholar]
- Le Gac M, Brazas MD, Bertrand M, Tyerman JG, Spencer CC, Hancock REW, Doebeli M. Metabolic changes associated with adaptive diversification in Escherichia coli. Genetics. 2008;178:1049–1060. doi: 10.1534/genetics.107.082040. [DOI] [PMC free article] [PubMed] [Google Scholar]
- Lieb M. Spontaneous mutation at a 5-methylcytosine hotspot is prevented by very short patch (VSP) mismatch repair. Genetics. 1991;128:23–27. doi: 10.1093/genetics/128.1.23. [DOI] [PMC free article] [PubMed] [Google Scholar]
- Lieb M, Bhagwat AS. Very short patch repair: reducing the cost of cytosine methylation. Mol. Microbiol. 1996;20:467–473. doi: 10.1046/j.1365-2958.1996.5291066.x. [DOI] [PubMed] [Google Scholar]
- Lin ECC. Dissimilatory pathways for sugars, polyols, and carboxylates. In: Neidhardt FC, Curtiss R III, Ingram JL, Lin ECC, Low KB, Magasanik B, Reznifoff WS, Riley M, Schaechter M, Umbarger HE, editors. Escherichia coli and Salmonella: cellular and molecular biology. 2nd ed. Washington (DC): ASM Press; 1996. pp. 307–342. [Google Scholar]
- Lunzer M, Natarajan A, Dykhuizen DE, Dean AM. Enzyme kinetics, substitutable resources and competition: from biochemistry to frequency-dependent selection in lac. Genetics. 2002;162:485–499. doi: 10.1093/genetics/162.1.485. [DOI] [PMC free article] [PubMed] [Google Scholar]
- MacLean RC. The tragedy of the commons in microbial populations: insights from theoretical, comparative and experimental studies. Heredity. 2008;100:471–477. [PubMed] [Google Scholar]
- MacLean RC, Bell G. Divergent evolution during an experimental adaptive radiation. Proc Biol Sci. 2003;270:1645–1650. doi: 10.1098/rspb.2003.2408. [DOI] [PMC free article] [PubMed] [Google Scholar]
- Macnab RM. Genetics and biogenesis of bacterial flagella. Annu Rev Genet. 1992;26:131–158. doi: 10.1146/annurev.ge.26.120192.001023. [DOI] [PubMed] [Google Scholar]
- Majdalani N, Vanderpool CK, Gottesman S. Bacterial small RNA regulators. Crit Rev Biochem Mol Biol. 2005;40:93–113. doi: 10.1080/10409230590918702. [DOI] [PubMed] [Google Scholar]
- Miller J. Experiments in molecular genetics. Cold Spring Harbor (NY): Cold Spring Harbor Laboratory Press; 1972. [Google Scholar]
- Nelsestuen GL, Zhang Y, Martinez MB, Key NS, Jilma B, Verneris M, Sinaiko A, Kasthuri RS. Plasma protein profiling: unique and stable features of individuals. Proteomics. 2005;5:4012–4024. doi: 10.1002/pmic.200401234. [DOI] [PubMed] [Google Scholar]
- Notley-McRobb L, Ferenci T. The generation of multiple co-existing mal-regulatory mutations through polygenic evolution in glucose-limited populations of Escherichia coli. Env Microbiol. 1999;1:45–52. doi: 10.1046/j.1462-2920.1999.00003.x. [DOI] [PubMed] [Google Scholar]
- Novick A, Horiuchi T. Hyper-production of β-galactosidase by Escherichia coli bacteria. Cold Spring Harbor Symp Quant Biol. 1961;26:239–245. doi: 10.1101/sqb.1961.026.01.029. [DOI] [PubMed] [Google Scholar]
- Rainey PB, Travisano M. Adaptive radiation in a heterogeneous environment. Nature. 1998;394:69–72. doi: 10.1038/27900. [DOI] [PubMed] [Google Scholar]
- Riehle MM, Bennett AF, Long AD. Changes in gene expression following high temperature adaptation in experimentally evolved populations of E. coli. Physiological and Biochemical Zoology. 2005;78:299–315. doi: 10.1086/430035. [DOI] [PubMed] [Google Scholar]
- Riley M, Abe T, Arnaud MB, et al. (18 co-authors) Escherichia coli K-12: a cooperatively developed annotation snapshot –2005. Nucleic Acids Res. 2006;34:1–9. doi: 10.1093/nar/gkj405. [DOI] [PMC free article] [PubMed] [Google Scholar]
- Rosenzweig RF, Sharp RR, Treves DS, Adams J. Microbial evolution in a simple unstructured environment: genetic differentiation in Escherichia coli. Genetics. 1994;137:903–917. doi: 10.1093/genetics/137.4.903. [DOI] [PMC free article] [PubMed] [Google Scholar]
- Ross PL, Huang YN, Marchese JN, et al. (16 co-authors) Multiplexed protein quantitation in Saccharomyces cerevisiae using amine-reactive isobaric tagging reagents. Mol Cell Proteomics. 2004;3:1154–1169. doi: 10.1074/mcp.M400129-MCP200. [DOI] [PubMed] [Google Scholar]
- Sittka A, Lucchini S, Papenfort K, Sharma CM, Rolle K, Binnewies TT, Hinton JCD, Vogel J. Deep sequencing analysis of small noncoding RNA and mRNA targets of the global post-transcriptional regulator, Hfq. PLOS Genet. 2008;4:1–20. doi: 10.1371/journal.pgen.1000163. [DOI] [PMC free article] [PubMed] [Google Scholar]
- Sonti RV, Roth JR. Role of gene duplications in the adaptation of Salmonella typhimurium to growth on limiting carbon sources. Genetics. 1989;123:19–28. doi: 10.1093/genetics/123.1.19. [DOI] [PMC free article] [PubMed] [Google Scholar]
- Soper TJ, Woodson SA. The rpoS mRNA leader recruits Hfq to facilitate annealing with DsrA sRNA. RNA. 2008;14:1907–1917. doi: 10.1261/rna.1110608. [DOI] [PMC free article] [PubMed] [Google Scholar]
- Spira B, Hu X, Ferenci T. Strain variation in ppGpp concentration and RpoS levels in laboratory strains of Escherichia coli K-12. Microbiology. 2008;154:2887–2895. doi: 10.1099/mic.0.2008/018457-0. [DOI] [PubMed] [Google Scholar]
- Stoebel DM, Dean AM, Dykhuizen DE. The cost of expression of Escherichia coli lac operon proteins is in the process, not in the products. Genetics. 2008;178:1653–1660. doi: 10.1534/genetics.107.085399. [DOI] [PMC free article] [PubMed] [Google Scholar]
- St-Cyr J, Derome N, Bernatchez L. The transcriptomics of life-history trade-offs in whitefish species pairs (Coregonus sp.) Mol Ecol. 2008;17:1850–1870. doi: 10.1111/j.1365-294X.2008.03696.x. [DOI] [PubMed] [Google Scholar]
- Treves DS, Manning S, Adams J. Repeated evolution of an acetate-crossfeeding polymorphism in long-term populations of Escherichia coli. Mol Biol Evol. 1998;15:789–797. doi: 10.1093/oxfordjournals.molbev.a025984. [DOI] [PubMed] [Google Scholar]
- Vianney A, Jubelin G, Renault S, Dorel C, Lejeune P, Lazzaroni JC. Escherichia coli tol and rcs genes participate in the complex network affecting curli synthesis. Microbiology. 2005;151:2487–2497. doi: 10.1099/mic.0.27913-0. [DOI] [PubMed] [Google Scholar]
- Vijayendran C, Barsch A, Friehs K, Niehaus K, Becker A, Flaschel E. Perceiving molecular evolution processes in Escherichia coli by comprehensive metabolite and gene expression profiling. Genome Biol. 2008;9:R72. doi: 10.1186/gb-2008-9-4-r72. [DOI] [PMC free article] [PubMed] [Google Scholar]
- Zieske LR. A perspective on the use of iTRAQ reagent technology for protein complex and profiling studies. J Exp Bot. 2006;57:1501–1508. doi: 10.1093/jxb/erj168. [DOI] [PubMed] [Google Scholar]
- Zhong S, Khodursky A, Dykhuizen DE, Dean AM. Evolutionary genomics of ecological specialization. Proc Natl Acad Sci USA. 2004;101:11719–11724. doi: 10.1073/pnas.0404397101. [DOI] [PMC free article] [PubMed] [Google Scholar]
Associated Data
This section collects any data citations, data availability statements, or supplementary materials included in this article.