

Abstract
Background and purpose:
Fibrosis, a pathological accumulation of collagen in tissues, represents a major global disease burden. Effective characterization of potential antifibrotic drugs has been constrained by poor formation of the extracellular matrix in vitro, due to tardy procollagen processing by collagen C-proteinase/BMP-1, and difficulties in relating this matrix to cell numbers in experimental samples.
Experimental approach:
The Scar-in-a-Jar model provided, in vitro, the complete biosynthetic cascade of collagen matrix formation including complete conversion of procollagen by C-proteinase/BMP-1, its subsequent extracellular deposition and lysyl oxidase-mediated cross-linking, achieved by applying the biophysical principle of macromolecular ‘crowding’. Collagen matrix deposition, velocity and morphology can be controlled using negatively charged ‘crowders’ in a rapid (2 days) mode or a mixture of neutral ‘crowders’ in an accelerated (6 days) mode. Combined with quantitative optical bioimaging, this novel system allows for in situ assessment of the area of deposited collagen(s) per cell.
Key results:
Optical evaluation of known and novel antifibrotic compounds effective at the epigenetic, post-transcriptional/translational/secretional level correlated excellently with corresponding biochemical analyses. Focusing on quantitation of deposited collagen, the Scar-in-a-Jar was most effective in assessing novel inhibitors that may have multiple targets, such as microRNA29c, found to be a promising antifibrotic agent.
Conclusions and implications:
This novel screening system supersedes current in vitro fibroplasia models, as a fast, quantitative and non-destructive technique. This method distinguishes a reduction in collagen I deposition, excluding collagen cross-linking, and allows full evaluation of inhibitors of C-proteinase/BMP-1 and other matrix metalloproteinases.
Keywords: fibrosis, drug discovery, collagen quantitation, bioimaging, macromolecular crowding, high content screening
Introduction
Scarring is a physiological tissue response to wounding that has been highly conserved in evolution and across species. As the last phase of wound-healing, it is usually self-contained. However, if this phase is perpetuated by repeated tissue insults and/or ongoing inflammation, fibrosis ensues. Fibrosis is histopathologically characterized by an excessive production and deposition of collagen that converts normal tissue into scar tissue with associated loss of function. Therefore, causes as diverse as chronic infections, radio- and chemotherapy, chronic exposure to alcohol and other toxins can all lead to fibrosis with a considerable global disease burden. It is estimated that there are five million cases of lung fibrosis worldwide (Meltzer and Noble, 2008). A major cause for liver fibrosis is chronic hepatitis virus B (HBV) and C (HCV) infection. One million people die every year from complications of chronic HBV, mainly primary hepatocellular carcinoma and liver fibrosis. Of those exposed to HCV, 12% (about 24 million) develop liver cirrhosis, placing it 18th in terms of global disease burdens (WHO, 2004). Besides afflicting whole organs, localized fibrosis can severely impair the quality of life in millions of patients, for example through implant failure caused by peri-implantational fibrosis (Gristina, 1994; Tang and Eaton, 1995).
The development of effective antifibrotic compounds is therefore an important unmet clinical need. Rapid in vitro screening of lead compounds before they are tested in animal models will hasten the development process. However, this has been severely hampered by biological and technical problems. First, fibrogenic cells in monolayer culture do not lay down significant amounts of collagen in a useful time window for screening. It is still not widely known that this is due to a tardy enzymatic conversion of procollagen to collagen in vitro even under conditions of full procollagen synthesis (Lareu et al., 2007a). On the basis of this previously unsolved biological problem, analytical methods have mostly settled for the measurement of procollagen secreted into culture medium, but these conditions barely mimic a fibrotic situation. In order to address this, prolonged cultures (4–6 weeks) or hyperconfluent cell culture fibroplasia models (FP) (Clark et al., 1997) incorporating transforming growth factor-β1 (TGFβ1) to stimulate fibroblast proliferation and collagen production have been developed. The FP model is currently the testing standard in industry (Fish et al., 2007). Second, quantitation of cell numbers, required for data normalization, currently requires the destruction of cell layers in order to normalize against protein or DNA (Campa et al., 1990; Tredget et al., 1990). Minimally deposited collagen in the extracellular matrix (ECM) must be solubilized prior to analysis (Ramshaw and Werkmeister, 1988; Anderson and Elliott, 1991), and this also applies to the FP model (Fish et al., 2007). Third, collagen quantitation based on the popular Picro-Sirius red dye assay (Xu et al., 2007) is non-specific. It has low sensitivity in conditions of minimal collagen deposition and is reliable only after a pre-purification step (R.R. Lareu, D.I. Zeugolis and M. Raghunath, unpubl. experiments). The tedious determination of hydroxyproline content is far more collagen-specific but of limited sensitivity. Other methods that rely on laser scanning confocal microscopy (Antonini et al., 1999) are slow during image acquisition and not suitable for handling multi-well plates.
Lastly, antifibrotic compounds should preferably target collagen, along with additional features characteristic for fibrosis such as α-smooth muscle actin expression in myofibroblasts and epithelial-mesenchymal transition. Therefore, it would be desirable to quantitate simultaneously non-collagenous proteins and cell proliferation. For the first time, optical analysis and quantitation of enhanced collagen deposition has been utilized as a non-destructive, rapid and protein specific tool in a single-well format for the screening of antifibrotic compounds.
Methods
Fibroblast cell culture
Normal primary human lung fibroblasts (WI-38 cells) were selected on the basis of their strong collagen I production in our hands. The cells were routinely cultured at low passage (3–8) as outlined earlier (Lareu et al., 2007a). Fibroblasts were seeded on 24-well plates at 50 000 cells per well in 10% fetal bovine serum (FBS), 5% CO2 at 37°C. After 16 h, cells were cultured under ‘crowded’ conditions, that is, with added macromolecules such as negatively charged 500 kDa dextran sulphate (DxS) or a mixture of neutral 70 and 400 kDa Ficoll™ (Fc). To achieve this, the medium was changed to Dulbecco's modified Eagle's medium (DMEM) containing 0.5% FBS, 100 µM of L-ascorbic acid 2-phosphate (as the magnesium salt hexahydrate, a more stable form of ascorbate; Hata and Senoo 1989) with or without 500 kDa DxS (rapid mode) at 100 µg·mL−1 or a mixture of 37.5 mg·mL−1 Fc 70 with 25 mg·mL−1 Fc 400 (accelerated mode), 5 ng·mL−1 TGFβ1, and in combination with or without antifibrotic substances. Only 2,4-pyridinedicarboxylic acid monohydrate (PDCA) and β-aminopropionitrile (BAPN) were added daily to Fc ‘crowded’ cell cultures (accelerated mode). Other substances were added only once.
Trichostatin A (TSA, 1 µM), 300 mM PDCA dissolved in double-distilled H2O with 655 mM sodium bicarbonate (Sigma-Aldrich, St. Louis, MO, USA) to neutralize the pH, was prepared and diluted to a working concentration of 10 mM PDCA in medium. Ciclopiroxolamine (CPX, 0.5 M) stock was prepared in methanol and diluted to a working concentration of 1 mM CPX in DMEM prior to cell culture addition with a final concentration of 8 µM. IC50 values and references for respective inhibitors are given in Supporting Information (Table S1). A 100 mM stock of C-proteinase inhibitor, PCP56, in DMSO was added to cell culture media to get a final concentration of 10 µM PCP56. A stock of 10 mM BAPN was freshly prepared in double-distilled water and was added to cell culture media to get a final concentration of 0.1 mM BAPN. ECM was deposited under ‘crowded’ conditions (DxS 2 days and Fc 6 days) prior to addition of 300 µL of recombinant catalytically active human matrix metalloproteinase 1 (MMP1; 0.17 mg·mL−1 or 50 µg per well; 24-well plate) (50 mM HEPES, 10 mM CaCl2, pH 7.5 buffer). Digestion was carried out for 16 h at 37°C.
Fibroplasia (FP) models
FP model 1 (Clark et al., 1997): WI-38 fibroblasts were seeded at a density of 100 000 cells per well in a 24-well plate and incubated for 3 days in DMEM containing 0.4% FBS, 5% CO2 at 37°C. The cells were then treated with DMEM containing 10% FBS, 100 µM L-ascorbic acid 2-phosphate (as the magnesium salt hexahydrate) in the presence or absence of 300 pM TGFβ1 for 14 days, with a media change every 4 days.
FP model 2 (Fish et al., 2007): WI-38 fibroblasts were seeded at confluency in 24-well plates (100 000 cells per well) and cultured in DMEM containing 10% FBS, 100 µM of L-ascorbic acid 2-phosphate (as the magnesium salt hexahydrate) and 3 ng·mL−1 TGFβ1, at 5% CO2 at 37°C. Medium was changed twice a week, and samples were taken for analysis after 8 days.
Optical analysis
A bioimaging station comprising of a Nikon TE600 fluorescence microscope plus Xenon illuminator (LB-LS/30, Sutter Instrument Company, Novato, CA, USA), with an automated Ludl stage (BioPrecision 2, Ludl Electronic Products Ltd., Hawthorne, NY, USA) and shutter, and equipped with a Photometrics CoolSNAP high-sensitivity cooled monochrome charge-coupled device camera (model HQ, Roper Scientific, Pleasanton, CA, USA) was used. Screening of 24-well multi-well plates was made possible by an automated stage and autofocus capabilities. Nine image sites per well were acquired at 20× original magnification, stored and analysed using the Metamorph® Imaging System software (Molecular Devices, Sunnyvale, CA, USA). An image field of 4.48 × 3.34 mm per site was defined for each 24-well plate to obtain an image spread of 13.43 × 10.03 mm (134.70 mm2) per well. The Count Nuclei module was used for cell enumeration with specific parameters in order for a region to be considered as a positive count (countable nucleus): (i) areas with pixel intensity value 15 above that of the background; and (ii) fluorescent areas with a minimum length of 10 µm and a maximum length of 15 µm. The Integrated Morphometry Analysis module was used to quantify the area of fluorescent collagen I staining, which had been deposited on the cell layer. Experimental controls were used to determine suitable fluorescent intensity thresholds (300 for the DxS mode and a range between 500 and 550 for the Fc mode); fluorescent signals below a defined pixel intensity value were discounted, which eliminated measurement of the background area. Triangle masks were added to eliminate quantitation of corner auto-fluorescence. This analysis resulted in a data set expressed as area of collagen I per nuclei in µm2 per image field.
Immunocytochemistry
Cell layers were fixed with methanol and blocked with 3% bovine serum albumin in phosphate-buffered saline (PBS). Primary antibodies were incubated for 1.5 h followed by washing three times with PBS. Secondary antibodies and 4′,6-diamidino-2-phenylindoldilactate (DAPI) were incubated for 30 min and washed three times with PBS. Antibodies used were mouse anti-human collagen I monoclonal primary antibody and rabbit anti-fibronectin, along with AlexaFluor 594 goat anti-mouse and AlexaFluor 488 chicken anti-rabbit secondary antibodies. Cell nuclei were stained with DAPI.
Biochemical analyses
Sodium dodecylsulphate-polyacrylamide gel electrophoresis (SDS-PAGE)
Triplicate protein samples were pooled and resolved under non-reducing conditions using in-house 5% resolving/3% stacking polyacrylamide gels on a Mini-Protean 3 as outlined in Raghunath et al. (1994). Protein standards used were the Precision Plus Dual Colour and Prestained Broad Range, and collagen type I standards. Protein bands were stained with the SilverQuest™ kit according to the manufacturer's protocol. Densitometric analysis of wet gels was performed on both collagen α1(I)- and α2(I)-bands with a GS-800™ Calibrated Densitometer and Quantity One v4.5.2 image analysis software.
Western blotting
Proteins were extracted from the cell layer, subjected to non-reducing SDS-PAGE using in-house 4% resolving/3% stacking polyacrylamide gels on a Mini-Protean 3. Proteins were electroblotted onto nitrocellulose membrane and immuno-detection was carried out in Tris-buffered saline Tween-20 pH 7.6 (50 mM Tris-base 150 mM NaCl/0.05% Tween 20) with 5% non-fat milk. Mouse anti-human procollagen type I C-propeptide was used at 5 µg·mL−1 and incubated for 1.5 h. Subsequently, a secondary goat anti-mouse conjugated to HRP (Thermo Scientific, Rockford, IL) was used at 1/1000 dilution for 1 h. The signal was detected by chemiluminescence and captured with a VersaDoc Imaging System model 5000.
microRNA (miRNA) transfection
Prior to addition of DxS, 20 nM of mimic RNA of miR29c (M29c) and inhibitor of miR29c (I29c) were transfected into fibroblasts using lipofectamine RNAiMax (Invitrogen, Grand Island, NY, USA) diluted with Opti-MEM® I reduced serum medium according to the manufacturer's forward transfection protocol. Mock transfection samples were only treated with lipofectamine and Opti-MEM® I without any RNA.
Statistical analysis
Data are presented as means ± SD and as fold changes of relevant controls. The statistical significance between groups was determined by Student's t-test using a two-tailed distribution with unequal variance. An effect was considered significant when 1.0 did not occur in the 95% confidence interval of the collagen I amount in comparison with controls (P < 0.05).
Materials
WI-38 fibroblasts were obtained from American Tissue Culture Collection (CCL-75, Manassas, VA, USA). Cell culture media and serum were obtained from Invitrogen (Grand Island, NY, USA). All cell culture plastic ware (CELLSTAR®) was purchased from Greiner BioOne (Frickenhausen, Germany). L-ascorbic acid 2-phosphate, as the magnesium salt hexahydrate, was obtained from Wako (Osaka, Japan). All macromolecules were purchased from GE Healthcare (Buckinghamshire, UK), and TGFβ1 from R&D Systems (Minneapolis, MN, USA). TSA, PDCA CPX, BAPN and sodium bicarbonate were from Sigma-Aldrich (St. Louis, MO); PCP56 [UK-421,045: (3R)-6-cyclohexyl-N-hydroxy-3-(3-{[(methylsulphonyl)amino]methyl}-1,2,4-oxadiazol-5-yl)hexanamide)] was from Pfizer Global Research and Development (Sandwich, Kent, UK), and recombinant MMP1 corresponding to residues 101–469 in the full-length enzyme was produced and purified by Aldevron, LLC (Fargo, ND, USA) as previously described (Kaar et al., 2008). The collagen I and fibronectin antibody were from Sigma-Aldrich (St. Louis, MO, USA) and Dako (Glostrup, Denmark) respectively. All secondary antibodies for immunocytochemistry and DAPI were purchased from Molecular Probes (Eugene, OR, USA). SDS-PAGE reagents and equipment were obtained from Bio-Rad Laboratories (Hercules, CA, USA); collagen type I standards were from Koken Co. (Tokyo, Japan). The SilverQuest™ kit was from Invitrogen (Grand Island, NY, USA). The procollagen type I C-propeptide antibody used in immunoblotting was from QED biosciences (San Diego, CA, USA). Secondary antibodies and chemiluminescence substrate were from Pierce Biotechnology (Rockford, IL, USA). Reagents used for miRNA transfection were from Invitrogen (Grand Island, NY, USA), and both precursor and inhibitor miRNAs were purchased from Ambion (Foster City, CA, USA).
Results
Choosing the appropriate human cell lines and their properties
We initially assessed two well-characterized normal human embryonic cell lines, IMR-90 and WI-38, because they grow reliably for a number of passages and deposit substantial amounts of collagen (1–2 µg per 1.9 cm2, data not shown). WI-38 was selected because it showed a slower proliferation rate that was preferable for adherent cytometry for the accelerated mode (see below, and Figure S1 online). WI-38 fibroblasts remained subconfluent under the specified culture conditions throughout the length of our study.
Implementation of two collagen deposition protocols
‘Crowding’ of culture medium with dextran sulphate served as the rapid deposition mode (DxS), as it yields maximal granular deposition of collagen I by 48 h, exceeding that in conventional cell cultures within the same time, by more than 20-fold (Lareu et al., 2007b). This increase was confirmed optically, with good correlation with quantitative SDS-PAGE gels of peptic cell layer extracts (Figures 1A and 2D). The enhanced conversion of procollagen to collagen by procollagen C-proteinase/BMP-1 was confirmed by immunoblotting (Figure 1B). TGFβ1 further increased collagen I deposition by another 1.5–2-fold on top of the deposition gain observed in cultures treated with DxS alone (Figure 1D,E). Crowding of culture medium with neutral mixed Ficoll served as the accelerated mode (Fc), and 6 days culture resulted in the doubling of collagen deposition in comparison with non-crowded cultures (see Figure S1 and S2 online) and an additional twofold increase in the presence of TGFβ1 in comparison with non-TGFβ1 crowded cultures (Figure 1D,E). Moreover, this mode resulted in a fibrillar collagen meshwork with a more even spread of immunosignal (Figure 1C vii and viii, xiii and xiv). Rapid mode (without TGFβ1; 2 days) and accelerated mode (with TGFβ1; 6 days) outperformed both FP models (+TGFβ1) (18 and 8 days) with 1.5–3.5 times higher collagen deposition (Figure 1D,E).
Figure 1.
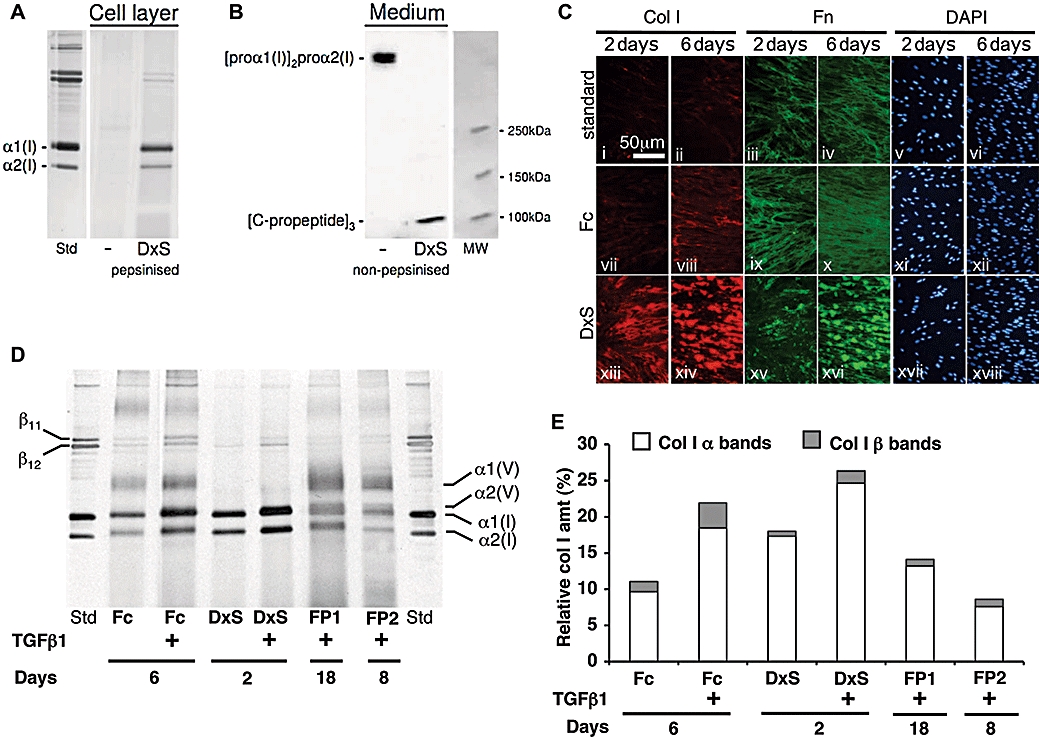
Rapid and accelerated collagen deposition modes versus in vitro fibroplasia. (A) Silver stained SDS PAGE: markedly increased collagen deposition in the presence of DxS (B) procollagen C-propeptide immunoblot shows intact secreted procollagen in routine culture, and complete cleavage of procollagen C-propetide in the presence of DxS (C) Immunocytochemistry: standard culture with reticular fibronectin matrix and minimal collagen I deposition (i–vi), Fc (accelerated): enhanced reticular collagen I/fibronectin matrix (vii–xii). DxS (rapid): granular aggregates of collagen I/fibronectin (xiii–xviii) with highest ECM content (×400 magnification). (D) SDS-PAGE analyses of collagen matrix content in both deposition modes in the absence/presence of TGFβ1 and fibroplasia models. With TGFβ1 both deposition modes give more and faster matrix formation including stronger lysyl oxidasemediated cross-linking than both FPs. Note presence of collagen V in FP and accelerated mode and its absence in rapid mode. (E) Densitometric evaluation of (D).
Figure 2.

Image acquisition and quantitation of rapid collagen deposition mode. (A) (i) 20× original magnification of cells in a 1.9 cm2 well with superimposed original rectangular image acquisition area (red box). (ii) Enlarged red box: corner auto-fluorescence (arrows). (iii and iv) Acquisition area after application of triangular masks to eliminate corner auto-fluorescence. (B) Cytometry and quantitation of the area of deposited collagen I. (i) DAPI-stained nuclei at 20× original magnification in monochrome pseudocolor, scale bar, 1 mm. 600× original magnification (inset). (ii) Red scored nuclei by Count Nuclei module for cytometry. (iii) Immunostained deposited collagen I. (iv) Regions with fluorescent pixel intensity above a selected value based on controls are demarcated by the software in green for quantitation of deposited collagen I area at 100× original magnification. (C) Shading correction for non-homogenous fluorescence during image acquisition for unbiased quantitation at 20× original magnification. (i) Non-homogenous fluorescence background. (ii) Fibronectin immunofluorescence acquired with uneven fluorescence. (iii) Same image after background fluorescence removal. (D) Densitometry versus image analysis for collagen I (Col I) quantitation. Optically, fluorescence intensity (FIT) and area were similar, correlating well with densitometry. TGFβ1-induced increase of collagen I deposition was detected in similar amount and tendency optically and biochemically. Data are expressed as mean ± SD, calculated from triplicates and as a relative percentage of all treatments. Ctrl, control; DAPI, 4′,6-diamidino-2-phenylindoldilactate; DxS, dextran sulphate (rapid deposition mode); TGFβ1, transforming growth factor-β1.
Image processing and capture
Methanol fixation was chosen for immunostaining (see Figure S3 online). Nine image fields would quantify 70% of the total well area (190 mm2) in a 24-well plate (Figure 2A i). Because the curvature of the wells created artificial reflection and increased auto-fluorescence in the four corner fields (Figure 2A ii), macros were written that added triangular masks to conceal these regions during quantitation (Figure 2A iii and iv). Taking into account cell distribution irregularities close to the well edges that have to be excluded from analysis, the final quantitation area represents 83% of the relevant area (105 mm2– 54% of the total well area) (Figure 2A iv). A long-range 2× objective (20× total original magnification) renders the bioimaging station independent of the use of expensive optical plates. A 24-well format was selected as the 96-well format resulted in higher well-to-well variances of cell distribution (not shown). Quantitation of nuclei and the area of collagen I was demonstrated in Figure 2B with background correction in Figure 2C. Optical analysis to quantify both area and fluorescence intensity of collagen I per cell was compared with densitometric measurements of silver-stained SDS-PAGE collagen I bands (Figure 2D). As the results from these two assays were closely correlated, the area was selected as the measure of collagen I deposition. A variation of 10% in cell numbers was attributed to cell seeding errors, and the image acquisition and enumeration errors were considered negligible (<0.3%) (data not shown).
Testing known and novel antifibrotics, in comparison with SDS-PAGE
Known and novel agents with anti-fibrotic potential were employed to interfere with various key steps along the collagen biosynthesis pathway. Reduction of collagen I deposition relative to untreated controls in both deposition modes was used as a read-out for antifibrotic efficacy. Optical analyses for all antifibrotic substances were validated by biochemical analyses illustrated in Figures 3, 4, S4 and S5, and a very good correlation was determined between optical and densitometric quantitation (data not shown).
Figure 3.
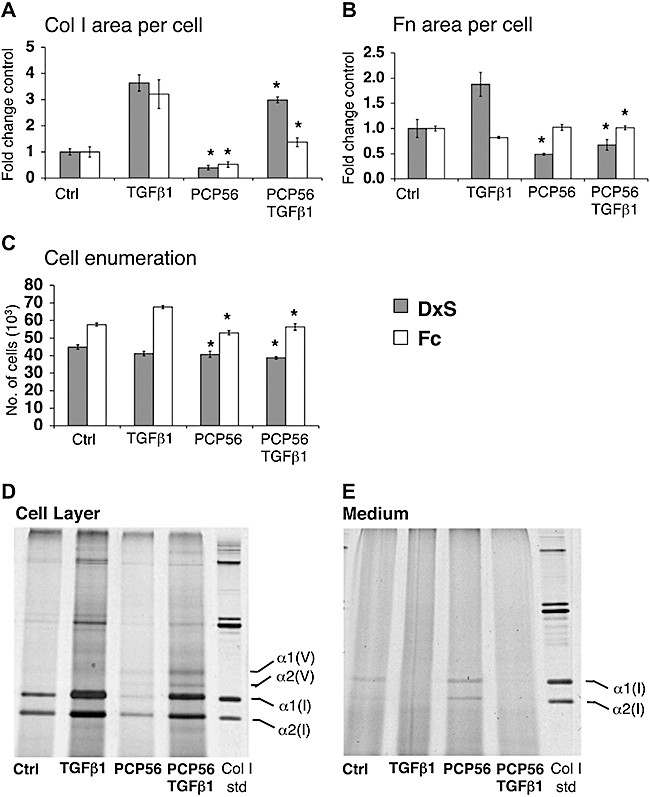
Optical evaluation of extracellular interference with collagen deposition. (A) C-proteinase inhibitor PCP56 reduced collagen I (Col I) area per cell to 40% (control, P= 0.003) and 82% (TGFβ1, P= 0.047) in rapid mode, and 52% (control, P= 0.036) and 43% (TGFβ1, P= 0.018) in accelerated mode. There were no significant effects with FSY002 (data not shown). (B) Area of fibronectin (Fn) per cell was reduced to 46% (control, P= 0.037) and 36% (TGFβ1, P= 0.005) by PCP56 in rapid mode, and increased to 123% (TGFβ1, P= 0.004) in accelerated mode. (C) Cell numbers with PCP56 were slightly reduced to 91% (control, P= 0.012) and 94% (TGFβ1, P= 0.006) in rapid mode, and 92% (control, P= 0.035) and 83% (TGFβ1, P= 0.002) in accelerated mode. *P < 0.05 versus respective controls (D,E) Biochemical analysis of deposited collagen I reduction by PCP56 in the rapid mode of collagen deposition. (D) Collagen I deposited on the cell layer is visibly reduced with PCP56 treatment. (E) Pepsin digested procollagen I is increased in the medium fraction of cell culture with PCP56 treatment. Data are expressed as mean ± SD, calculated from triplicates and as fold changes over respective controls. Ctrl, control; DxS, dextran sulphate (rapid deposition mode); Fc, Ficoll cocktail (accelerated deposition mode); TGFβ1, transforming growth factor-β1.
Figure 4.
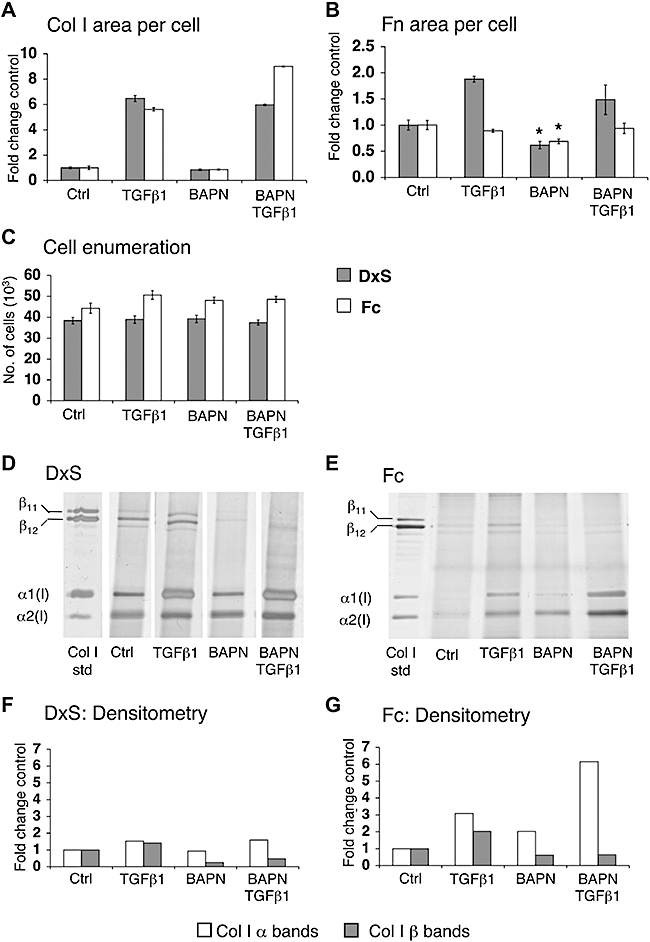
Optical evaluation of extracellular interference with collagen stabilization. (A) BAPN did not change area of collagen I (Col I) per cell, but reduced area of fibronectin (Fn) per cell to 62% (DxS, P= 0.006) and 69% (Fc, P= 0.012) in the absence of TGFβ1 (B) without affecting cell numbers (C). Effects of BAPN were evident after SDS-PAGE (D,E); densitometry qualitatively shows that β-cross-links were reduced to 24% and 33% (TGFβ1), and to 62% and 32% (TGFβ1) in the rapid (F) and accelerated mode (G) respectively. Each lane represents pooled triplicates, and data are represented as fold change in comparison with respective control. *P < 0.05 versus respective controls. Data are expressed as mean ± SD, calculated from triplicates and as fold changes over respective controls. BAPN, β-aminopropionitrile; Ctrl, control; DxS, dextran sulphate (rapid deposition mode); Fc, Ficoll cocktail (accelerated deposition mode); SDS-PAGE, SDS-polyacrylamide gel electrophoresis; TGFβ1, transforming growth factor-β1.
Epigenetic interference with collagen deposition
TSA, a histone deacetylase inhibitor, was previously suggested as a potential antifibrotic compound (Huber et al., 2007). In the absence of TGFβ1, TSA reduced collagen I deposition to 60% (rapid mode) and 43% (accelerated mode). In the presence of TGFβ1, collagen I was reduced to 65% (rapid mode) and 29% (accelerated mode), close to baseline amounts of normal conditions without TGFβ1 (Figure 5A,B). Fibronectin signals remained unchanged (Figure 5C,D), but cell proliferation was inhibited (Figure 5E).
Figure 5.
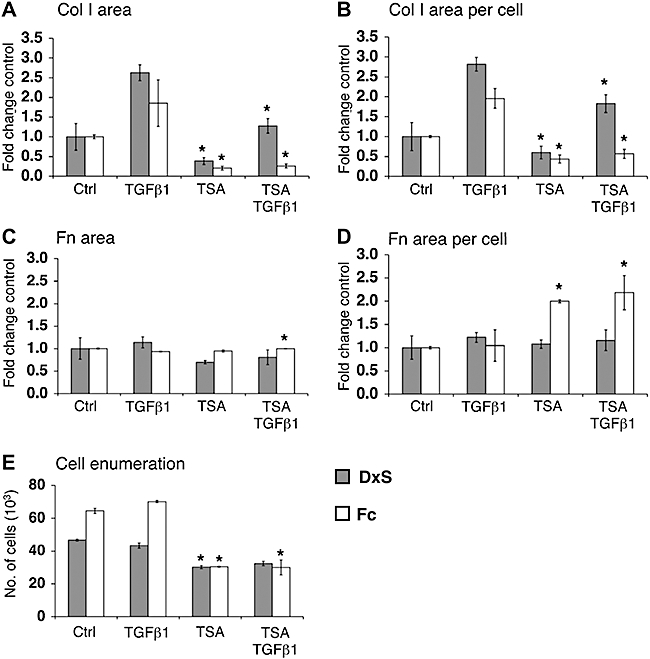
Epigenetic interference with collagen deposition. Area of collagen I (Col I) (A) was normalized to cell numbers (B). TSA reduced collagen I per cell to 60% (control, P= 0.02) and 65% (TGFβ1, P= 0.001) in rapid mode, and 43% (control, P= 0.007) and 29% (TGFβ1, P= 0.004) in accelerated mode. Comparing (C) area of fibronectin (Fn) with (D) area of fibronectin per cell highlights the importance of normalization to cell numbers. In rapid mode, TSA did not change fibronectin area per cell, but doubled it in the accelerated mode. TSA reduced cell numbers (E) to 65% (DxS, P= 2.52 × 10⁻⁵), 75% (DxS + TGFβ1, P= 0.001), 47% (Fc, P= 0.0005) and 43% (Fc + TGFβ1, P= 0.003). *P < 0.05 versus respective controls. Data are expressed as mean ± SD, calculated from triplicates and as fold changes over respective controls. Ctrl, control; DxS, dextran sulphate (rapid deposition mode); Fc, Ficoll cocktail (accelerated deposition mode); TGFβ1, transforming growth factor-β1; TSA, trichostatin A.
Post-transcriptional interference with collagen deposition
We had recently predicted miRNA 29c (miR29c) would target procollagen α1(I) mRNA by the rna22 algorithm (Miranda et al., 2006) and tested mimic and I29c in the rapid deposition mode. Both negative controls (scrambled oligos) did not affect collagen I deposition. In contrast, M29c reduced collagen I deposition in the absence of TGFβ1. Particularly in the presence of this growth factor, 10 and 1 nM M29c reduced collagen I to 13% and 28% of mock transfected controls (Figure 6A). Fibronectin deposition also appeared to be significantly reduced by M29c and in the presence of TGFβ1 (Figure 6B). I29c did not cause a significant change in collagen I deposition, but caused a reduction of deposited fibronectin in the presence of TGFβ1 (Figure 6A,B). Cell proliferation was not inhibited (Figure 6C).
Figure 6.
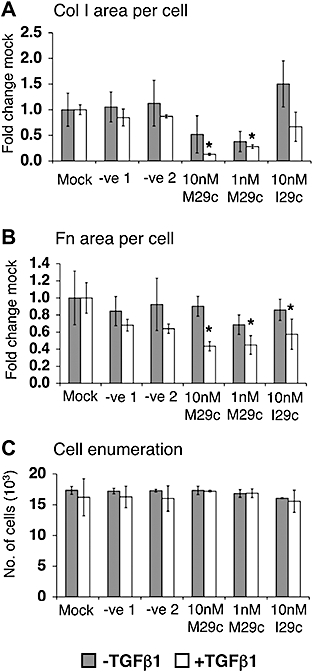
Post-transcriptional regulation of collagen deposition. (A) Mimic miRNA29c (M29c): scrambled controls 1,2 or inhibitory miR29c (I29c) did not affect collagen (Col I) deposition. However, M29c reduced it to 13% and 28% (TGFβ1, transforming growth factor-β1, P= 0.003 and P= 0.003). (B) Area of fibronectin (Fn) per cell was significantly reduced in the presence of TGFβ1 by M29c, as well as by 10 nM I29c to 43% (P= 0.024), 45% (P= 0.016) and 57% (P= 0.043) respectively. (C) Cell numbers were unaffected. *P < 0.05 versus respective controls. Data are expressed as mean ± SD, calculated from triplicates and as fold changes over respective controls.
Post- or co-translational interference with collagen deposition
Collagen prolyl-4-hydroxylase inhibitors like 2,4-PDCA (Tschank et al., 1987) and CPX (Clement et al., 2002) render collagen triple helices less thermostable and thus prevent their secretion. Reduction of collagen I was observed in both deposition modes (Figure 7A,B). Particularly in the presence of TGFβ1, 2,4-PDCA reduced collagen I deposits to 24% (rapid mode) and 23% (accelerated mode). In the absence of TGFβ1, CPX reduced collagen I to 2% (rapid mode) and 20% (accelerated mode), and in the presence of TGFβ1, to 1% (rapid mode) and 12% (accelerated mode) (Figure 7C,D). Either inhibitor did not significantly reduce fibronectin deposition (Figure 7E,F), and both compounds appeared to dampen cell proliferation moderately (Figure 7G). Effects of the hydrophilic 2,4-PDCA were evident in the accelerated mode only if added daily after the first 48 h. In contrast, the highly lipophilic CPX only required a single treatment.
Figure 7.
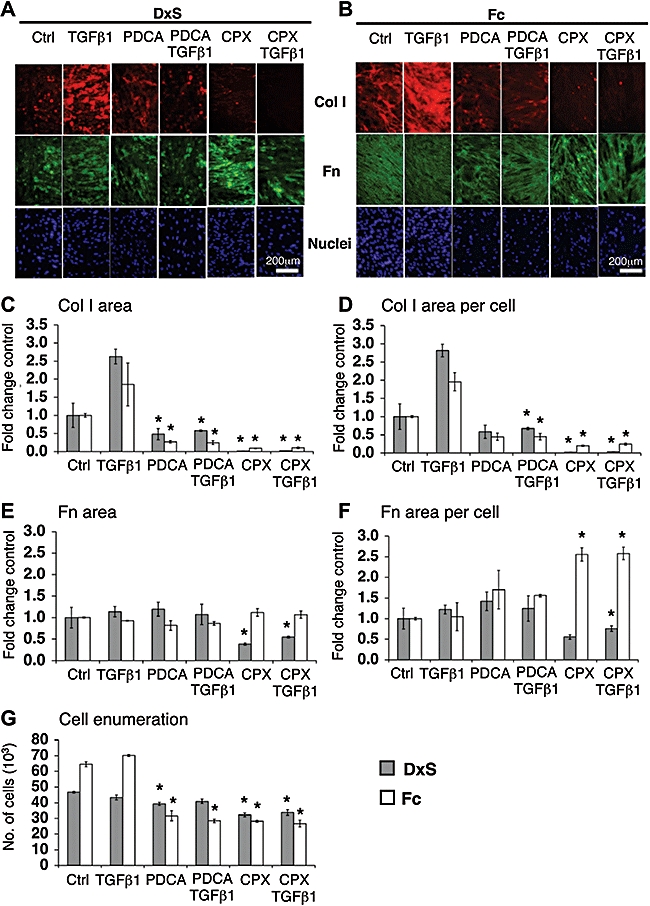
Optical analyses of the effects of co-translational inhibition of prolyl hydroxylase on collagen I (Col I) deposition. (A,B) Immunocytochemistry: perturbed ECM formation in both deposition modes at 100× original magnification. Area of collagen I (C) normalized to cell numbers (D). PDCA significantly reduced collagen I deposition, particularly in the presence of TGFβ1, in both modes. Collagen I per cell dropped to 24% (DxS, P= 0.015) and 23% (Fc, P= 0.005). CPX (8 µM) diminished collagen I area to 2% (control, P= 0.013) and 1% (TGFβ1, P= 0.001) in the rapid mode, and 20% (control, P= 1.26 × 10⁻⁵) and 12% (TGFβ1, P= 0.0006) in accelerated mode. (E) CPX caused a significant decrease of fibronectin (Fn) area in rapid mode, after normalization only in presence of TGFβ1 (62%, P= 0.005) (F). CPX also caused a significant increase in the area of fibronectin per cell in accelerated mode to 256% (control, P= 0.003) and 247% (TGFβ1, P= 0.007) and showed (G) anti-proliferative effects. *P < 0.05 versus respective controls. Data are expressed as mean ± SD, calculated from triplicates and as fold changes over respective controls. CPX, ciclopiroxolamine; Ctrl, control; DxS, dextran sulphate (rapid deposition mode); ECM, extracellular matrix; Fc, Ficoll cocktail (accelerated deposition mode); PDCA, 2,4-pyridinedicarboxylic acid; TGFβ1, transforming growth factor-β1.
Post-secretional interference with collagen deposition
Procollagen C-proteinase/BMP-1 controls the supramolecular assembly of collagen into fibrils via removal of the C-terminal propeptide from the procollagen I molecule. Optical analysis reported that the sulphonamide PCP56 reduced the deposited area of collagen I to 40% (rapid mode) and 52% (accelerated mode), and in the presence of TGFβ1 to 82% (rapid mode) and 43% (accelerated mode). Only in the rapid mode was fibronectin reduced to 46% (control) and 36% (TGFβ1) (Figure 3A,B). The accelerated mode showed a 17% decrease in cell numbers with PCP56 in the presence of TGFβ1. Although cell numbers were reduced, the absence of detached cells suggested slower proliferation rather than toxicity (Figure 3C). Biochemical analysis demonstrated that PCP56 treatment also resulted in accumulation of procollagen in the medium (Figure 3D,E).
β-Aminopropionitrile irreversibly inhibits lysyl oxidase, an amine oxidase that is crucial in stabilizing ECM by cross-linking collagen chains (Wilmarth and Froines, 1992). In both deposition modes, BAPN caused no reduction of area collagen I per cell (Figure 4A), but the area of fibronectin per cell was reduced to 62% (rapid mode) and 69% (accelerated mode) in the absence of TGFβ1 (Figure 4B). Cell proliferation was not affected (Figure 4C). SDS-PAGE revealed a reduction of β-bands representing cross-linked collagen I α-chains (Figure 4D,E), to 26% (control) and 33% (TGFβ1) in rapid mode, and to 62% and 32% (TGFβ1) in accelerated mode by densitometry (Figure 4F,G).
Matrix metalloproteinase 1 controls collagen turnover in the ECM (Gross and Nagai, 1965) by cleaving collagen at a single site. Cell layers with ECM created under both deposition modes were exposed to exogenous recombinant MMP1. We observed detachment of cells during MMP1 treatment especially in matrix derived from the rapid mode (Figure 8C). Therefore, the total area of collagen I per well was quantified without normalization for cell numbers. MMP1 reduced the area of deposited collagen I to 0.03% and 0.6% in the rapid and accelerated modes respectively (Figure 8A), and fibronectin deposition to 2% (rapid mode) and 19% (accelerated mode) (Figure 8B).
Figure 8.
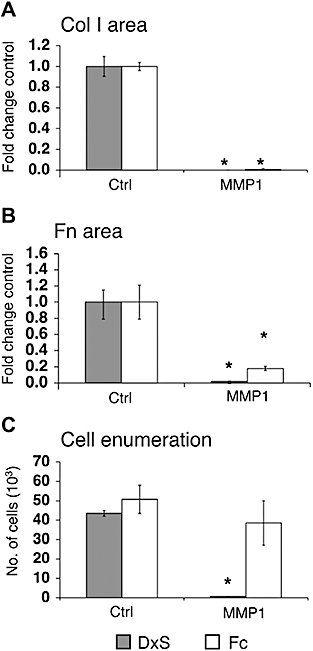
Optical evaluation of MMP1 activity on deposited collagen I (Col I) and fibronectin (Fn). Collagen I was deposited on the cell layer under DxS or Fc crowding as a substrate prior to MMP1 digestion. (A) MMP1 similarly reduced collagen I area to 0.03% (DxS, P= 0.003) and 0.6% (Fc, P= 0.0004). (B) The area of fibronectin was reduced to 2% (DxS, P= 0.008) and 18% (Fc, P= 0.02). (C) MMP1 digestion detached cells and significantly reduced cell numbers in the rapid mode to 1.6% (P= 0.0004) whereas cell numbers in the accelerated mode were relatively unaffected. *P < 0.05 versus respective controls. Data were expressed as mean ± SD, calculated from triplicates and as fold changes over respective controls. Ctrl, control; DxS, dextran sulphate (rapid deposition mode); Fc, Ficoll cocktail (accelerated deposition mode); MMP1, matrix metalloproteinase 1.
Discussion
Fibrosis has remained an unsolved therapeutic problem. An important obstacle in the development of antifibrotic compounds has been the lack of a comprehensive in vitro screening system, although all relevant biochemical steps of collagen matrix formation have been known for quite some time. The confounding factor of cell culture in standard aqueous media is its characteristic difference from the natural, ‘crowded’ state of tissue. Thus, the enzymatic conversion of procollagen to collagen by C-proteinase is too slow to allow the deposition of a substantial collagen matrix in a useful time window (Lareu et al., 2007a,b;). This already forecasts that the effects of C-proteinase inhibitors would be invisible under routine culture conditions, and IC50 values from cell-free assays used to test inhibitors of isolated enzymes and their corresponding substrates would not be an accurate physiological reflection of the inhibitors' efficacy in vivo. Thus, the risk of obtaining inconclusive results in experimental animals is considerable.
This is where the Scar-in-a-Jar takes model monolayer culture to a new pathophysiological level. Collagen deposition and cross-linking is substantially increased in vitro, with the option of two deposition modes. The rapid deposition mode produces granular collagen I aggregates within 48 h (Lareu et al., 2007a,b;), and a combination of neutral Ficoll 70 and 400 was found to produce collagen I with a reticular deposition pattern within 6 days. Thus amount, velocity and morphology of collagen deposition can be controlled depending on the macromolecules used. The accelerated mode (Fc) with its longer culture time also produces collagen with a larger extent of cross-linking. Optical quantitation of two-dimensional images of three-dimensional granular aggregates as produced in the rapid mode can result in under-reporting of deposited collagen, but less so with a reticular network (accelerated mode). The rapid mode (DxS), however, allows for a faster data output due to a shorter culture time. TGFβ1, a notorious culprit in fibrotic conditions (Varga and Jimenez, 1986), resulted in an additional 1.5–2-fold increase of collagen deposition in comparison with controls under both modes of crowding. TGFβ1 has pleiotropic effects; it slows down matrix turnover by reducing MMP1 expression, up-regulates lysyl oxidase activity and increases the presence of tissue inhibitors of MMPs (Overall et al., 1989). These effects are only apparent with a deposited matrix, underlining the importance of this novel screening system.
We compared our system with a FP model (Clark et al., 1997) that consists of TGFβ1-exposed hyperconfluent fibroblasts that form cell sheets. Destructive methods were employed to quantify hydroxyproline without the option to correct for cell number or total protein content. A modified version has been recently used by Fish et al. (2007) to assess C-proteinase inhibitors. In comparison, the FP models contained considerably less deposited collagen after 8 and 18 days than crowded subconfluent cultures, even in the absence of TGFβ1 for the latter. Of note, the ECM of FP contained collagen V, which is usually absent from fibrotic tissue (Kisseleva and Brenner, 2008). Thus, the ECM lacking collagen V under the rapid deposition mode would emulate a fibrotic matrix more closely. Also, there was a 1.5–2-fold increase of lysyl oxidase-mediated cross-links under crowded conditions in contrast to FP models, and this improvement of enzyme activity in vitro will facilitate the screening of another important therapeutic target in anti-fibrosis research.
Known and novel antifibrotic compounds were evaluated, and an overall close correlation between optical and biochemical quantitation methods was found. However, the Scar-in-a-Jar provides the option for simultaneous evaluation of other antigens and cell enumeration within the same well. This proved crucial in the case of TSA, which is known to be anti-proliferative in cancer cells (Wetzel et al., 2005; Platta et al., 2007), as it also inhibited fibroblast growth. After correction for cell numbers, our findings agree excellently with earlier work based on metabolic labelling and immunoprecipitation of collagen I, which showed that TSA suppressed TGFβ1-induced fibrogenesis in vitro (Rombouts et al., 2002). This and other current work suggests a new role for this class of compounds in fibrosis treatment (Wang et al., 2009).
We demonstrate the first instance of evaluating prolyl hydroxylase inhibitors under conditions of full matrix deposition. PDCA causes intracellular procollagen retention (Tschank et al., 1991), and related compounds are currently under evaluation for their cross-inhibitory effects on HIF-1-α prolyl hydroxylase (Asikainen et al., 2005). Its dual potential of inhibiting fibrosis while inducing angiogenesis was recently demonstrated in transgenic zebrafish (Raghunath et al., 2009). CPX is FDA-approved for the topical treatment of cutaneous mycoses (Batrafen®). As an iron chelator it was predicted to interfere with prolyl hydroxylases (Clement et al., 2002). We show here profound effects of CPX on the deposition of collagen, a novel example for indication discovery and an interesting antifibrotic, off-label potential, for this compound.
Targeting enzymes responsible for the proteolytic trimming of procollagen is another feasible antifibrotic strategy. To interfere with this step, a variety of procollagen C-proteinase/bone morphogenic protein-1 inhibitors have been designed (Burchardt et al., 1999; Robinson et al., 2003; Fish et al., 2007). Procollagen cleavage by C-proteinase is enhanced under macromolecular crowding in vitro. This feature enables the Scar-in-a-Jar to assess C-proteinase inhibitors in a native enzyme/substrate system under pathological scarring conditions, which was not possible prior to this model. The novel sulphonamide inhibitor, PCP56, demonstrated efficacy in excellent agreement with an earlier report (Fish et al., 2007). Biochemically, we noted the re-appearance of collagen I in the culture medium under PCP56 during crowding, proving the exclusion of the non-converted procollagen from matrix building. Another PCP inhibitor (FSY002) did not work in our system although an IC50 value was obtained with purified procollagen C-proteinase (Burchardt et al., 1999) (data not shown).
Based on observations in heritable connective tissue disorders (Pinnell, 1982), interfering with collagen cross-linking has been proposed to make scar tissue more susceptible to degradation (Vater et al., 1979; Kagan, 2000). Biochemical analysis clearly demonstrated the reduction of collagen cross-linking by BAPN in the rapid mode (DxS) and when added daily after the first 48 h in the accelerated mode (Fc), but overall collagen I amount was not reduced (Figure 4D–G). Similarly, optical analysis did not detect a reduction of collagen I matrix in either deposition mode, but was unable to differentiate and quantify cross-linked collagen. These results correspond with earlier findings that BAPN neither affects the amount of collagen synthesized nor the hydroxyproline distribution between cell layer and medium (Layman et al., 1971). However, a contrasting report found reduced collagen matrix in hyperconfluent cells (under non-crowded conditions) under TGFβ1/BAPN treatment for 3 days (Clark et al., 1997). Collagen cross-link reduction does not necessarily translate to reduced pericellular collagen. Perhaps under crowded conditions, increased collagen turnover due to reduced collagen cross-links might not be perceptible within this time frame due to enhanced collagen deposition.
Matrix metalloproteinase 1 has an important remodelling role in fibrosis. In contrast to other methods of evaluating MMP1 activity involving synthetic fluorescent substrates or zymography (Lombard et al., 2005; Troeberg and Nagase, 2007), we applied recombinant MMP1 to cell layers with a complex ECM bioassembled via both deposition modes (DxS and Fc). Efficient matrix degradation by MMP1 caused cell detachment of varying degrees and precluded application of the cytometry feature of our model. Optical quantitation of the total post-depositional reduction of collagen and fibronectin per well was performed instead. This represents an important step to evaluate MMP1 formulations designed to locally modulate tissue composition in a wound-healing setting.
Current reports have suggested that the miR29 family of miRNA at the gene expression level plays a role in ECM gene regulation of COL1A1, COL1A2, COL3A1, COL4A1, COL4A2, COL5A2, SPARC and FBN1 in tumour cells (Sengupta et al., 2008) and miR29b, in particular, regulates COL1A1, COL1A2, COL3A1 and FBN1 in cardiac fibrosis (van Rooij et al., 2008). Mcl-1 protein regulation by miR29c resulted in apoptosis induction (Mott et al., 2007) and recently, the miR29 family was also found to reduce p85α and CDC42 mRNA levels in HeLa cells (Park et al., 2009). The Scar-in-a-Jar demonstrates for the first time evidence for a potential antifibrotic effect of M29c at the protein level and confirms the mathematical prediction of rna22. This tool has the advantage of a read-out system focused on the net reduction of collagen I, regardless of multiple targets being affected simultaneously. For example, miR29c may regulate other key genes involved in the collagen biosynthetic cascade other than those targeting collagen I. Further work is underway to study the specific effects of miR29c on protein and gene expression level and to identify other targets in the collagen biosynthesis pathway that might be regulated by miR29c.
In conclusion, the Scar-in-a-Jar offers a novel pathophysiologically relevant screening and evaluation tool for antifibrotic lead compounds interfering with different key points of the collagen biosynthesis pathway, ranging from the epigenetic to the extracellular level.
Acknowledgments
The Authors would like to thank the NUS Tissue Engineering Programme and Professor Lee Eng Hin for strong support. The technical support of Larry Cheung and John Xu from Microlambda Pte is gratefully acknowledged. Identification of miRNA targets for procollagen I by Dr Isidore Rigoutsos, Bioinformatics and Pattern Discovery Group Thomas J. Watson Research Center International Business Machines (IBM) is truly appreciated. Dr Andrew Thomson, Genome Institute of Singapore helped greatly with the design of miRNA29c experiments.
Glossary
Abbreviations:
- BAPN
β-aminopropionitrile
- CPX
ciclopiroxolamine
- DxS
dextran sulphate (rapid deposition mode)
- FBS
fetal bovine serum
- Fc
Ficoll cocktail (accelerated deposition mode)
- FIT
fluorescence intensity
- Fn
fibronectin
- FP
fibroplasia model
- I29c
inhibitor miR29c
- M29c
mimic miR29c
- MMP1
matrix metalloproteinase 1
- miRNA
microRNA
- PBS
phosphate-buffered saline
- PDCA
2,4-pyridinedicarboxylic acid
- SDS-PAGE
sodium dodecylsulphate-polyacrylamide gel electrophoresis
- TGFβ1
transforming growth factor-β1
- TSA
trichostatin A
Conflict of interest
The authors state no conflict of interest. One of the authors (PVF) is a full-time employee of Pfizer.
Supporting Information
Additional Supporting Information may be found in the online version of this article:
Appendix S1 Optimization of cell numbers and collagen deposition for the collagen deposition modes, and biochemical validation of antifibrotic inhibitors. (Figure S1) Correlation of collagen deposition in the rapid and accelerated modes with cell density. (Figure S2) Correlation of collagen deposition with time in the accelerated mode. (Figure S3) Optimization of fixative methods for optical analysis. Biochemical validation of intracellular (Figure S4) and extracellular (Figure S5) collagen biosynthesis inhibitors.
Figure S1 Correlation of rapid (DxS) (A,B) and accelerated (Fc) collagen deposition mode (C,D) with cell density by the optical analysis method. (A) Rapid mode: under DxS treatment the total area of deposited collagen I shows an exponential increase up to 25 000 above which the rate of collagen I addition becomes linear; the total collagen I deposited per cell peaks at 50 000 cells per 24-well. (B) The area of collagen I deposition per cell peaks at 25 000 cells per 24-well. (C) Accelerated mode: under Fc treatment total area of collagen I deposition increased exponentially from 10 000 cells per 24-well onwards. (D) The area of collagen I per cell shows a similar exponential behaviour (C).
Figure S2 Accelerated matrix formation under neutral macromolecular crowding at days 2, 4 and 6 analysed by densitometry and optical analysis. (A) Densitometric evaluation of sodium dodecylsulphate-polyacrylamide gel electrophoresis gels revealed over 6 days that a twofold and 6.5-fold increase of collagen I deposition had occurred in the absence and presence of transforming growth factor-β1 (TGFβ1) respectively. (B) Collagen I on the cell layer was immunostained and quantified using optical analysis. Over 6 days, collagen I deposition was enhanced twofold and ninefold in the absence and presence of TGFβ1 respectively. Densitometry data were calculated from pooled triplicate samples, and optical analysis data were expressed as mean ± SD, as fold change in comparison with non-crowded controls.
Figure S3 Preservation and quantitation of deposited collagen I and cell enumeration is dependent on the fixative used. (A–C) Comparisons between live staining, 4% PFA and MeOH fixation. (A) MeOH yielded the greatest quantified area of collagen I deposited, followed by live staining and 4% PFA as the lowest. (B) Adherent cell enumeration revealed cell loss during live staining with the lowest cell retention level in comparison with 4% PFA and MeOH. (C) The area of collagen I per cell was calculated for normalization purposes.
Figure S4 Biochemical validation of intracellular collagen biosynthesis inhibitors by silver stained sodium dodecylsulphate-polyacrylamide gel electrophoresis. The (A,C,E,G) rapid (DxS) and (B,D,F) accelerated (Fc) modes of collagen deposition were treated with (A,B) 1 µM trichostatin A (TSA), (C,D) 10 mM 2,4-pyridinedicarboxylic acid (PDCA), (E,F) 8 µM ciclopiroxolamine (CPX) and (G) 10 nM mimic miR29c (M29c). Inhibitor treatment at the epigenetic, post-transcriptional and post-translational level resulted in a decrease of deposited collagen in the absence and presence of transforming growth factor-β1 (TGFβ1). Each lane represents pooled triplicates.
Figure S5 Biochemical validation of extracellular collagen biosynthesis inhibitors by silver stained sodium dodecylsulphate-polyacrylamide gel electrophoresis. extracellular matrix was deposited using the (A) rapid (DxS) and (B) accelerated (Fc) modes prior to addition of 50 µg per 24-well of exogenous matrix metalloproteinase 1 (MMP1). MMP1 digested the collagen I deposited in both modes. Each lane represents pooled triplicates.
Table S1 IC50 of tested compounds
Please note: Wiley-Blackwell are not responsible for the content or functionality of any supporting materials supplied by the authors. Any queries (other than missing material) should be directed to the corresponding author for the article.
References
- Anderson SM, Elliott RJ. Evaluation of a new, rapid collagen assay. Biochem Soc Trans. 1991;19:389S. doi: 10.1042/bst019389s. [DOI] [PubMed] [Google Scholar]
- Antonini JM, Charron TG, Roberts JR, Lai J, Blake TL, Rogers RA. Application of laser scanning confocal microscopy in the analysis of particle-induced pulmonary fibrosis. Toxicol Sci. 1999;51:126–134. doi: 10.1093/toxsci/51.1.126. [DOI] [PubMed] [Google Scholar]
- Asikainen TM, Ahmad A, Schneider BK, Ho WB, Arend M, Brenner M, et al. Stimulation of HIF-1alpha, HIF-2alpha, and VEGF by prolyl 4-hydroxylase inhibition in human lung endothelial and epithelial cells. Free Radic Biol Med. 2005;38:1002–1013. doi: 10.1016/j.freeradbiomed.2004.12.004. [DOI] [PubMed] [Google Scholar]
- Burchardt E-R, Schauer M, Stöcker W, Lampe T. Phosphinate peptide analogs for the treatment of fibrotic disorders. In USPTO ed, USA (Patent no: US 6,750,202 B1: http://www.patentstorm.us.
- Campa JS, McAnulty RJ, Laurent GJ. Application of high-pressure liquid chromatography to studies of collagen production by isolated cells in culture. Anal Biochem. 1990;186:257–263. doi: 10.1016/0003-2697(90)90076-l. [DOI] [PubMed] [Google Scholar]
- Clark RA, McCoy GA, Folkvord JM, McPherson JM. TGF-beta 1 stimulates cultured human fibroblasts to proliferate and produce tissue-like fibroplasia: a fibronectin matrix-dependent event. J Cell Physiol. 1997;170:69–80. doi: 10.1002/(SICI)1097-4652(199701)170:1<69::AID-JCP8>3.0.CO;2-J. [DOI] [PubMed] [Google Scholar]
- Clement PM, Hanauske-Abel HM, Wolff EC, Kleinman HK, Park MH. The antifungal drug ciclopirox inhibits deoxyhypusine and proline hydroxylation, endothelial cell growth and angiogenesis in vitro. Int J Cancer. 2002;100:491–498. doi: 10.1002/ijc.10515. [DOI] [PubMed] [Google Scholar]
- Fish PV, Allan GA, Bailey S, Blagg J, Butt R, Collis MG, et al. Potent and selective nonpeptidic inhibitors of procollagen C-proteinase. J Med Chem. 2007;50:3442–3456. doi: 10.1021/jm061010z. [DOI] [PubMed] [Google Scholar]
- Gristina AG. Implant failure and the immuno-incompetent fibro-inflammatory zone. Clin Orthop Relat Res. 1994:106–118. [PubMed] [Google Scholar]
- Gross J, Nagai Y. Specific degradation of the collagen molecule by tadpole collagenolytic enzyme. Proc Natl Acad Sci USA. 1965;54:1197–1204. doi: 10.1073/pnas.54.4.1197. [DOI] [PMC free article] [PubMed] [Google Scholar]
- Hata R, Senoo H. L-ascorbic acid 2-phosphate stimulates collagen accumulation, cell proliferation, and formation of a three-dimensional tissue-like substance by skin fibroblasts. J Cell Physiol. 1989;138:8–16. doi: 10.1002/jcp.1041380103. [DOI] [PubMed] [Google Scholar]
- Huber LC, Distler JHW, Moritz F, Hemmatazad H, Hauser T, Michel BA, et al. Trichostatin a prevents the accumulation of extracellular matrix in a mouse model of bleomycin-induced skin fibrosis. Arthritis Rheum. 2007;56:2755–2764. doi: 10.1002/art.22759. [DOI] [PubMed] [Google Scholar]
- Kaar JL, Li Y, Blair HC, Asche G, Koepsel RR, Huard J, et al. Matrix metalloproteinase-1 treatment of muscle fibrosis. Acta Biomater. 2008;4:1411–1420. doi: 10.1016/j.actbio.2008.03.010. [DOI] [PubMed] [Google Scholar]
- Kagan HM. Intra- and extracellular enzymes of collagen biosynthesis as biological and chemical targets in the control of fibrosis. Acta Trop. 2000;77:147–152. doi: 10.1016/s0001-706x(00)00128-5. [DOI] [PubMed] [Google Scholar]
- Kisseleva T, Brenner DA. Mechanisms of fibrogenesis. Exp Biol Med (Maywood) 2008;233:109–122. doi: 10.3181/0707-MR-190. [DOI] [PubMed] [Google Scholar]
- Lareu RR, Arsianti I, Subramhanya HK, Yanxian P, Raghunath M. In vitro enhancement of collagen matrix formation and crosslinking for applications in tissue engineering: a preliminary study. Tissue Eng. 2007a;13:385–391. doi: 10.1089/ten.2006.0224. [DOI] [PubMed] [Google Scholar]
- Lareu RR, Subramhanya KH, Peng Y, Benny P, Chen C, Wang Z, et al. Collagen matrix deposition is dramatically enhanced in vitro when crowded with charged macromolecules: the biological relevance of the excluded volume effect. FEBS Lett. 2007b;581:2709–2714. doi: 10.1016/j.febslet.2007.05.020. [DOI] [PubMed] [Google Scholar]
- Layman DL, McGoodwin EB, Martin GR. The nature of the collagen synthesized by cultured human fibroblasts. Proc Natl Acad Sci USA. 1971;68:454–458. doi: 10.1073/pnas.68.2.454. [DOI] [PMC free article] [PubMed] [Google Scholar]
- Lombard C, Saulnier J, Wallach J. Assays of matrix metalloproteinases (MMPs) activities: a review. Biochimie. 2005;87:265–272. doi: 10.1016/j.biochi.2005.01.007. [DOI] [PubMed] [Google Scholar]
- Meltzer EB, Noble PW. Idiopathic pulmonary fibrosis. Orphanet J Rare Dis. 2008;3:8. doi: 10.1186/1750-1172-3-8. [DOI] [PMC free article] [PubMed] [Google Scholar]
- Miranda KC, Huynh T, Tay Y, Ang YS, Tam WL, Thomson AM, et al. A pattern-based method for the identification of MicroRNA binding sites and their corresponding heteroduplexes. Cell. 2006;126:1203–1217. doi: 10.1016/j.cell.2006.07.031. [DOI] [PubMed] [Google Scholar]
- Mott JL, Kobayashi S, Bronk SF, Gores GJ. mir-29 regulates Mcl-1 protein expression and apoptosis. Oncogene. 2007;26:6133–6140. doi: 10.1038/sj.onc.1210436. [DOI] [PMC free article] [PubMed] [Google Scholar]
- Overall CM, Wrana JL, Sodek J. Independent regulation of collagenase, 72-kDa progelatinase, and metalloendoproteinase inhibitor expression in human fibroblasts by transforming growth factor-beta. J Biol Chem. 1989;264:1860–1869. [PubMed] [Google Scholar]
- Park SY, Lee JH, Ha M, Nam JW, Kim VN. miR-29 miRNAs activate p53 by targeting p85 alpha and CDC42. Nat Struct Mol Biol. 2009;16:23–29. doi: 10.1038/nsmb.1533. [DOI] [PubMed] [Google Scholar]
- Pinnell SR. Molecular defects in the Ehlers-Danlos syndrome. J Invest Dermatol. 1982;79(Suppl 1):90s–92s. doi: 10.1111/1523-1747.ep12545860. [DOI] [PubMed] [Google Scholar]
- Platta CS, Greenblatt DY, Kunnimalaiyaan M, Chen H. The HDAC inhibitor trichostatin A inhibits growth of small cell lung cancer cells. J Surg Res. 2007;142:219–226. doi: 10.1016/j.jss.2006.12.555. [DOI] [PubMed] [Google Scholar]
- Raghunath M, Steinmann B, Delozier-Blanchet C, Extermann P, Superti-Furga A. Prenatal diagnosis of collagen disorders by direct biochemical analysis of chorionic villus biopsies. Pediatr Res. 1994;36:441–448. doi: 10.1203/00006450-199410000-00005. [DOI] [PubMed] [Google Scholar]
- Raghunath M, Sy Wong Y, Farooq M, Ge R. Pharmacologically induced angiogenesis in transgenic zebrafish. Biochem Biophys Res Commun. 2009;378:766–771. doi: 10.1016/j.bbrc.2008.11.127. [DOI] [PubMed] [Google Scholar]
- Ramshaw JA, Werkmeister JA. Electrophoresis and electroblotting of native collagens. Anal Biochem. 1988;168:82–87. doi: 10.1016/0003-2697(88)90013-9. [DOI] [PubMed] [Google Scholar]
- Robinson LA, Wilson DM, Delaet NG, Bradley EK, Dankwardt SM, Campbell JA, et al. Novel inhibitors of procollagen C-proteinase. Part 2: glutamic acid hydroxamates. Bioorg Med Chem Lett. 2003;13:2381–2384. doi: 10.1016/s0960-894x(03)00402-5. [DOI] [PubMed] [Google Scholar]
- Rombouts K, Niki T, Greenwel P, Vandermonde A, Wielant A, Hellemans K, et al. Trichostatin A, a histone deacetylase inhibitor, suppresses collagen synthesis and prevents TGF-beta(1)-induced fibrogenesis in skin fibroblasts. Exp Cell Res. 2002;278:184–197. doi: 10.1006/excr.2002.5577. [DOI] [PubMed] [Google Scholar]
- van Rooij E, Sutherland LB, Thatcher JE, DiMaio JM, Naseem RH, Marshall WS, et al. Dysregulation of microRNAs after myocardial infarction reveals a role of miR-29 in cardiac fibrosis. Proc Natl Acad Sci USA. 2008;105:13027–13032. doi: 10.1073/pnas.0805038105. [DOI] [PMC free article] [PubMed] [Google Scholar]
- Sengupta S, den Boon JA, Chen IH, Newton MA, Stanhope SA, Cheng YJ, et al. MicroRNA 29c is down-regulated in nasopharyngeal carcinomas, up-regulating mRNAs encoding extracellular matrix proteins. Proc Natl Acad Sci USA. 2008;105:5874–5878. doi: 10.1073/pnas.0801130105. [DOI] [PMC free article] [PubMed] [Google Scholar]
- Tang L, Eaton JW. Inflammatory responses to biomaterials. Am J Clin Pathol. 1995;103:466–471. doi: 10.1093/ajcp/103.4.466. [DOI] [PubMed] [Google Scholar]
- Tredget EE, Falk N, Scott PG, Hogg AM, Burke JF. Determination of 4-hydroxyproline in collagen by gas chromatography/mass spectrometry. Anal Biochem. 1990;190:259–265. doi: 10.1016/0003-2697(90)90190-k. [DOI] [PubMed] [Google Scholar]
- Troeberg L, Nagase H. Analysis of TIMP expression and activity. Methods Mol Med. 2007;135:251–267. doi: 10.1007/978-1-59745-401-8_16. [DOI] [PubMed] [Google Scholar]
- Tschank G, Raghunath M, Gunzler V, Hanauske-Abel HM. Pyridinedicarboxylates, the first mechanism-derived inhibitors for prolyl 4-hydroxylase, selectively suppress cellular hydroxyprolyl biosynthesis. Decrease in interstitial collagen and Clq secretion in cell culture. Biochem J. 1987;248:625–633. doi: 10.1042/bj2480625. [DOI] [PMC free article] [PubMed] [Google Scholar]
- Tschank G, Brocks DG, Engelbart K, Mohr J, Baader E, Gunzler V, et al. Inhibition of prolyl hydroxylation and procollagen processing in chick-embryo calvaria by a derivative of pyridine-2,4-dicarboxylate. Characterization of the diethyl ester as a proinhibitor. Biochem J. 1991;275(2):469–476. doi: 10.1042/bj2750469. Pt. [DOI] [PMC free article] [PubMed] [Google Scholar]
- Varga J, Jimenez SA. Stimulation of normal human fibroblast collagen production and processing by transforming growth factor-beta. Biochem Biophys Res Commun. 1986;138:974–980. doi: 10.1016/s0006-291x(86)80591-5. [DOI] [PubMed] [Google Scholar]
- Vater CA, Harris ED, Jr, Siegel RC. Native cross-links in collagen fibrils induce resistance to human synovial collagenase. Biochem J. 1979;181:639–645. doi: 10.1042/bj1810639. [DOI] [PMC free article] [PubMed] [Google Scholar]
- Wang Z, Chen C, Finger SN, Kwajah MMS, Jung M, Schwarz H, et al. SAHA – a potential epigenetic therapeutic agent for long fibrosis? Eur Respir J. 2009 doi: 10.1183/09031936.00084808. in press. [DOI] [PubMed] [Google Scholar]
- Wetzel M, Premkumar DR, Arnold B, Pollack IF. Effect of trichostatin A, a histone deacetylase inhibitor, on glioma proliferation in vitro by inducing cell cycle arrest and apoptosis. J Neurosurg. 2005;103:549–556. doi: 10.3171/ped.2005.103.6.0549. [DOI] [PubMed] [Google Scholar]
- WHO. Global Burden of Disease 2004 update. Geneva, Switzerland: WHO press; 2004. [Google Scholar]
- Wilmarth KR, Froines JR. In vitro and in vivo inhibition of lysyl oxidase by aminopropionitriles. J Toxicol Environ Health. 1992;37:411–423. doi: 10.1080/15287399209531680. [DOI] [PubMed] [Google Scholar]
- Xu Q, Norman JT, Shrivastav S, Lucio-Cazana J, Kopp JB. In vitro models of TGF-beta-induced fibrosis suitable for high-throughput screening of antifibrotic agents. Am J Physiol Renal Physiol. 2007;293:F631–F640. doi: 10.1152/ajprenal.00379.2006. [DOI] [PubMed] [Google Scholar]
Associated Data
This section collects any data citations, data availability statements, or supplementary materials included in this article.