Abstract
Spinning biodisks have advantages that make them attractive for specialized biochip applications. The two main classes of spinning biodisks are microfluidic disks and bio-optical compact disks (BioCD). Microfluidic biodisks take advantage of noninertial pumping for lab-on-a-chip devices using noninertial valves and switches under centrifugal and Coriolis forces to distribute fluids about the disks. BioCDs use spinning-disk interferometry, under the condition of common-path phase quadrature, to perform interferometric label-free detection of molecular recognition and binding. The optical detection of bound molecules on a disk is facilitated by rapid spinning that enables high-speed repetitive sampling to eliminate 1∕f noise through common-mode rejection of intensity fluctuations and extensive signal averaging. Multiple quadrature classes have been developed, such as microdiffraction, in-line, phase contrast, and holographic adaptive optics. Thin molecular films are detected through the surface dipole density with a surface height sensitivity for the detection of protein spots that is approximately 1 pm. This sensitivity easily resolves a submonolayer of solid-support immobilized antibodies and their antigen targets. Fluorescence and light scattering provide additional optical detection techniques on spinning disks. Immunoassays have been applied to haptoglobin using protein A∕G immobilization of antibodies and to prostate specific antigen. Small protein spots enable scalability to many spots per disk for high-throughput and highly multiplexed immonoassays.
INTRODUCTION TO NONINERTIAL BIOCHIPS
Biochips are the biological equivalent of integrated circuits.1, 2, 3, 4, 5 They are small (square centimeters), highly multiplexed (hundreds to thousands of individual elements), and highly interconnected (microfluidic paths). Biochip fabrication shares much in common with electronic chips. Many use silicon wafers as substrates and utilize photolithography and multilayer deposition. The obvious difference is that the elements and information on a biochip are biomolecular, while on digital circuits the elements are electronic. Both can operate on digital data, but biochips also operate in analog mode as analytical platforms that quantitatively measure molecular concentrations.
In a similar analogy, biological compact disks (BioCDs) are the biological equivalent of the optical CD.6 They both use disks spinning at high speed to rapidly access information that is read out by a laser. The spinning-disk format has high data density and high speed and can be low cost.7 For optical readout, the limiting size of a “unit” of information is set by the wavelength of light. The surface area of a standard CD is approximately 5×10⁹ square wavelengths, and the digital data capacity of a CD is correspondingly about 5×109 bits of binary information. Consequently, a conventional CD carries approximately 1 bit of information per diffraction-limited optical mode. At a constant linear speed (1× speed of an audio CD) of 1.4 m∕s, all 5×109 bits could be read out sequentially in 74 minutes at a data rate of 150 kB∕s, and digital data CDs read out much faster.
The optical density and speed of a spinning-disk format provide potential advantages for biological analytical systems8, 9, 10, 11 and for analytical proteomics.12, 13, 14, 15, 16, 17 A biological specimen, such as serum or cell lysate, may contain over 10 000 different types of proteins in a range of concentrations that span over 12 orders of magnitude.18 This presents a considerable challenge to make accurate and quantitative analog measurements. Conversely, biological measurements are made using capture molecules that typically have only about three orders of magnitude of linear range in their target concentration.19 This makes it necessary to perform serial dilutions of the sample to bring analyte concentrations within the linear range of the capture molecules. Therefore, the complete concentration analysis of a biological specimen could require tens of thousands of measurements. The assays also need to be replicated, leading to further measurements per biological specimen. This level of multiplexing is literally orders of magnitude away from most current assay formats.20, 21 Comprehensive panels typically test only for several dozen analytes, although this number is increasing as doctors learn how to use the molecular information. The spinning-disk format of the BioCD (Refs. 22, 23, 24) provides a scalable resource that can match the advance of proteomics for the day when thousands of measurements will be useful and needed.
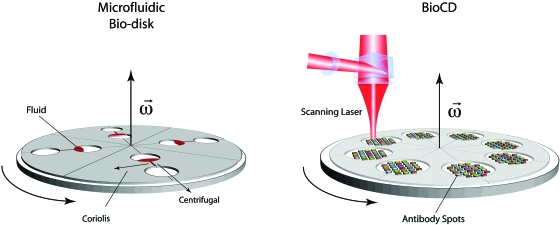
In this review, the physical principles of centrifugal and BioCDs are presented (Fig. 1). One of the distinct differences between the biodisks and conventional biochips is the noninertial frame of the spinning disk that causes noninertial forces such as Coriolis and centrifugal (centripetal) forces. These can be applied to microfluidic manipulation on the spinning disks. For instance, noninertial lab-on-a-chip concepts provide unusual approaches to microfluidic switching and mixing. These are the topics in Sec. 2. Laser detection is the most compatible approach to measure molecules on a surface moving at high speed. The basic physics of the optical properties of molecules on solid surfaces is presented in Sec. 3. These properties include the natural absorption and dispersion (refractive index) of molecules and thin films.
Figure 1.
(a) Centrifugal biodisk and (b) BioCD systems. Centrifugal biodisks are microfluidic lab-on-a-chip (or lab-on-a-CD) systems that use noninertial forces for fluid pumping and switching to manipulate and distribute fluids. The BioCD systems are used for optical detection of bound molecular films captured by recognition molecules such as antibodies spotted onto the disk surface.
The direct interferometric detection of molecular layers on a disk is reviewed in Sec. 4. It introduces the concept of interferometric phase quadrature that converts the phase perturbation of molecular layers into visible intensity shifts that can be measured directly with a photodetector. Achieving label-free detection of proteins without the use of fluorescent tags is a high priority in applied proteomics and experimental systems biology. Fluorescent tags can modify biological activity, are subject to quenching that limit quantization, and restrict the degree of multiplexed measurements. Because future proteomic applications will require hundreds or thousands of simultaneous measurements, molecular fluorescence detection is a fundamental bottleneck. The BioCD combines laser interferometry in the condition of phase quadrature with high-speed sampling on the spinning disk to yield surface height sensitivity down to 1 pm averaged over the area of a 100 μm diameter protein spot.
The scalability of the interferometric readout of biomolecular layers is discussed in Sec. 5 that describes fundamental detection limits. Spinning at high speed has the fundamental advantages of 1∕f noise suppression combined with repetitive signal averaging to achieve high signal-to-noise performance. High-speed scanning suppresses the noise floor typically by 40 dB. In contrast, systems that achieve 40 dB of signal enhancement require high optical gain that often must trade off against detection bandwidth and tighter tolerances for chip fabrication. For this reason the BioCD works in nonresonant optical configurations without any optical finesse, choosing to maximize the signal-to-noise ratio, not by increasing signal but by reducing noise. The effective area of a measurement plays an important role in establishing the scaling sensitivity to captured mass. The case is made to define a scaling sensitivity based on captured surface mass per root area. Applications of BioCDs for immunoassays is presented in Sec. 6. Examples are provided for human haptoglobin and for prostate specific antigen (PSA) for screening of prostate cancer (PCa).
CENTRIFUGAL AND SPINNING BIOANALYTICAL PLATFORMS
Centrifugation of liquid samples is an established laboratory technique in chemistry and biology.25 High-speed mechanical rotation is performed easily, and strong forces are easily generated. Centrifugal accelerations up to 1000g’s are routine, providing centrifugal forces of 1 nN on particles the size of mammalian cells. The transition from centrifuges to centrifugal microfluidic chips26, 27, 28 was natural because centrifugal force provides a convenient microfluidic pump. On-chip pressure generation has otherwise often been challenging.29, 30 Similarly, reading information from a spinning platform is the basis of all compact and data disk technology,7 and the transition from reading digital information to biological information on a spinning disk was a natural evolution.31, 32, 33 In this section, the centrifugal biological disks are reviewed, considering novel uses of the noninertial centrifugal and Coriolis forces to print and switch as well as to pump. The biological uses of digital CDs are also discussed in this section.
Microfluidic CDs
Centrifugal force on a fluid contained within a spinning disk provides a versatile resource for fluid propulsion.26 The force on fluids is distributed (much like gravity) but varies with position (linear in radius), leading to modifications in buoyancy forces and in flow rates through capillaries. The centrifugal force per volume is
| (1) |
The pressure at the far end of a radial column of incompressible fluid extending from radius r1 to r2 is
| (2) |
The permeability of a channel on a microfluidic CD has been calculated and measured34, 35, 36, 37 to be
| (3) |
where Dh=4A∕C is the hydraulic diameter of the channel, A is the cross-sectional area, and C is the wetted circumference of the channel. The associated volumetric flow rate is Q=κA. Flow rates as low as nl∕s and as high as ml∕s have been achieved.26
For a particle that displaces a fluid with a total mass difference Δm, the buoyancy force is
| (4) |
with a terminal velocity (for a sphere of diameter d)
| (5) |
where Cd is the drag coefficient. Therefore, buoyancy forces and terminal velocities depend where the particle is (at what radius) on the disk.
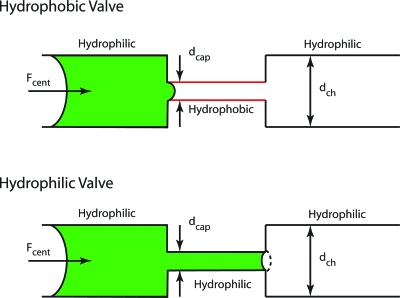
This angular-velocity-dependent pressure can balance a hydrophobic capillary throat that has a capillary pressure given by the Young–Laplace equation
| (6) |
where R1,2 are the two principal radii of the capillary throat and γ is the surface tension. When the centrifugal pressure exceeds the capillary pressure, then the fluid will move past the throat. Therefore, rotation provides a means to turn flow on and off, merely by changing the rotational frequency of the disk. The critical frequency for this centrifugal valve35 for a throat diameter d is
| (7) |
where σ is the surface tension of the liquid, and θc is the contact angle. In a complementary manner, a hydrophilic valve can be constructed by a sudden expansion of a hydrophilic capillary tube. Both types of valves are shown in Fig. 2.27
Figure 2.
A hydrophobic barrier uses a small hydrophobic capillary to keep liquid in the larger channel until sufficient centrifugal pressure is applied to overcome the capillary pressure of the small restriction. A hydrophilic barrier is a metastable configuration in which all the channel walls have the same contact angle. The capillary pressure keeps the liquid in the small tube until sufficient centrifugal pressure is applied to reverse the curvature to allow expansion into the large channel. Redrawn from Ref. 27.
Noninertial microfluidics
The three main noninertial applications of biodisks are pumping, valving, and mixing.26, 27, 28 Pumping is accomplished primarily through centrifugal force, providing a hydraulic head to move fluids from a source reservoir through microfluidic channels to a receiving reservoir. For instance, a centrifugal siphon design can be triggered by rotation after capillary priming at rest.38 Centrifugal force provides the displacement pressure for droplet formation,39 and centrifugal force can be combined with electric fields for biomedical separations.40 These uses of centrifugal pumping also enable hybridization and separation.41, 42 A pumping example that does not rely on centrifugal force but still uses the rotational motion of the disk is an active pumping mechanism that pumps gas by using a fixed magnet over which a deformable diaphragm with a magnetic plate repetitively circles.43
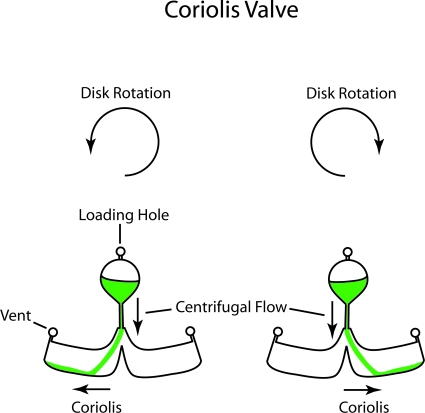
The Coriolis force presents a novel aspect for fluid manipulation on spinning disks. The Coriolis force is velocity dependent and is the result of a vector cross-product that causes the force to act at right angles to the velocity but also with a sign that depends on the clockwise or counterclockwise rotation. The Coriolis force density is
| (8) |
If the direction of rotation changes, the direction of the Coriolis force changes (if the velocity is unchanged). This effect was used to produce directional switches on spinning disks,37, 44 as shown in Fig. 3.
Figure 3.
A Coriolis valve. The force on the flow changes sign when the spin direction reverses. This allows fluid to drain in one direction for one spin direction and the other for the opposite spin direction. Redrawn from Ref. 44.
The Coriolis force also has been used for convective mixing.45 Mixing is an important component of many lab-on-a-chip applications, such as homogenizing reactants and speeding up reaction times. For instance, planetary centrifugal action enhances hybridization by enhancing mixing using thin chambers.46 Mixing can be enhanced by changing the flow direction to cause turbulence47, 48 and by flowing through bifurcating channels.49
The conventional use of centrifuges has primarily been for filtering and separation, and that is still true for microfluidic biodisks,50 for example, for the extraction of plasma from whole blood.51 Cell lysis is an important step in many biotechnical applications and has been demonstrated on a disk,52, 53 as has microbe cultivation.54 Microfluidic disks have also been used for sedimentation of photonic crystals.55
Microfluidic printing uses removable microchannels, usually in soft materials such as polydimethylsiloxane, to pattern molecules on functionalized surfaces.56 Centrifugal force provides a convenient means to drive fluids for microfluidic printing. Spokelike protein patterns on a BioCD are especially easy to generate using this method.57 More complicated microfluidic printing uses more than one printing step to produce arrays.58, 59 As an example, radial spoke patterns of probe molecules were printed on a disk surface. Then multiple samples were delivered to the disk through multiple spiral channels that crossed the originally immobilized spokes.58
Detection modes and applications of biodisks
The purpose of centrifugal biodisks is to manipulate fluids, followed by detection of particular properties. The broad generality of the centrifugal disks makes them applicable to many conventional detection modes, including matrix-assisted laser desorption∕ionization,60, 61 fluorescent assays using green fluorescent protein,62 enzyme-linked immunosorbent assays (ELISA),63 whole-cell reporter gene assays,64 fluorescent antibody assays,65 fluorescent detection of beads and quantum dots,66 and blood absorbance measurements using in-disk optical paths.67 The biodisks can be used as ionic biosensors.68 The disks also lend themselves to fundamental studies of microfluidics, such as imaging of menisci under noninertial forces.69
Bioassays are a clear application for biodisks. They have been used for hemoglobin measurements for point-of-care diagnostics70 and immunoassays for cancer markers alpha-fetal protein (AFP), IL-6, and CEA with detection limits of 0.15, 1.25, and 1.31 pmol∕l, respectively.71 They have also been applied to DNA hybridization.48, 72
Digital Biological Compact Disks
Digital CDs are extremely inexpensive platforms, and disk readers are mass-produced at low cost for the consumer-electronic market. The low cost and sensitive detection of commercial CD and digital video disk (DVD) readers could provide many advantages for biological applications and in particular for point-of-care diagnostics and ultimately home-care diagnostics. The main challenge has been to identify binding assay protocols and labels that are compatible with the hardware and software of conventional disk drives.
One of the first biological uses of digital CDs and readers demonstrated the ability to use a piezoelectric printer to print 75 μm diameter protein spots onto a CD surface and performed an inhibition immunoassay.73 The detection did not use the conventional read head but was based on fluorescence detection of a fluorescent label. This work was followed by using both surfaces of the disk32 in which digital data were read from the conventional surface and a colorimetric DNA hybridization assay was detected on the opposite surface. The choice of the colorimetric assay rather than fluorescence was because the polycarbonate resins of the disk autofluoresce and because colorimetric assays could be performed with high photon flux, which is more compatible with high-speed detection.
The first demonstration using a conventional CD laser read head was performed in 2003 (Ref. 33) by superposing the biological binding layer on top of the digital layer, immobilizing molecules on the polycarbonate surface of the disk. The binding of target analyte to the disk was detected as a bit error signal between digital prescan and postincubation scans. The detection was label-free with a detection limit of 1 pM of streptavidin.
To use conventional laser read heads on CD or DVD drives to read biological information, it is necessary to use conventional CD or DVD disks. To this end, there has been considerable effort to chemically functionalize the surfaces of conventional CDs or DVDs without adversely affecting their optical and mechanical properties. The simplest approach to surface chemistry was either to use the natural hydrophobic polycarbonate surface and to print proteins directly,74 to directly dope receptors into the polycarbonate,75 or to phosphorylate the surface.33 Other approaches include modifying the surface with isocyanate functionalized polymethylmethacrylate,76 with carbazide functionalized silica nanoparticles,69 treating to generate high density of reactive carboxylic acid groups,77 and spin-coating polystyrene.78 More recent and more gentle chemistries produce surface amino or thiol groups for either protein or nucleotide attachment.79
Several different detection modes may be used to detect biological binding on digital CDs. Light scattering approaches are the most direct, leading to bit errors between pre- and postscans of digital data.33, 80, 81 These approaches require labels to bring the molecular binding into a strong light scattering regime. Gold nanoparticles and precipitates80, 82, 83 have been used for this purpose, and particle labels also have been used to catalyze autometallography to boost the contrast,32, 78, 80, 81, 84, 85 similar to silver staining on a Western blot. An alternative colorimetric approach uses calcium-sensitive film on the disk that changes color upon uptake of calcium86, 87 but with significantly lower sensitivity than the silver staining approach. Fluorescence detection73, 77, 88, 89 on digital CD∕DVD platforms typically does not acquire the data on the digital channel. As a microspectroscopy system, Raman scattering has been implemented using the optical pickup technology90 and by preconcentration of analyte with surface-enhanced active sites.91
Assays that have been performed on digital CD∕DVD platforms include both immunoassays and oligonucleotide hybridization assays. The immunoassays were competitive inhibition immunoassays for hydroxyatrazine, carbaryl, and molinate,73 the neurotoxin chlorpyriphos with a limit of detection (LOD) near 300 pg∕ml,78 AFP with an LOD near 8 ng∕ml and atrazine with an LOD near 40 pg∕ml,80 the pesticide metalachlor with an LOD near 600 pg∕ml,84 and c-reactive protein at an LOD of 1 pM.82
It must be noted that all of these assays consisted of sandwich assays in which a second antibody to an antigen must be bound, often carrying a gold nanoparticle as a catalyst for silver enhancement. For a multiplexed assay, there may be as many different secondary antibodies as there are antigens to detect in the multiplex. For a few analyte targets, this approach is feasible. However, for highly multiplexed assays the accumulating cross-reactivities of the secondary antibodies limit the ability to expand the multiplexed detection beyond approximately 20 targets. For this reason, there is an economic driving force for the development of label-free assays that do not require the sandwich antibody. In this case, the secondary antibody cross-reactivity limit is removed, and the number of multiplexed assay may approach 100. To achieve label-free detection of molecular binding, it is necessary to move from the digital CD detection approach to an analog detection approach that uses molecular interferometric detection. This is the approach of the BioCD that uses phase quadrature interferometry to detect directly the presence of submonolayer molecular films on surfaces.22, 24
OPTICAL PROPERTIES OF BIOLOGICAL MOLECULES AND FILMS ON SURFACES
Optical mass-sensitive biosensors are based on the retardation of light caused by increased dipole density captured to a recognition molecule.92, 93, 94, 95 The detection of this retardation is achieved directly by interferometric optical biosensors. Young-type and Mach–Zender interferometers have used evanescent waves and integrated optical approaches to achieve long interaction paths,96, 97, 98, 99 while thin film interferometers have relied on spectral shifts100, 101, 102 or phase-quadrature conditions103, 104, 105 for direct imaging. Interferometric biosensor performance is comparable with other noninterferometric label-free optical approaches106, 107 but can provide simpler implementation with higher potential for multiplexed measurements. The BioCD uses capture molecules (antibodies) immobilized on solid support (surfaces) to capture target molecules (antigens) out of solution. The captured molecules are interrogated with a focused laser as the disk carries the molecules through the laser beam. The optical properties of molecules on surfaces are a fundamental aspect of the detection.
This section begins with molecular dipoles and then treats the electromagnetic boundary conditions of the surface and how these influence far-field interferometric measurements of the surface dipole density. Boundary conditions also influence fluorescence efficiencies for fluorescent molecule detection. Antinodal boundary conditions (with an electric field maximum at the capture surface of the biosensor) produce the strongest interferometric and fluorescent signals because they maximize the interaction of the field with the surface-bound molecular dipoles.
Molecular scattering
All biomolecules have a molecular polarizability that is a tensor relation between the applied field and the dipole moments , where is the molecular polarizability tensor. Because protein molecules lack high symmetry, the tensor polarizability is simplified through configurational averaging to a scalar polarizability α relating the induced dipole moment to the applied electric field. Many protein molecules are globular in structure, such as the immunoglobulins, and to lowest approximation may be viewed as dielectric spheres. The polarizability of a dielectric sphere of radius a is
| (9) |
where εp is the dielectric function of the sphere and εm is the dielectric function of the surrounding medium.108 The dipole field of the dipole induced by an incident field causes molecular scattering and ultimately is the origin of the refractive index of a layer of biological molecules.
Molecules are well within the isotropic Rayleigh scattering limit with a differential scattering cross section given by
| (10) |
where the effective scattering area of a dielectric sphere is proportional to the cross-sectional area of the sphere but reduced by the factor in brackets.108 For the case of biological macromolecules with a radius of 3 nm and a dielectric constant of approximately ε=2 in air, the reduction is approximately 10−8. The effective scattering cross section for such a molecule is σ=10−20 cm2.
The phase shift and intensity shift in the far field of a focused Gaussian beam incident on a single molecule can be calculated as the starting point for understanding molecular interferometry. The phase shift on the optic axis of the detected Gaussian field is given by
| (11) |
For a molecule of radius a=3 nm with εp=1.432=2 in air at a wavelength of 500 nm and a beam radius of 0.5 μm, this is a phase shift of about 1×10⁻⁷.
To estimate how detectable this phase shift is, consider the situation when the π∕2 phase shift between the Gaussian field and the scattered field is shifted to zero to place it in the condition of constructive interference. The relative intensity modulation is then
| (12) |
which is four times the value of the phase shift along the optic axis. One factor of two is from the interference cross terms, and the other is from the integration over the Gaussian profile. Therefore, for typical parameters, the relative intensity modulation from a single macromolecule is about one part per million. The approximate shot noise that this corresponds to is a photon number of 1×10¹², which is about 400 nJ. If this energy is detected in a millisecond detection time, the power at the detector would be about 400 μW, which is an easy power level to achieve with conventional photodiodes. Therefore, a single macromolecule could be detected using interferometry under shot-noise-limited detection conditions.
Surface fields and phase quadrature
Most optical biosensors detect molecules that are either attached to a surface or are in close proximity to one. Surfaces are planes of dielectric discontinuity that split the amplitude of waves into transmitted and reflected partial waves.109 Surfaces also represent electromagnetic boundary conditions that can enhance or suppress fields, depending on constructive or destructive interference of the incident and reflected waves at surfaces. Alternatively, the dielectric discontinuity gives rise to image charges and image dipoles that contribute to scattered fields. Therefore, molecular scattering at surfaces plays a central role in many aspects of optical biosensors. Of particular importance for interferometry is the condition of phase quadrature when the scattered molecular field has a 90° phase shift relative to the local reflected reference field. The condition of phase quadrature converts the phase perturbation of the molecule to an intensity change that is measured directly in the far field.
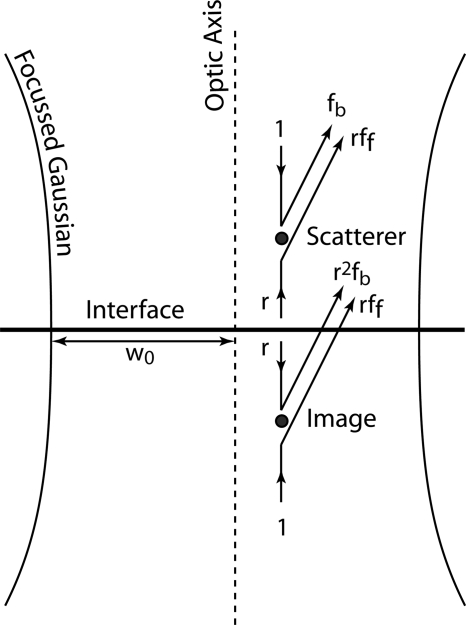
The scattering configuration for a particle near a surface is shown in Fig. 4. This configuration generates four contributions to the scattered wave in addition to the reflected incident wave. If the particle is small, then the Born approximation is applicable, the incident wave is not depleted, and there would be no shadowing of the surface by the particle. In this small-particle limit, each wave crossing the interface acquires a factor of the complex reflection coefficient r. The resultant field at location (x,y) on the Fourier plane of a lens of focal length f is
| (13) |
where (x′,y′) is the location of the scatterer, θ is the observation angle, and (x,y) is the location on the Fourier plane. The scattering coefficients are angle-dependent and are separated into a backscattering coefficient fb(θ) and a forward-scattering coefficient ff(θ), although for isotropic scattering fb(θ)=ff(θ). The field G(x,y;x′,y′) is a Green’s function that is integrated over the scatterer density ρ(x′,y′) (in the dilute limit) and over a nonuniform illumination (Gaussian beam) field E(x′,y′),
| (14) |
The total field in the far field is
| (15) |
where E(x,y) is the Fourier transform of E(x′,y′). The factor of i comes from the Kirchoff integration over the continuous-valued incident field110 and arises as the incident beam propagates from the near field to the far field.
Figure 4.
Dipole scattering near a surface using image scattering in which the interface is replaced by two dipoles and two counterpropagating plane waves.
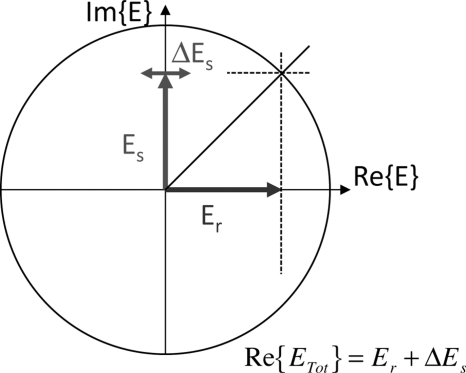
The relative phase of the incident and the scattered waves in the near field determine whether a phase shift is detected in the far field or if an intensity change is detected. If the incident and scattered fields are in-phase in the near field, then they produce phase modulation (90° out of phase) in the far field. However, if the local scattered fields have a 90° phase shift relative to the incident field, this produces intensity modulation in the far field and is detected directly. The generation of this π∕2 phase shift locally establishes the condition of phase quadrature, illustrated in Fig. 5 from the point of view of two-wave interference. A signal wave carrying a phase modulation interferes with a reference wave. If the signal and reference waves are π∕2 out of phase (in quadrature), then the phase modulation on the signal wave is in-phase with the reference field, which leads to an intensity term in the interference. For a phase-modulated signal wave interfering in the far field with a reference wave with a relative phase ϕrel, the detected intensity is
| (16) |
When the relative phase (in the far field) is ϕrel=π∕2, then the phase modulation on the signal is detected as intensity
| (17) |
with a relative intensity modulation
| (18) |
It is possible to generate the local π∕2 phase shift by using microstructures or by multiple layers that comprise the substrate, among others. These approaches will be discussed later in this review.
Figure 5.
The phase-quadrature condition between a signal and a reference field. When the relative phase between the signal and reference is π∕2, then a phase modulation (ΔEs) on the signal is in-phase with the reference wave Er and is transduced into an intensity modulation on the combined field.
The condition of interferometric phase quadrature is primarily a concept from two-wave interference. In a two-mode or a two-path interferometer, the interferometric response function is a sinusoidal function of output intensity as a function of phase shift. The steepest parts of this interferometric response curve give the largest intensity change per phase change. In the two-mode case, the maximum slope occurs when there is a 90° phase difference (hence the quadrature nomenclature) between the reference field and the signal field. A small phase modulation on the signal field then produces the maximum intensity modulation on the interferometer output. In this case, the condition of phase quadrature is identical with the condition of maximum slope of the interferometric response function.
This two-mode interference example can be extended for the interference of multiple waves and in particular to multilayer mirrors and to resonant structures such as Fabry–Pérot etalons. These have interferometric response curves that are no longer sinusoidal but instead have much steeper functions. Steeper response functions produce larger transduction of phase-to-intensity by
| (19) |
and the condition of maximum response slope gives the largest intensity signal per phase modulation. This condition of maximum slope can be approximately related to phase quadrature, and multilayer structures can be used for direct detection of molecular layers by operating at conditions near the maximum slope of the response curve.24 Quantitative simulation is needed to predict the responsivity of an interferometric biosensor to increasing biolayer thicknesses. The optical properties of structures with discrete layers can be easily simulated using the transfer matrix method.111
Experimental investigations of optical values of molecules and proteins on surfaces have used imaging ellipsometry,112, 113, 114 internal reflection ellipsometry,115, 116, 117 spectroscopy,118, 119 and interferometry.120, 121 While these use different substrates and buffers and macromolecules, the effective index for proteins on surfaces range between n=1.3 and n=1.5. The differences relate mainly to differences in molecular size and density of adsorption. The differential relation between refractive index and protein mass density is approximately dn∕dρ=0.2 cm3 g−1.119, 121
BIOCD OPTICAL DETECTION
The three primary optical detection modes for laser scanning a spinning disk are (1) interferometry, (2) fluorescence, and (3) scattering. Interferometric scanning can include absorption122 as an imaginary component of a refractive index because detection of common-path interferometry is intensity based, just as for absorbance measurements. Fluorescence is a clearly separate phenomenon, with a Stokes shift between the excitation wavelength and the emission wavelength. The surface fields can be optimized for both wavelengths to maximize emission.123 Scattering includes Mie scattering as well as nonlinear scattering, such as surface-enhanced Raman, although the high disk speeds are not naturally compatible with long integrations times for low-light detection.
Optical tracking
Spinning disks wobble, presenting a challenge to the optical detection of molecular species on a disk surface. Two approaches may be taken to optically track the surface of a spinning disk. The one taken by digital CDs uses a closed-loop feedback system with voice-coil magnetic actuators to move the laser head above the spinning disk. As the disk wobbles, the laser head moves to adjust, maintaining tight focus on the disk surface. This active tracking is achieved using quadrant split detectors and anamorphic lenses.7 By using lightweight plastic lenses, read-head mass is made small to eliminate inertia of the voice-coil actuators that are driven by error signals from the split detector. The digital CDs take the active tracking route because the laser spot size is nearly diffraction limited, and the depth of focus is correspondingly only a few microns.
The alternate approach to optically tracking the surface of a spinning disk relies on low numerical aperture lenses (long focal length and deep depth of focus) with passive systems that stabilize the spinning disk. The resource to accomplish this is a stable spinner and motor. In this case, no active tracking is needed, considerably simplifying the optical engineering. In addition, it is convenient to move the disk rather than the optics, further simplifying and stabilizing the optical system for the disk readout. This second approach is the one taken by the BioCD. The sacrifice is the size of the laser beam focal spot that can be tens of microns compared with the submicron focus of the digital CDs. However, because of heterogeneity in the immobilization of biological layers, larger laser beam spots have the advantage of spatial averaging.
BioCD quadrature classes
The interferometric detection of protein on spinning disks requires the condition of quadrature. Several different ways to establish quadrature have been developed. These include microdiffraction of the focused laser beam off the microstructures on the disk surface,124 a phase-contrast configuration125 that detects local changes in protein density, an in-line (IL) configuration126 that detects the direct protein and disk surface topology, and an adaptive optical approach127 that uses an adaptive beam mixer. All of the BioCD quadrature classes incorporate high stability as a fundamental and intrinsic component of the detection22 by using a common-path configuration24 in which both the signal and the reference waves are generated from the same location on the disk and share common paths to the detector.128 (The adaptive optical quadrature class, on the other hand, is not common path but uses a nonlinear adaptive optical mixer to phase lock the signal and reference waves for stable operation.) Table 1 summarizes the near-field generation of the protein-induced phase modulation in the condition of quadrature and the far-field detection geometry.
Table 1.
BioCD quadrature classes.
| Microdiffraction | Adaptive Optical | Phase-contrast | In-line | Land contrast | |
|---|---|---|---|---|---|
| Near-field | Ridges or pits microfabricated on the disk | Printed protein on antinode surface | Printed protein on antinode surface | Printed protein on eighth-wave layer | Microetched mesas |
| Far-field | Apertured detector | Detector | Split detector | Detector | Detector |
Common-path interferometry
All two-mode interferometers have two complementary output channels that are the in-phase (amplitude) channel and the quadrature (phase) channel. For interferometric detection of protein on a BioCD, the two complementary channels are distinguished in the far field by the symmetry of the intensity modulation, one symmetric (the amplitude channel)129 and the other asymmetric (the phase channel).125 These are intimately connected but are sensitive to different attributes of the surface topology. The amplitude channel detects the surface topology h(x) directly, while the phase channel detects the derivative of the surface topology dh(x)∕dx.
When a protein is a monolayer or less in thickness, then the complex-valued reflection coefficient r of a substrate is modified to24
| (20) |
where P(r) is
| (21) |
rp is the reflection coefficient of the air-protein interface, and all values are complex valued. The phase shift upon passage through the biolayer is
| (22) |
Equation 21 has the simple interpretation of a reference wave reflected with the original reflection coefficient r of the bare substrate plus a signal wave with a phase that is linearly dependent on the phase information of the protein layer. If r is purely real and positive, then the protein produces net phase modulation when the two waves are combined in the far field. If r is purely imaginary, then the protein produces net intensity modulation when the two waves are combined. In the general case of r neither purely real nor imaginary, both effects occur together.
When the protein has a spatially varying topology represented by h(x,y), then the far-field intensity varies as the disk spins underneath the focused laser beam. The varying intensity includes changes in the mean intensity (symmetric signal) and shifts of the far-field pattern (asymmetric signal). These symmetric and asymmetric changes are detected using a split detector in the far field. The detector current from the symmetric combination of the detector quadrants is called the IL signal. The detector current from the asymmetric combination of the detector quadrants is called the differential phase contrast (DPC) signal. These detector currents are related to the disk reflectance and the protein topology through24
| (23) |
where g2(x) is the Gaussian intensity profile, d(x) is a Dawson function (Hilbert transform of a Gaussian function), and the multiplication symbol represents convolution. The real and imaginary parts of the phase modulation are
| (24) |
Equation 23 illustrates how the IL and DPC signals respond to the local biolayer on the dielectric surface. The IL channel sensitivity is determined only by the imaginary part of the conversion factor ϕ(r), while the DPC channel is determined only by the real part. By deconvolution, it is possible to obtain the biolayer profile from any single channel, and both channels are capable of mapping the surface protein topology on the BioCD. A specific dielectric stack design can maximize ϕIm or ϕRe to enhance the IL or the DPC channel, respectively.
The equations for the IL and DPC channels are simplified to lowest order as
| (25) |
showing the dependence of the IL signal (symmetric far field) on the surface topology and the dependence of the DPC signal (asymmetric far field) on the derivative of the surface topology. These relations show the clear separation between the two detection channels. DPC senses the differential protein height, being most sensitive to slopes and steps, while being insensitive to areas with uniform thickness. The far-field symmetry for DPC is antisymmetric, and the phase-contrast sensitivity is maximized when the reflectivity is real and positive (antinodal surface). The IL channel has the opposite attributes, sensing the direct protein height with a far-field intensity pattern that is symmetric, and the IL channel is maximized with a reflectivity that is purely imaginary. One way to achieve a purely imaginary substrate reflectivity is with an eighth-wavelength dielectric layer on a high-reflectance substrate, but other more complicated substrate structures can achieve this phase condition as well. For instance, a Bragg quarter-wave stack in the reflectance side-band achieves this condition for selected wavelengths.24
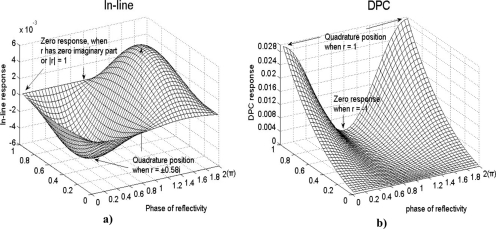
In practical applications, the signal-to-noise ratio is favored by maximizing ϕIm∣r∣2 and ϕRe∣r∣2. Numerical simulation of ϕIm∣r∣2 reaches extrema of ±0.0027 (IL channel optimized) when , and ϕRe∣r∣2 reaches extrema of ±0.0272 (DPC channel optimized) when r=1 (antinode disk). For these values, the incident angle was taken to be 30°, the wavelength was 488 nm, and the refractive index of the biomaterial was 1.43. The intensity modulations ΔI in response to 1 nm of protein are plotted as functions of the modulus ∣r∣ and the reflected phase in Figs. 6a, 6b for the IL and the DPC channels, respectively, showing the complementary relation between the IL and the DPC responsivities.
Figure 6.
(a) Calculated IL response and (b) DPC response to 1 nm protein layer as a function of the modulus and the phase of r. In the calculation, it is assumed that the incident angle is 30° (s-polarized) at a wavelength of 488 nm. Redrawn from Ref. 24.
Phase-contrast BioCD
Detection of biomolecules on surfaces using the phase-contrast BioCD shares much in common with differential interference contrast (DIC) microscopy and with laser scanning profilometry. Phase contrast microscopy and DIC microscopy have both traditionally been used to image biological cells or to measure surface profilometry.130 Laser scanning has been used extensively for surface profiling using dual path interferometry,131, 132 and differential dual-beam systems with either spatial offset,133, 134, 135, 136 or angular offset for heterodyne detection.137 Single-beam configurations have detected both amplitude and phase shifts in surface reflectance using a common-path approach.138
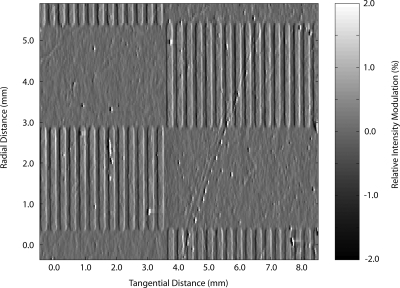
These differential approaches become more powerful when the substrate is structured to optimize the electric field interaction with an overlying layer and when the substrate spins at high speed for narrow bandwidth detection.125, 139, 140 The optimal surface electric field condition to excite protein dipoles is an antinode disk with a reflection coefficient r=+1. This puts the quadrature condition completely within DPC detection. As seen from Eq. 25, this detection mode detects the slope in the surface height profile. Therefore, expanses of flat printed protein are not detectable, only their edges. This imposes the need for spatially modulated protein immobilization on the phase-contrast disk. One approach to immobilize spatially modulated protein is the use of photolithography.140 A “checkerboard pattern” of spatially modulated protein is shown in Fig. 7. The spokes are avidin printed onto a biotinylated polysuccinimide surface on an antinodal dielectric disk.125 The gray-scale creates the illusion of topology and shadows, but the figure displays raw data in successive traces from the DPC channel with positive signals on the leading edge and negative signals on the trailing edge of the immobilized avidin stripes.
Figure 7.
Patterned avidin on a dielectric mirror with an antinode condition detected using DPC laser scanning. The data are unfiltered raw tracks stacked into a 2D representation that gives the impression of 3D. Replotted from Ref. 125.
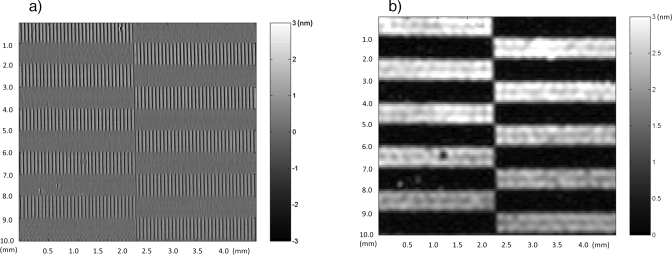
The spatial periodicity of the patterned protein presents an opportunity to perform frequency demodulation to detect the average protein height. This is achieved using single side-band demodulation.125 In this procedure, the data are Fourier-transformed and the dominant Fourier component is isolated, shifted back to zero frequency, and inverse-transformed back into the space domain. This procedure takes a periodic signal, as in Fig. 8a, and converts it into an average protein height, shown in Fig. 8b. The demodulation acts as a low-pass filter and also serves to average the protein height over an effective area on the disk. The difference in protein height between two consecutive demodulation scans is 20 pm, which translates to a scaling surface mass density of 1.5 pg∕mm.125
Figure 8.
Side-band demodulation of DPC data of patterned avidin on a dielectric reflecting mirror. The raw data are shown in (a), and the demodulated data are shown in (b). The demodulation removes the periodic stripe pattern and replaces it with the average stripe height with a scaling mass density of 1.5 pg∕mm.
IL BioCD
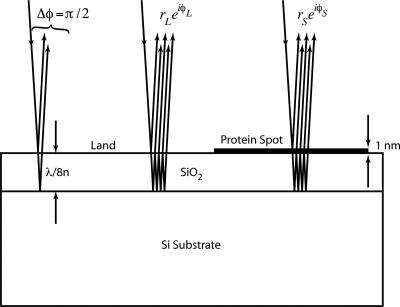
When the reflection coefficient of the substrate is purely imaginary (r=±i∣r∣), then the phase load associated with the overlying protein layer is converted directly to intensity in a far-field detector. This quadrature condition can be achieved as a single oxide layer on silicon, shown in Fig. 9, that has a thickness near an eighth wavelength. In this case, the partial waves reflected from the top and bottom surfaces of the oxide layer are out of phase by π∕2.
Figure 9.
Thermal oxide on silicon. When the oxide thickness is an eighth-wave, there is a π∕2 phase difference between the top and bottom reflections (reflection coefficient is purely imaginary). This establishes a quadrature condition that converts the phase load of a thin protein layer directly into intensity at the far-field detector.
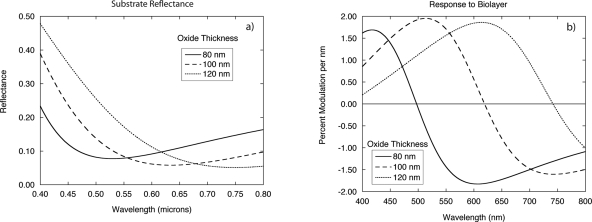
The calculated reflectance of a single layer of thermal oxide on silicon is shown in Fig. 10 as a function of wavelength for thicknesses of 80, 100, and 120 nm. The phase-contrast response to a protein layer is maximized at the reflectance minima. The IL response to protein is a maximum to shorter or longer wavelengths than the reflectance minimum. The optimized IL thicknesses are not exactly an eighth-wave because the best IL response is a combination of the quadrature condition and high-field conditions, which pulls the optimum thickness away from the exact eighth-wave points.
Figure 10.
(a) Reflectance as a function of wavelength for three different oxide thicknesses on silicon. (b) The relative change in reflectance as a function of wavelength for the three oxide thicknesses in response to 1 nm of bound protein. The reflectance change is approximately 2% per nanometer of bound protein.
Immobilized protein on an interferometric layer leads to an IL intensity response that can be detected directly without the need for the split detector of phase-contrast scanning. Reflectance spectroscopy is a common detection approach, and several colorimetric biosensors have been based on this principle.95, 102, 141, 142 On the other hand, from Fig. 10b the maximum intensity response to protein is a flat function of wavelength near the quadrature conditions. Therefore, a single detection wavelength can be chosen near the optimum, and the surface can be observed either by scanning an IL BioCD.24, 123, 126, 129, 143, 144, 145, 146 or observed in an imaging system.103, 104, 105
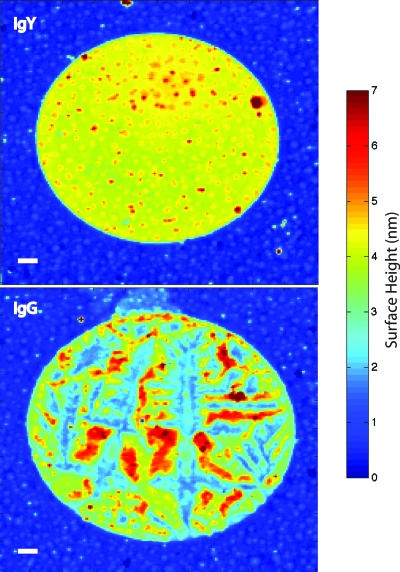
IL interferometric scans of two adjacent antibody spots (IgG and IgY) printed on butyraldehyde functionalized thermal oxide on silicon are shown in Fig. 11. The average spot heights were approximately 4 nm. The IgY antibody spot retained good surface homogeneity, while the IgG spot shows strong disruption and tears in the monolayer. These data were taken with a focal spot diameter of 2 μm with a 1 μm radial pitch. The protein spots were approximately 100 μm in diameter.
Figure 11.
High-resolution interferometric scans of two different antibody spots printed on butyraldehyde-functionalized silica surfaces. Bar is 10 μm. The top is a chicken IgY and the bottom is a goat IgG. The average spot height is approximately 4 nm.
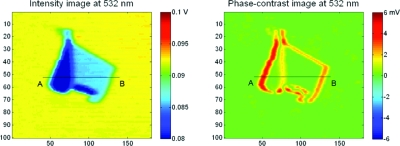
A substrate that is off-optimum for both IL and DPC detections is ideal for the simultaneous acquisition of both channels. In this case, it is possible to measure with high accuracy the refractive index of molecular layers on the substrate using picometrology,122 which combines spinning-disk and common-path interferometries. As an example of picometrology, an anomalously large dispersion in the refractive index of graphene adsorbed on thermal oxide on silicon was measured at two wavelengths.147 An example of IL and DPC scans of a graphene sheet on thermal oxide on silicon is shown in Fig. 12 for a wavelength of 532 nm. It is also possible to fabricate structured BioCDs that operate at more than one quadrature condition. A micropatterned variation in the IL BioCD has been demonstrated and works as an optical balance by etching mesa structures that place the land and the mesa at opposite IL quadrature conditions.144 This land-contrast BioCD has extremely high sensitivity and has been used to measure the physical adsorption of water molecules onto the disk surface. The IL configuration can also be used for substrates other than silicon.147, 148
Figure 12.
IL and DPC scans of graphene sheets adsorbed on thermal oxide on silicon at a wavelength of 532 nm. The refractive index of the graphene film (there is a monolayer and a trilayer in these data) is obtained by combining the data from both phase-contrast and IL channels. Reprinted from Ref. 122.
Microdiffraction BioCD
The microdiffraction BioCD124 uses a wavefront splitting configuration that is most similar to the digital CD, but it is adapted to have an analog response in a phase quadrature condition. Digital CDs use pits embossed in aluminized plastic to spoil the reflectance of a focused laser beam. When half of the laser intensity falls in the pit and half on the land (the area surrounding the pits), then this represents a 50∕50 wavefront splitting interferometer. The digital pit depth is a quarter-wave, producing destructive interference in the far field.7 This concept is easily adapted to produce a maximum-sensitivity analog signal in the condition of phase quadrature by reducing the pit depth to eighth-wave.
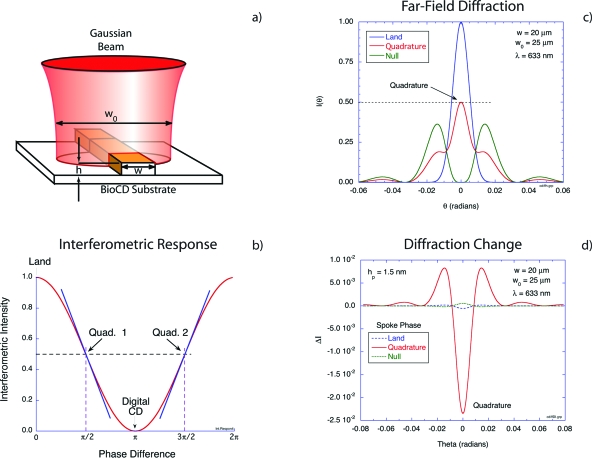
The principle of operation of the microdiffraction BioCD is shown in Fig. 13. A focused Gaussian beam straddles a high-reflectance ridge, shown in Fig. 13a, on a high-reflectance substrate called the land. Half of the beam intensity falls on the ridge and half on the land, establishing the balanced wavefront splitting as the beam is diffracted to the far field. The intensity on the optic axis in the far field is shown as a function of the ridge height in units of wavelengths in Fig. 13b. For a height of zero, the far-field diffraction is simply the reflected Gaussian beam. For a height of π∕2, there is complete destructive interference in the far field along the optic axis. Half-way between these two conditions is the condition of quadrature when the reflected intensity is half of the maximum and the slope relating ridge height to intensity is steepest.31 This is the condition when immobilized protein on the spoke produces the strongest intensity shift.
Figure 13.
Response of a ridge-based interferometer to immobilized protein. The ridge in (a) performs as a wavefront splitting interferometer, with half intensity on the ridge and half on the land. The intensity along the optic axis exhibits an ideal two-wave response, shown in (b) as a function of ridge height. The far-field diffraction is shown in (c) for different spoke heights, and the change in intensity upon protein immobilization is shown in (d).
The far-field diffraction is shown in Fig. 13c for the three ridge height conditions of land, null, and quadrature. The null condition has zero intensity on the optic axis but has intensity at higher angles. These higher angles are the “other port” of this two-port interferometer. The change in the far-field diffraction when a protein layer with a height of 1.5 nm is added to the ridge is shown in Fig. 13d. For the land and null cases, there is virtually no change in the far-field diffraction.149 The intensity response is quadratic in the scaled protein height (scaled relative to a wavelength) (hp∕λ)2≈10−5 for these ridge heights. On the other hand, at quadrature the intensity change is linear in the protein height (hp∕λ)≈10−3. The intensity response to protein is approximately 1.5% per nanometer.
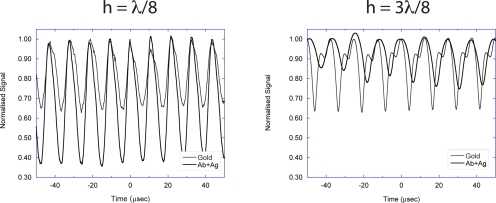
There are two opposite quadratures on the interferometric response curve of Fig. 13b. These have equal but opposite slopes, which produce opposite response when protein is immobilized on the ridge. An experimental verification of this effect was performed for two ridge sets, one with a height of λ∕8 and the other with a height of 3λ∕8.23 The ridges were gold fabricated on silicon using photolithography. Antibody IgG molecules were immobilized on the gold ridges using octadecanethiol physical adsorption chemistry. These ridges were constructed as radial spokes, and laser-scanned traces are shown in Fig. 14. For both cases, as the gold spoke spins under the focused Gaussian beam, the reflected intensity on the optic axis is modulated from the land (high value) to approximately half intensity when the beam straddles the ridge. When protein is added for the λ∕8 case, immobilization of antibody and capture of antigen further reduces the reflectance in the straddled condition. However, for the 3λ∕8 ridges, the attached protein increases the reflectance in the straddled condition, as predicted by the opposite slope at this second quadrature position.
Figure 14.
Reflectance as a function of time for a microdiffraction BioCD for bare gold ridges and after antibody immobilization and antigen capture. Comparison of gold ridge heights of λ∕8 in (a) and 3λ∕8 in (b), illustrating opposite quadratures, decreasing or increasing intensity upon protein binding, respectively. From Ref. 23.
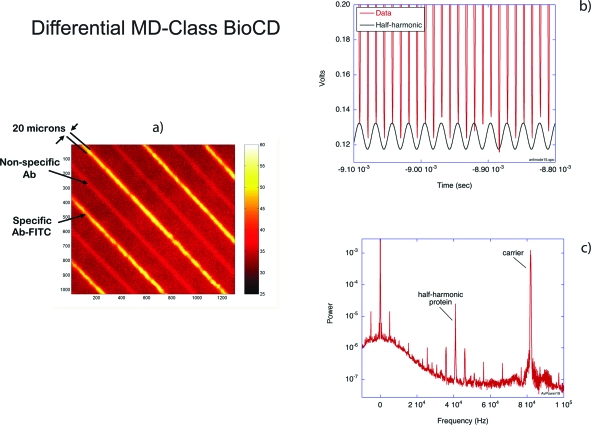
An important aspect of frequency-domain detection is the ability to perform many differential measurements quickly. Furthermore, the differential signal for antibody binding is ideally a difference between specific binding relative to a nonspecific antibody. For the microdiffraction (MD)-class BioCD, this requires antibody immobilization on alternating gold spokes. This was accomplished using photolithography in which alternating spokes on a 1024-spoke silicon BioCD were covered by photoresist, followed by thiol attachment and then removal of the photoresist.150 The results are shown in Fig. 15. The antibody was conjugated with the FITC fluorophore. The disk image shows fluorescence from alternating spokes in Fig. 15a. The interferometric scan is shown in Fig. 15b, with alternating signals producing a half-harmonic. The power spectrum in Fig. 15c shows the protein half-harmonic clearly at half the frequency of the carrier (set by the spokes).
Figure 15.
Differential immobilization of protein on gold spokes. (a) The disk image shows FITC-conjugated antibody immobilized on alternating spokes. (b) The intensity as a function of time as the disk spins shows a clear half-harmonic. (c) The power spectrum has a clear peak caused by the alternating protein signal with a signal-to-noise of approximately 300:1.
There are several open issues relating to the MD-class BioCD. One unresolved issue is the signal of protein immobilized on gold structures. Gold presents nearly an ideal nodal electromagnetic boundary condition, which would be expected to quench the protein signal. However, experiments on the gold MD-BioCD have shown that immobilized protein on the gold behaves essentially as a height increase of the spoke in spite of the boundary condition. Reasons for this behavior may relate to the skin depth of gold as well as potential plasmonic effects, although there has so far been no evidence that plasmonic effects participate in the signal generation. An experiment was performed with gold spokes on an antinodal dielectric stack with protein immobilized on the land rather than the spoke.150 This configuration performed with higher amplitudes, as expected.
Adaptive optical BioCD
The IL,129 DPC,125 and microdiffraction quadrature classes124 of BioCD are all common-path configurations using local generation of the reference wave to make the interferometry stable. However, there are other means to lock the relative phase of the signal and reference waves. One of these is through the use of photorefractive adaptive optics.151
Photorefractive two-wave mixing152, 153, 154, 155, 156 is a versatile means to perform adaptive beam combining157 that locks the phase between a phase-modulated signal wave and a reference wave. The photorefractive material with the highest compensation bandwidth to remove mechanical vibrations is photorefractive quantum well (PRQW) devices.157, 158, 159 PRQWs are semi-insulating optoelectronic devices158 based on semiconductor multiple quantum wells. They have applications in laser-based ultrasound detection,157, 160 optical coherence imaging,161, 162, 163, 164 and femtosecond pulse manipulation.165, 166, 167 A spinning disk carrying patterned protein films through a focused laser beam represents a high-frequency phase modulation that can be captured under phase-locked conditions using adaptive interferometry.57
As an example of an assay on the adaptive optical BioCD, a two-analyte assay was performed that had two targets, mouse IgG capturing antimouse IgG, and rabbit IgG capturing antirabbit IgG. The two reactions served as the nonspecific reference for each other. The disk was divided into five annular bands. First, mouse IgG was printed in a spoke pattern on the disk using the microfluidic printing method.168 The first frame on the left of Fig. 16 shows uniform frequency-domain signals from the printed mouse IgG patterns. In the second frame, rabbit IgG antigen at 200 μg∕ml saturated the free surface. Signals in frame 2 dropped to near the noise level as the land filled in, indicating that the rabbit IgG layer on free surfaces has an optical thickness similar to that of mouse IgG. Note that the entire disk is flat after this last step, but the surface has two functionalized surfaces in alternating spoke patterns: one mouse antigen and the other rabbit antigen. By incubating bands B and C with antirabbit and then bands C and D with antimouse, the functionally patterned surface re-emerged, with cancellation in band C by the balanced binding of both targets (final frame in Fig. 16a).
Figure 16.
Two-analyte experiment to detect mouse IgG antimouse IgG binding and rabbit IgG antirabbit IgG binding. Frame 1: printed mouse IgG. Frame 2: after global incubation with rabbit IgG. Frame 3: bands B and C were exposed to antirabbit IgG. Frame 4: bands C and D were exposed to antimouse IgG. Bands A and E were reference bands. The schematic of the experiment is shown on the right. Redrawn from Ref. 127.
Multichannel and fluorescence BioCD
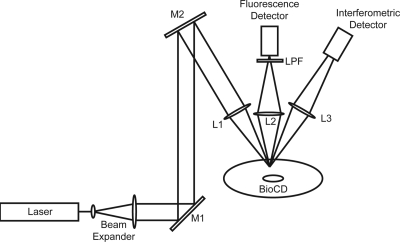
Scanning a spinning disk with a laser has a broad generality for many modes of detection. In addition to the amplitude and phase interferometry channels, there can be other channels, such as for fluorescence detection or light scattering. Light scattering and fluorescence share a common detection configuration with the angle of view far from the specular reflection of the interferometry channels. A multimodal experimental configuration is shown in Fig. 17.123 The incident 488 nm probe and reflected beams are at angles of 30°, with the scattering∕fluorescence detector arranged vertically along the surface normal. This provides strong spatial separation between the fluorescence channel and the interferometry channel, acting as a spatial filter. For fluorescence detection, a 500 nm long-pass filter was used to block scattered light from the 488 nm pump. Alternatively, the filter could be removed to detect the scattered pump light directly.
Figure 17.
Experimental layout using the 488 nm line from an argon laser incident at 30° and focused on the BioCD. The interferometric signal is detected in the reflected light, while the fluorescence signal is collected by a lens above the disk. The oblique-incidence design spatially separates the two channels.
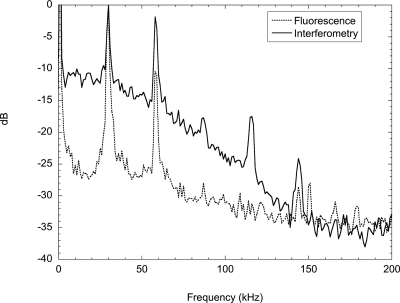
Experiments were performed on printed fluorescent protein stripes that were visible in both the interferometric and fluorescent channels. The periodicity of the stripes provided a convenient way to measure noise floors in the Fourier domain. The frequency power spectra are shown in Fig. 18 for the two channels.123 Fluorescence detection is essentially background free and hence has a low noise floor. Interferometry, on the other hand, measures all mass present on the disk surface and has a much higher noise floor.
Figure 18.
Power spectra of simultaneous fluorescence and interferometry of printed protein stripes on an IL quadrature BioCD. The square-wave protein pattern produces many harmonics. The fluorescence has noticeably lower background than interferometry.
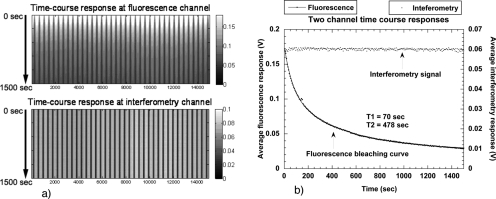
The simultaneous measurement of both fluorescence and interferometry provides a unique opportunity to explore if there is a connection between fluorescence bleaching and refractive index. As the fluorophores are bleached, it is possible that an effect on the refractive index would be caused by the disruption of the molecular dipole of the fluorophore. The results of the experiment are shown in Fig. 19. The horizontal axis is the scanning time axis, while the vertical axis is a stack of successive traces. The fluorescence signal is clearly bleached on repeated passes of the laser over the printed fluorophore, while the interferometry signal remains constant. The time decay of the signals is shown on the right of Fig. 19. The interferometric signal (which measures dipole density) is constant, while the fluorescence exhibits a biexponential decay as it bleaches. There is no detectable influence of fluorophore bleaching on the refractive index of the printed material on the disk surface.
Figure 19.
Two-channel scans performed continuously on the same track consisting of antibody conjugated with fluorescein after a reverse-phase assay. The interferometry wavelength is 488 nm, and the fluorescence wavelength is 510 nm. (a) shows the time-course scanning results on both channels as a function of position and time. The fluorescence becomes weaker with time (increasing downward) due to bleaching. (b) shows the signal intensity variations. From Ref. 123.
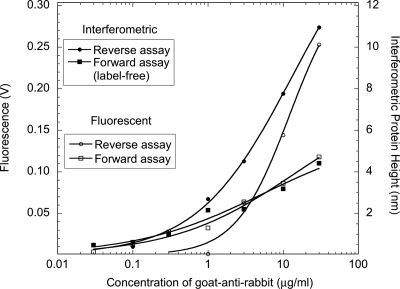
The dual-mode detection also makes it possible to explore the differences between forward-phase and reverse-phase immunoassays. In a forward-phase assay, the active antibody is printed on the disk and then exposed to its target analyte in sample solution. In a reverse-phase assay, the antigen is printed and then exposed to the antibody in solution. Despite the symmetry of these two binding processes, there is a strong asymmetry in their performance. The comparison of a forward and reverse assay is shown in Fig. 20 using both interferometry and fluorescence.123 The reverse assay shows considerably stronger response for concentrations above 1 μg∕ml than the forward assay. The fluorescence channel and the interferometric channel agree well in both cases, indicating that the interferometric mass closely matches the fluorescent signal in this case.
Figure 20.
Comparison of forward and reverse assays using the two channels for interferometry and fluorescence. The interferometry was performed at 488 nm and the fluorescence was at 510 nm. The reverse assay shows a strong amplification for concentrations above 1 μg∕ml.
DETECTION SENSITIVITY AND SCALING
The detection limits of many mass-sensitive detection techniques have traditionally been expressed in terms of minimum detectable surface mass density in units of mass per area. For instance, surface plasmon resonance typically quotes values around 1 pg∕mm2.106 In the case of surface plasmon resonance, the sensing area is often limited by the width of the plasmon resonance, which can drift across the chip, restricting measurement areas to the range of millimeters. However in the case of the BioCD, the operating point does not drift significantly across even a 100 mm diameter disk. Therefore it is possible to perform extensive averaging to improve the minimum detectable surface mass density. Just as repetitive averaging reduces random noise, averaging surface height measurements over larger areas similarly reduces protein height uncertainties. Therefore, detection limits for mass detection cannot be expressed in terms of a mass per area because the detection limit decreases when larger disk areas are used to average the measurement. On the other hand, there is a related property called scaling mass sensitivity145, 169 that is an intrinsic property of the detection technique and that can be used to calculate detection sensitivities as a function of the averaging area.
If the spot-to-spot height fluctuations of a population of spots are uncorrelated and characterized by a standard deviation Δhspot, then the standard error on the average spot height is . To express this in terms of area, it is sufficient to take the area of a spot aspot compared to the total area A over which the spot values are averaged. In this case
| (26) |
where the parameter h′ is
| (27) |
and is scale free, meaning that it is an intrinsic property of the detection platform. It has units of length times root area.
The minimum detectable surface mass density is likewise
| (28) |
where
| (29) |
is scale free and has units of mass per root area or mass per length.
In this scaling analysis, it was assumed that there was no correlation among the spot heights. However, when spatial correlations do occur, the standard deviation from the mean value of the population of spots is dependent on the size of the population. As the population size grows, the standard error decreases slower than the square root of the population size. If the spatial correlations are themselves scale free (if they have a power-law dependence on size), then there is a direct relationship between the scaling of the correlations and the scaling of the standard error.145
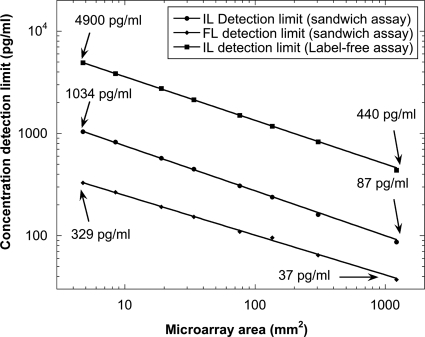
The LOD for interferometric and fluorescent detection of antibody spots on a BioCD is plotted in Fig. 21 as a function of number of spots in the population.145 The power-law dependence of the standard deviation σ∝AH−1∕2 fits the data relating the standard deviation to the area occupied by the spots. The exponent was found to be in the order of H=0.05 and 0.1 for the interferometry and fluorescence channels, respectively.
Figure 21.
The concentration detection limit for rabbit IgG is plotted with the detection area. Both interferometric and fluorescent detections have power-law dependence on the area, respectively, with exponents −0.45 and −0.40 (from Ref. 145).
IMMUNOLOGICAL ASSAYS
The principal applications for the BioCD are immunoassays in which printed capture molecules bind target analytes (antigens) out of a sample solution. The emphasis is on label-free detection in which the bound analyte is detected directly interferometrically without any secondary labels. Unlike the centrifugal CDs, which include microfluidics and real-time incubations, the BioCD operates in the format of an end-point assay. In this format, the disk surface is divided into multiple “wells” in which antibody spot arrays are printed. Small volumes of sample are pipetted into the wells, incubated for an incubation time, and then washed, dried, and scanned for antigen binding. The final laser scan reads the spots in the dry state, which makes it critical to eliminate any residues in the final disk wash. It should be pointed out that very few label-free direct-detection schemes use dry read because of the presence of chemical residues after the final wash. However, these residues can be reduced to the level of tens of picometers using careful subtraction of nonspecific binding and other systematics, enabling assay sensitivities into the range of several hundred pg∕ml in buffer solutions and several ng∕ml in serum samples.
Assay protocol and detection
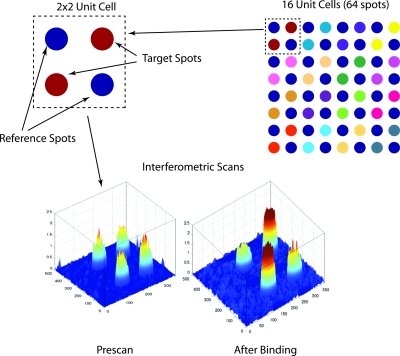
The principle antibody spot structure on the BioCD is the 2×2 unit cell. This spot layout is shown in Fig. 22. The target spots are specific to the target analyte molecules, while the reference spots are isotype antibodies (same molecular species and same host animal) that are not specific to the target. The target and the reference spots are arranged on opposite diagonals of the 2×2 unit cell. The unit cell response function is defined as
| (30) |
which is the normalized height increment difference between the target and reference spots. The normalization by the prescan height compensates for differences in print density. The difference of the target and reference spots compensates for nonspecific binding that is common to both types of spots. The difference between the postincubation and the prescan compensates for common background. In addition, the averaging can include more unit cells if higher accuracy is needed. Typically there is a 4×4 array of unit cells in each BioCD well. The unit cell structure compensates for many of the systematic errors that accompany chemical binding on the disk surface.
Figure 22.
Unit cell structure of the antibody spots. The target spots are active antibodies seeking target analyte molecules in sample. The reference spots are isotype antibodies that are not specific to the target molecule. A well typically has a 4×4 array of unit cells. The interferometric scans show the prescan antibody height and the additional height upon binding target molecules after the assay binding.
In a single well, into which a single biological sample is pipetted, there can be many unit cells with many different capture antibodies. Each unit cell represents an assay against a different target molecule in the single sample. On a 100 mm diameter BioCD, there can be approximately 500 individual 3 mm diameter wells that can hold a sample volume of 10 μl, each containing approximately 64 unit cells of target and reference spots. The multiplex level in this case is 64 with a throughput of 500 individuals and a total of 32 000 assays per disk. Of course, other combinations are possible. As the multiplex level increases, the number of patients per disk would decrease to keep the total number of assays constant. This scalability is a consequence of the small footprint of single antibody spots and the fast sequential reading on the spinning disk.
Two incubation protocols are used commonly. These are the equilibrium assay and the end-point assay. For the equilibrium assay a full-disk incubation is performed on an orbital shaker. The equilibrium assay eliminates diffusion-limited and volume-limited performance of solid-support kinetics on the BioCD. This provides sufficient analyte numbers and sample volume as well as convective transport. Under these conditions the assays approach equilibrium conditions. For the end-point assay, sample is pipetted into each well on the disk and allowed to stand for 30 min to 1 h and then washed. There are strong transient transport effects that occur during pipetting and also caused by convection during evaporation. End-point assays are much faster but do not approach equilibrium.
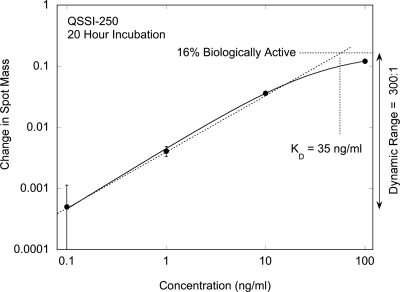
The response curve for an equilibrium reverse-phase assay as a function of analyte concentration is shown in Fig. 23 for antigen (IgG molecules) printed on a di-isocyanate surface chemistry on the silica surface of the BioCD. The response is plotted in units of mass gained per spot (normalized to the printed mass) against the concentration of specific analyte. The error bars on the graph are statistical, based on the average over a large set of spots on the disk (approximately 3000). Also included is a smooth fit to a stretched response modeled by a Langmuir function for the bound antigen versus free antibody reaction. The sensitivity limit of the assay was 100 pg∕ml, corresponding to a mass difference of only 10 fg∕spot.
Figure 23.
Equilibrium reverse-phase assay capturing antibody out of solution. Each incubation was for 20 h at increasing concentration. The equilibrium constant is 35 ng∕ml with a vertical dynamic range of 300:1 and a 16% active fraction of antigen.
Label-free haptoglobin assay
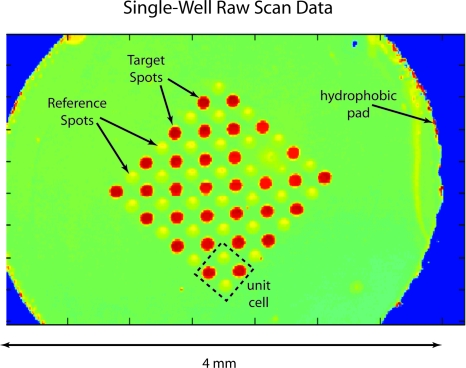
Haptoglobin assays are the gold standard for BioCD applications to generate standard curves to test the precision and detection limits of interferometric detection. In a typical standard-curve experiment, ten concentrations are chosen, distributed across nine wells each on a 96-well BioCD. The disks are incubated for 1 h in phosphate buffered saline with Tween (PBST) and then washed, dried, and scanned. An example from a well at 300 ng∕ml is shown after incubation in Fig. 24. There are 64 spots (16 unit cells) composed of a total of 32 IgG target spots immobilized on the fusion protein A∕G and 32 IgY reference spots. The disk is prepared by saturating the protein A∕G with the target antibody. The A∕G binds the Fc portion of the IgG antibody. Each well is then incubated with a different concentration of antigen.
Figure 24.
Interferometric postscan of a well incubated with 300 ng/ml of human haptoglobin. The strong target spot response is seen relative to the reference spots.
The capture response for the concentration ladder is shown in Fig. 25. The baseline is set by the zero-concentration results. The error bars are the standard deviation of the nine wells at each concentration. The smooth curve is a “stretched” Langmuir function
| (31) |
A stretch of e=1 corresponds to the usual Langmuir function. In these data, the stretch is e=0.65, which stretches the response over a broader range of concentrations. The LOD for a single-well assay is LOD=1 ng∕ml, and the effective equilibrium constant is kD=180 ng∕ml.
Figure 25.
Standard curve for a haptoglobin assay development kit. The wells have unit cells composed of protein A∕G that bind specific antibodies and nonspecific IgY antibodies.
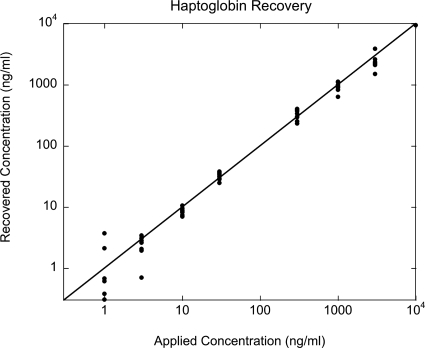
Concentration recovery is performed from the standard curve using the nine wells per concentration. The measured height increase of each well is measured, projected horizontally onto the graph of the standard curve, and then projected down to the recovered concentration. The recovered concentrations are plotted in Fig. 26 as a function of the original concentration spiked into the liquid sample. The precision is approximately 20% (known as 80% recovery) over a dynamic range of about 300:1 with a limit of quantitation at approximately 3 ng∕ml for a single well. Better sensitivities can be obtained by using more than one well per assay.
Figure 26.
Concentration recovery performed on the standard curve in Fig. 27. The recovered concentration is plotted against the known concentration.
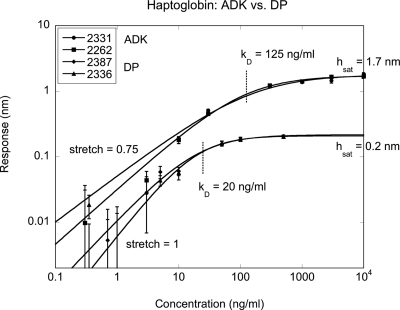
One key question that was addressed by haptoglobin gold-standard experiments was the effectiveness of antibodies that were immobilized onto protein A∕G relative to antibodies that were printed directly onto the butyraldehyde-functionalized surface of the BioCD. The results are shown in Fig. 27 on a log-log plot for two disks under each condition. Each condition shows excellent repeatability. However, the directly printed antibodies had a biological activity of only 0.2∕1.7=12%. This low activity is likely caused by misoriented antibodies on the surface. In contrast, the protein A∕G shows essentially 100% biological activity. Both cases experienced dry-down, which could denature the immobilized antibodies.
Figure 27.
Comparison of two A∕G immobilization disks against two direct-printed antibody disks. The antibody activity on the protein A∕G is nearly 100% and highly repeatable with a kD near 120 ng∕ml. The direct print shows lower activity around 12% but with a lower kD near 20 ng∕ml.
PSA
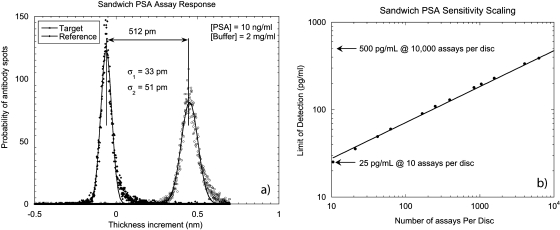
Prostate cancer (PCa) accounts for 10% of all deaths from cancer.170 A major focus of PCa research has been the early detection of PCa using serum biomarkers.171 The most commonly used biomarker for PCa is PSA, a member of the kallikrein family. PSA in seminal fluid has a concentration of 0.5–2.0 mg∕ml.172, 173 Because of the relatively high levels of PSA in normal male blood (2 ng∕ml) and the high elevation in PCa above normal in patient samples (above 1000 ng∕ml), PSA was a good target for the first tests of the BioCD on a clinically relevant target. In the first experiments, a BioCD with 25 000 antibody spots against PSA was printed and incubated using a global incubation on an orbital shaker for 3 h with a concentration of 10 ng∕ml in PBST buffer,143 followed by a second antibody at a concentration of 10 μg∕ml to form an antibody-antigen-antibody sandwich. The histogram of the spot height increment for 25 000 spots after the sandwich assay is shown in Fig. 28a. The average surface height increment of the target spots was 0.5 nm with a standard deviation of approximately 50 pm (10%). The scaling of the detection limit is shown in Fig. 28b as a function of the number of target spots that are used per assay. For 32 target spots the detection limit is 250 pg∕ml, which is well below the normal concentration of PSA. By averaging over more spots, lower detection limits are achievable.
Figure 28.
(a) The histogram of thickness increments of 25 000 spots incubated at 10 ng∕ml after secondary antibody incubation. Based on the mean values and standard deviations of the distributions, the detection limit of one pair of antibody and reference spots is estimated to be 1.69 ng∕ml in 2 mg∕ml background concentration. (b) The scaling PSA detection limits of the sandwich assay are shown. The scaling detection limit is fit by a power law with an exponent −0.44. A 20 pg∕ml detection limit for the PSA sandwich assay is achieved based on 11 520 antibody spots or 250 pg∕ml based on 45 spots.
A challenge for interferometric detection on the BioCD is the background protein load in serum. Interferometry detects all bound mass, whether specific or nonspecific. Despite the use of reference spots and the unit cell spot layout for nonspecific binding subtraction, it is not possible to have a perfect balance of binding between the target and the reference spots. Nevertheless, experiments with PSA spiked into serum did not differ markedly from PSA spiked into serum. Even for a relatively light dilution of 3:1, the interferometric response curve is similar to the standard curve in buffer.143 The kD values were at around 30 ng∕ml, with a LOD of around 1 ng∕ml for all cases.
The results of the first clinically relevant immunoassay in human patient samples are shown in Fig. 29. The standard curve in a background 4:1 dilution of serum is shown in Fig. 29a. The KD for the dilution curve was 16 ng∕ml. The results of dilution experiments on three different patient samples are shown in Fig. 29b. The recovered concentrations for the three patient samples were 30, 50, and 5000 ng∕ml. These concentrations were within a factor of two of values measured by ELISA on these same samples. The detection of total PSA may not be as indicative of PCa as is the ratio of free PSA to total PSA, and future experiments will develop multiplexed assays with antibodies that can detect free PSA separately from total. In addition, the velocity of PSA increase over time may be a better indicator, especially in men in the range from 1.5 to 4 ng∕ml. High-sensitivity assays that have detection limits below 1 ng∕ml in serum are an important direction for the PSA BioCD.
Figure 29.
Concentration recovery of PSA concentrations for three patient samples. The standard curve in serum is on the left, and the dilution curves for the three patients are on the right. The recovered concentrations are 30, 50, and 5000 ng∕ml.
ACKNOWLEDGMENTS
This work was supported in part by Quadraspec, Inc., the Indiana Economic Development Corporation, and NIH NCI Grant No. R21CA125336.
References
- Dupuy A. M., Lehmann S., and Cristol J. P., Clin. Chem. Lab. Med. 43, 1291 (2005). 10.1515/CCLM.2005.223 [DOI] [PubMed] [Google Scholar]
- Fung E. T., Thulasiraman V., Weinberger S. R., and Dalmasso E. A., Curr. Opin. Biotechnol. 12, 65 (2001). 10.1016/S0958-1669(00)00167-1 [DOI] [PubMed] [Google Scholar]
- Jain K. K., Curr. Opin. Drug Discovery Dev. 7, 285 (2004). [PubMed] [Google Scholar]
- Lueking A., Cahill D. J., and Mullner S., Drug Discovery Today 10, 789 (2005). 10.1016/S1359-6446(05)03449-5 [DOI] [PubMed] [Google Scholar]
- Vo-Dinh T. and Cullum B., Fresenius’ J. Anal. Chem. 366, 540 (2000). 10.1007/s002160051549 [DOI] [PubMed] [Google Scholar]
- Immink K. A. S., J. Audio Eng. Soc. 46, 458 (1998). [Google Scholar]
- Pohlmann K. C., The Compact Disc Handbook, 2nd ed. (A-R Editions, Madison, WI, 1992). [Google Scholar]
- McCreedy T., TrAC, Trends Anal. Chem. 19, 396 (2000). 10.1016/S0165-9936(99)00176-4 [DOI] [Google Scholar]
- Auroux P. A., Iossifidis D., Reyes D. R., and Manz A., Anal. Chem. 74, 2637 (2002). 10.1021/ac020239t [DOI] [PubMed] [Google Scholar]
- Huikko K., Kostiainen R., and Kotiaho T., Eur. J. Pharm. Sci. 20, 149 (2003). 10.1016/S0928-0987(03)00147-7 [DOI] [PubMed] [Google Scholar]
- Zourob M., Mohr S., Fielden P. R., and Goddard N. J., Sens. Actuators B 94, 304 (2003). 10.1016/S0925-4005(03)00460-X [DOI] [Google Scholar]
- Srinivas P. R., Verma M., Zhao Y. M., and Srivastava S., Clin. Chem. 48, 1160 (2002). [PubMed] [Google Scholar]
- Jensen O. N., Nat. Rev. Mol. Cell Biol. 7, 391 (2006). 10.1038/nrm1939 [DOI] [PubMed] [Google Scholar]
- Figeys D. and Pinto D., Electrophoresis 22, 208 (2001). [DOI] [PubMed] [Google Scholar]
- Hanash S., Nature (London) 422, 226 (2003). 10.1038/nature01514 [DOI] [PubMed] [Google Scholar]
- Phizicky E., Bastiaens P. I. H., Zhu H., Snyder M., and Fields S., Nature (London) 422, 208 (2003). 10.1038/nature01512 [DOI] [PubMed] [Google Scholar]
- Rual J. F., Venkatesan K., Hao T., Hirozane-Kishikawa T., Dricot A., Li N., Berriz G. F., Gibbons F. D., Dreze M., Ayivi-Guedehoussou N., Klitgord N., Simon C., Boxem M., Milstein S., Rosenberg J., Goldberg D. S., Zhang L. V., Wong S. L., Franklin G., Li S. M., Albala J. S., Lim J. H., Fraughton C., Llamosas E., Cevik S., Bex C., Lamesch P., Sikorski R. S., Vandenhaute J., Zoghbi H. Y., Smolyar A., Bosak S., Sequerra R., Doucette-Stamm L., Cusick M. E., Hill D. E., Roth F. P., and Vidal M., Nature (London) 437, 1173 (2005). 10.1038/nature04209 [DOI] [PubMed] [Google Scholar]
- Anderson N. L. and Anderson N. G., Mol. Cell. Proteomics 1, 845 (2002). 10.1074/mcp.R200007-MCP200 [DOI] [PubMed] [Google Scholar]
- Collings A. F. and Caruso F., Rep. Prog. Phys. 60, 1397 (1997). 10.1088/0034-4885/60/11/005 [DOI] [Google Scholar]
- Nielsen U. B. and Geierstanger B. H., J. Immunol. Methods 290, 107 (2004). 10.1016/j.jim.2004.04.012 [DOI] [PubMed] [Google Scholar]
- Kingsmore S. F., Nat. Rev. Drug Discovery 5, 310 (2006). 10.1038/nrd2006 [DOI] [PMC free article] [PubMed] [Google Scholar]
- Nolte D. D. and Regnier F. E., Opt. Photonics News 15, 48 (2004). 10.1364/OPN.15.10.000048 [DOI] [Google Scholar]
- Varma M. M., Nolte D. D., Inerowicz H. D., and Regnier F. E., Opt. Lett. 29, 950 (2004). 10.1364/OL.29.000950 [DOI] [PubMed] [Google Scholar]
- Wang X., Zhao M., and Nolte D. D., Appl. Opt. 46, 7836 (2007). 10.1364/AO.46.007836 [DOI] [PubMed] [Google Scholar]
- Graham J., Biological Centrifugation (Garland Science, London, 2001). [Google Scholar]
- Madou M., Zoval J., Jia G. Y., Kido H., Kim J., and Kim N., Annu. Rev. Biomed. Eng. 8, 601 (2006). 10.1146/annurev.bioeng.8.061505.095758 [DOI] [PubMed] [Google Scholar]
- Ducree J., Haeberle S., Lutz S., Pausch S., von Stetten F., and Zengerle R., J. Micromech. Microeng. 17, S103 (2007). 10.1088/0960-1317/17/7/S07 [DOI] [Google Scholar]
- Haeberle S. and Zengerle R., Lab Chip 7, 1094 (2007). 10.1039/b706364b [DOI] [PubMed] [Google Scholar]
- Squires T. M. and Quake S. R., Rev. Mod. Phys. 77, 977 (2005). 10.1103/RevModPhys.77.977 [DOI] [Google Scholar]
- Stone H. A., Stroock A. D., and Ajdari A., Annu. Rev. Fluid Mech. 36, 381 (2004). 10.1146/annurev.fluid.36.050802.122124 [DOI] [Google Scholar]
- Varma M., Nolte D. D., Inerowicz H. D., and Regnier F. E., in Biomedical Nanotechnology Architectures and Applications, edited by Bornhop B. J., Dunn D. A., Mariella R. P., Murphy C. J., Nicolau D. V., Nie S., Palmer M. , and Raghavachari R. J., Proceedings of the Society of Photo-Optical Instrumentation Engineers (SPIE, Bellingham, WA, 2002), Vol. 4626, pp. 69–77.
- Alexandre I., Houbion Y., Collet J., Hamels S. Demarteau J., Gala J. L., and Remacle J., BioTechniques 33, 435 (2002). [DOI] [PubMed] [Google Scholar]
- La Clair J. J. and Burkart M. D., Org. Biomol. Chem. 1, 3244 (2003). 10.1039/b306391g [DOI] [PubMed] [Google Scholar]
- Madou M. J. and Kellogg G. J., in Systems and Technologies for Clinical Diagnostics and Drug Discovery, edited by Cohn G. E. and Katzir A. (SPIE, San Jose, 1998), Vol. 3259, pp. 80–93. [Google Scholar]
- Duffy D., Gills H., Lin J., Sheppard N., and Kellogg G., Anal. Chem. 71, 4669 (1999). 10.1021/ac990682c [DOI] [Google Scholar]
- Kim D. S. and Kwon T. H., Microfluid. Nanofluid. 2, 125 (2006). 10.1007/s10404-005-0053-8 [DOI] [Google Scholar]
- Brenner T., Glatzel T., Zengerle R., and Ducree J., Lab Chip 5, 146 (2005). 10.1039/b406699e [DOI] [PubMed] [Google Scholar]
- Schembri C. T., Burd T. L., Kopfsill A. R., Shea L. R., and Braynin B., J. Autom. Chem. 17, 99 (1995). [DOI] [PMC free article] [PubMed] [Google Scholar]
- Haeberle S., Zengerle R., and Ducree J., Microfluid. Nanofluid. 3, 65 (2007). 10.1007/s10404-006-0106-7 [DOI] [Google Scholar]
- Wang G. J., Hsu W. H., Chang Y. Z., and Yang H. H., Biomed. Microdevices 6, 47 (2004). 10.1023/B:BMMD.0000013365.99619.36 [DOI] [PubMed] [Google Scholar]
- Peytavi R., Raymond F. R., Gagne D., Picard F. J., Jia G., Zoval J., Madou M., Boissinot K., Boissinot M., Bissonnette L., Ouellette M., and Bergeron M. G., Clin. Chem. 51, 1836 (2005). 10.1373/clinchem.2005.052845 [DOI] [PubMed] [Google Scholar]
- Cho Y. K., Lee J. G., Park J. M., Lee B. S., Lee Y., and Ko C., Lab Chip 7, 565 (2007). 10.1039/b616115d [DOI] [PubMed] [Google Scholar]
- Haeberle S., Schmitt N., Zengerle R., and Ducree J., Sens. Actuators, A 135, 28 (2007). 10.1016/j.sna.2006.09.001 [DOI] [Google Scholar]
- Kim J., Kido H., Rangel R. H., and Madou M. J., Sens. Actuators B 128, 613 (2008). 10.1016/j.snb.2007.07.079 [DOI] [Google Scholar]
- Ducree J., Haeberle S., Brenner T., Glatzel T., and Zengerle R., Microfluid. Nanofluid. 2, 97 (2006). 10.1007/s10404-005-0049-4 [DOI] [Google Scholar]
- Bynum M. A. and Gordon G. B., Anal. Chem. 76, 7039 (2004). 10.1021/ac048840+ [DOI] [PubMed] [Google Scholar]
- Grumann M., Geipel A., Riegger L., Zengerle R., and Ducree J., Lab Chip 5, 560 (2005). 10.1039/b418253g [DOI] [PubMed] [Google Scholar]
- Li C. Y., Dong X. L., Qin J. H., and Lin B. C., Anal. Chim. Acta 640, 93 (2009). 10.1016/j.aca.2009.03.026 [DOI] [PubMed] [Google Scholar]
- Ducree J., Brenner T., Haeberle S., Glatzel T., and Zengerle R., Microfluid. Nanofluid. 2, 78 (2006). 10.1007/s10404-005-0056-5 [DOI] [Google Scholar]
- Moschou E. A., Nicholson A. D., Jia G. Y., Zoval J. V., Madou M. J., Bachas L. G., and Daunert S., Anal. Bioanal. Chem. 385, 596 (2006). 10.1007/s00216-006-0436-z [DOI] [PubMed] [Google Scholar]
- Haeberle S., Brenner T., Zengerle R., and Ducree J., Lab Chip 6, 776 (2006). 10.1039/b604145k [DOI] [PubMed] [Google Scholar]
- Kim J., Jang S. H., Jia G. Y., Zoval J. V., Da Silva N. A., and Madou M. J., Lab Chip 4, 516 (2004). 10.1039/b401106f [DOI] [PubMed] [Google Scholar]
- Kido H., Micic M., Smith D., Zoval J., Norton J., and Madou M., Colloids Surf., B 58, 44 (2007). 10.1016/j.colsurfb.2007.03.015 [DOI] [PubMed] [Google Scholar]
- Kim N., Dempsey C. M., Zoval J. V., Sze J. Y., and Madou M. J., Sens. Actuators B 122, 511 (2007). 10.1016/j.snb.2006.06.026 [DOI] [Google Scholar]
- Lee S. K., Yi G. R., and Yang S. M., Lab Chip 6, 1171 (2006). 10.1039/b606448e [DOI] [PubMed] [Google Scholar]
- Whitesides G. M., Ostuni E., Takayama S., Jiang X. Y., and Ingber D. E., Annu. Rev. Biomed. Eng. 3, 335 (2001). 10.1146/annurev.bioeng.3.1.335 [DOI] [PubMed] [Google Scholar]
- Peng L., Varma M., Inerowicz H. D., Regnier F. E., and Nolte D. D., Appl. Phys. Lett. 86, 183902 (2005). 10.1063/1.1915511 [DOI] [Google Scholar]
- Peng X. Y., Li P. C. H., Yu H. Z., Parameswaran M., and Chou W. L., Sens. Actuators B 128, 64 (2007). 10.1016/j.snb.2007.05.038 [DOI] [Google Scholar]
- Chen H., Wang L., and Li P. C. H., Lab Chip 8, 826 (2008). 10.1039/b719846a [DOI] [PubMed] [Google Scholar]
- Gustafsson M., Hirschberg D., Palmberg C., Jornvall H., and Bergman T., Anal. Chem. 76, 345 (2004). 10.1021/ac030194b [DOI] [PubMed] [Google Scholar]
- Najam-ul-Haq M., Rainer M., Huck C. W., Hausberger P., Kraushaar H., and Bonn G. K., Anal. Chem. 80, 7467 (2008). 10.1021/ac801190e [DOI] [PubMed] [Google Scholar]
- Puckett L. G., Dikici E., Lai S., Madou M., Bachas L. G., and Daunert S., Anal. Chem. 76, 7263 (2004). 10.1021/ac049758h [DOI] [PubMed] [Google Scholar]
- Lai S., Wang S. N., Luo J., Lee L. J., Yang S. T., and Madou M. J., Anal. Chem. 76, 1832 (2004). 10.1021/ac0348322 [DOI] [PubMed] [Google Scholar]
- Rothert A., Deo S. K., Millner L., Puckett L. G., Madou M. J., and Daunert S., Anal. Biochem. 342, 11 (2005). 10.1016/j.ab.2004.10.048 [DOI] [PubMed] [Google Scholar]
- Eriksson C., Agaton C., Kange R., Sundberg M., Nilsson P., Ek B., Uhlen M., Gustafsson M., and Hober S., J. Proteome Res. 5, 1568 (2006). 10.1021/pr050447c [DOI] [PubMed] [Google Scholar]
- Riegger L., Grumann M., Nann T., Riegler J., Ehlert O., Bessler W., Mittenbuehler K., Urban G., Pastewka L., Brenner T., Zengerle R., and Ducree J., Sens. Actuators, A 126, 455 (2006). 10.1016/j.sna.2005.11.006 [DOI] [Google Scholar]
- Steigert J., Grumann M., Brenner T., Riegger L., Harter J., Zengerle R., and Ducree J., Lab Chip 6, 1040 (2006). 10.1039/b607051p [DOI] [PubMed] [Google Scholar]
- Watts A. S., Urbas A. A., Moschou E., Gavalas V. G., Zoval J. V., Madou M., and Bachas L. G., Anal. Chem. 79, 8046 (2007). 10.1021/ac0709100 [DOI] [PubMed] [Google Scholar]
- Carion O., Souplet V., Olivier C., Maillet C., Meclard N., El-Mahdi O., Durand J. O., and Melnyk O., ChemBioChem 8, 315 (2007). 10.1002/cbic.200600504 [DOI] [PubMed] [Google Scholar]
- Steigert J., Grumann M., Dube M., Streule W., Riegger L., Brenner T., Koltay P., Mittmann K., Zengerle R., and Ducree J., Sens. Actuators, A 130, 228 (2006). 10.1016/j.sna.2006.01.031 [DOI] [Google Scholar]
- Honda N., Lindberg U., Andersson P., Hoffman S., and Takei H., Clin. Chem. 51, 1955 (2005). 10.1373/clinchem.2005.053348 [DOI] [PubMed] [Google Scholar]
- Jia G. Y., Ma K. S., Kim J., Zoval J. V., Peytavi R., Bergeron M. G., and Madou M. J., Sens. Actuators B Chem. 114, 173 (2006). 10.1016/j.snb.2005.04.043 [DOI] [Google Scholar]
- Kido H., Maquieira A., and Hammock B. D., Anal. Chim. Acta 411, 1 (2000). 10.1016/S0003-2670(00)00776-5 [DOI] [Google Scholar]
- Yu H. Z., Chem. Commun. (Cambridge) 2004, 2633. [DOI] [PubMed] [Google Scholar]
- Ko K. S., Najmabadi P., La Clair J. J., and Burkart M. D., ChemBioChem 9, 201 (2008). 10.1002/cbic.200700468 [DOI] [PubMed] [Google Scholar]
- Banuls M. J., Gonzaalez-Pedro V., Puchades R., and Maquieira A., Bioconjugate Chem. 18, 1408 (2007). 10.1021/bc700194n [DOI] [PubMed] [Google Scholar]
- Li Y. C., Wang Z., Ou L. M. L., and Yu H. Z., Anal. Chem. 79, 426 (2007). 10.1021/ac061134j [DOI] [PubMed] [Google Scholar]
- Tamarit-Lopez J., Morais S., Puchades R., and Maquieira A., Anal. Chim. Acta 609, 120 (2008). 10.1016/j.aca.2007.12.028 [DOI] [PubMed] [Google Scholar]
- Banuls M. J., Garcia-Pinon F., Puchades R., and Maquieira A., Bioconjugate Chem. 19, 665 (2008). 10.1021/bc7003457 [DOI] [PubMed] [Google Scholar]
- Morais S., Tamarit-Lopez J., Carrascosa J., Puchades R., and Maquieira A., Anal. Bioanal. Chem. 391, 2837 (2008). 10.1007/s00216-008-2224-4 [DOI] [PubMed] [Google Scholar]
- Li Y. C., Ou L. M. L., and Yu H. Z., Anal. Chem. 80, 8216 (2008). 10.1021/ac8012434 [DOI] [PubMed] [Google Scholar]
- Lange S. A., Roth G., Wittermann S., Lacoste T., Vetter A., Grassle J., Kopta S., Kolleck M., Breitinger B., Wick M., and Horber J. K. H., Angew. Chem., Int. Ed. 45, 270 (2006). 10.1002/anie.200501243 [DOI] [PubMed] [Google Scholar]
- Ligler F. S. and Erickson J. S., Nature (London) 440, 159 (2006). 10.1038/440159a [DOI] [PubMed] [Google Scholar]
- Morais S., Carrascosa J., Mira D., Puchades R., and Maquieira A., Anal. Chem. 79, 7628 (2007). 10.1021/ac070328b [DOI] [PubMed] [Google Scholar]
- Erickson J. S. and Ligler F. S., Nature (London) 456, 178 (2008). 10.1038/456178a [DOI] [PubMed] [Google Scholar]
- Potyrailo R. A., Morris W. G., Leach A. M., Hassib L., Krishnan K., Surman C., Wroczynski R., Boyette S., Xiao C., Shrikhande P., Agree A., and Cecconie T., Appl. Opt. 46, 7007 (2007). 10.1364/AO.46.007007 [DOI] [PubMed] [Google Scholar]
- Potyrailo R. A., Morris W. G., Leach A. M., Sivavec T. M., Wisnudel M. B., and Boyette S., Anal. Chem. 78, 5893 (2006). 10.1021/ac060684e [DOI] [PubMed] [Google Scholar]
- Ekins R. and Chu F. W., Clin. Chem. 37, 1955 (1991). [PubMed] [Google Scholar]
- Morais S., Marco-Moles R., Puchades R., and Maquieira A., Chem. Commun. (Cambridge) 22, 2368 (2006). 10.1039/b600049e [DOI] [PubMed] [Google Scholar]
- Kim J., Liu G. L., and Lee L. P., Opt. Express 13, 4780 (2005). 10.1364/OPEX.13.004780 [DOI] [PubMed] [Google Scholar]
- Choi D., Kang T., Cho H., Choi Y., and Lee L. P., Lab Chip 9, 239 (2009). 10.1039/b812067f [DOI] [PubMed] [Google Scholar]
- Fan X. D., White I. M., Shopoua S. I., Zhu H. Y., Suter J. D., and Sun Y. Z., Anal. Chim. Acta 620, 8 (2008). 10.1016/j.aca.2008.05.022 [DOI] [PMC free article] [PubMed] [Google Scholar]
- Ramsden J. J., J. Mol. Recognit. 10, 109 (1997). [DOI] [PubMed] [Google Scholar]
- Bally M., Halter M., Voros J., and Grandin H. M., Surf. Interface Anal. 38, 1442 (2006). 10.1002/sia.2375 [DOI] [Google Scholar]
- Gauglitz G., Anal. Bioanal. Chem. 381, 141 (2005). 10.1007/s00216-004-2895-4 [DOI] [PubMed] [Google Scholar]
- Heideman R. G., Kooyman R. P. H., and Greve J., Sens. Actuators B 10, 209 (1993). 10.1016/0925-4005(93)87008-D [DOI] [Google Scholar]
- Brandenburg A. and Henninger R., Appl. Opt. 33, 5941 (1994). 10.1364/AO.33.005941 [DOI] [PubMed] [Google Scholar]
- Sepulveda B., del Rio J. S., Moreno M., Blanco F. J., Mayora K., Dominguez C., and Lechuga L. M., J. Opt. A, Pure Appl. Opt. 8, S561 (2006). 10.1088/1464-4258/8/7/S41 [DOI] [Google Scholar]
- Cross G. H., Reeves A., Brand S., Swann M. J., Peel L. L., Freeman N. J., and Lu J. R., J. Phys. D: Appl. Phys. 37, 74 (2004). 10.1088/0022-3727/37/1/012 [DOI] [Google Scholar]
- Jenison R., La H., Haeberli A., Ostroff R., and Polisky B., Clin. Chem. 47, 1894 (2001). [PubMed] [Google Scholar]
- Cunningham B., Li P., and Pepper J., Sens. Actuators B 81, 316 (2002). 10.1016/S0925-4005(01)00976-5 [DOI] [Google Scholar]
- Gauglitz G., Rev. Sci. Instrum. 76, 062224 (2005). 10.1063/1.1906164 [DOI] [Google Scholar]
- Zhao M., Wang X. F., Lawrence G. M., Espinoza P., and Nolte D. D., IEEE J. Sel. Top. Quantum Electron. 13, 1680 (2007). 10.1109/JSTQE.2007.911002 [DOI] [Google Scholar]
- Zhao M., Wang X., and Nolte D. D., Opt. Express 16, 7102 (2008). 10.1364/OE.16.007102 [DOI] [PubMed] [Google Scholar]
- Ozkumur E., Needham J. W., Bergstein D. A., Gonzalez R., Cabodi M., Gershoni J. M., Goldberg B. B., and Unlu M. S., Proc. Natl. Acad. Sci. U.S.A. 105, 7988 (2008). 10.1073/pnas.0711421105 [DOI] [PMC free article] [PubMed] [Google Scholar]
- Ince R. and Narayanaswamy R., Anal. Chim. Acta 569, 1 (2006). 10.1016/j.aca.2006.03.058 [DOI] [Google Scholar]
- Hanel C. and Gauglitz G., Anal. Bioanal. Chem. 372, 91 (2002). 10.1007/s00216-001-1197-3 [DOI] [PubMed] [Google Scholar]
- van de Hulst H. C., Light Scattering by Small Particles (Dover, Mineola, NY, 1981). [Google Scholar]
- Hecht E., Optics, 4th ed. (Addison-Wesley, San Franciso, CA, 2002). [Google Scholar]
- Jackson J. D., Classical Electrodynamics (Wiley, NY, 1998). [Google Scholar]
- Heavens O. S., Optical Properties of Thin Solid Films (Dover, Mineola, NY, 1991). [Google Scholar]
- Jin G., Tengvall P., Lundstrom I., and Arwin H., Anal. Biochem. 232, 69 (1995). 10.1006/abio.1995.9959 [DOI] [PubMed] [Google Scholar]
- Jin G., Jansson R., and Arwin H., Rev. Sci. Instrum. 67, 2930 (1996). 10.1063/1.1147074 [DOI] [Google Scholar]
- Arwin H., Thin Solid Films 377, 48 (2000). 10.1016/S0040-6090(00)01385-7 [DOI] [Google Scholar]
- Poksinski M. and Arwin H., Opt. Lett. 32, 1308 (2007). 10.1364/OL.32.001308 [DOI] [PubMed] [Google Scholar]
- Poksinski M. and Arwin H., Thin Solid Films 455, 716 (2004). 10.1016/j.tsf.2004.01.037 [DOI] [Google Scholar]
- Wang G. L., Arwin H., and Jansson R., Appl. Opt. 43, 2000 (2004). 10.1364/AO.43.002000 [DOI] [PubMed] [Google Scholar]
- Voros J., Ramsden J. J., Csucs G., Szendro I., De Paul S. M., Textor M., and Spencer N. D., Biomaterials 23, 3699 (2002). 10.1016/S0142-9612(02)00103-5 [DOI] [PubMed] [Google Scholar]
- Voros J., Biophys. J. 87, 553 (2004). 10.1529/biophysj.103.030072 [DOI] [PMC free article] [PubMed] [Google Scholar]
- Balmer T. E. and Heuberger M., Rev. Sci. Instrum. 78, 093105 (2007). 10.1063/1.2777369 [DOI] [PubMed] [Google Scholar]
- Heuberger M. and Balmer T. E., J. Phys. D: Appl. Phys. 40, 7245 (2007). 10.1088/0022-3727/40/23/S07 [DOI] [Google Scholar]
- Wang X. F., Chen Y. P., and Nolte D. D., Opt. Express 16, 22105 (2008). 10.1364/OE.16.022105 [DOI] [PubMed] [Google Scholar]
- Wang X., Zhao M., and Nolte D. D., Appl. Opt. 47, 2779 (2008). 10.1364/AO.47.002779 [DOI] [PubMed] [Google Scholar]
- Varma M. M., Inerowicz H. D., Regnier F. E., and Nolte D. D., Biosens. Bioelectron. 19, 1371 (2004). 10.1016/j.bios.2003.12.033 [DOI] [PubMed] [Google Scholar]
- Zhao M., Cho W., Regnier F., and Nolte D., Appl. Opt. 46, 6196 (2007). 10.1364/AO.46.006196 [DOI] [PubMed] [Google Scholar]
- Zhao M., Wang X. F., and Nolte D., in Proceedings of the Society of Photo-Optical Instrumentation, edited by Cartwright A. N. and Nicolau D. V. (SPIE, Bellingham, WA, 2007), Vol. 6447, p. B4470.
- Peng L., Varma M. M., Cho W., Regnier F. E., and Nolte D. D., Appl. Opt. 46, 5384 (2007). 10.1364/AO.46.005384 [DOI] [PubMed] [Google Scholar]
- Hariharan P., Optical Interferometry (Elsevier, Amsterdam, 2003). [Google Scholar]
- Zhao M., Nolte D. D., Cho W. R., Regnier F., Varma M., Lawrence G., and Pasqua J., J. Clin. Chem. 52, 2135 (2006). 10.1373/clinchem.2006.072793 [DOI] [PubMed] [Google Scholar]
- Atkinson M. R., Dixon A. E., and Damaskinos S., Appl. Opt. 31, 6765 (1992). 10.1364/AO.31.006765 [DOI] [PubMed] [Google Scholar]
- Chien C., Chung-Wei L., and Li-Cheng P., Appl. Opt. 40, 95 (2001). 10.1364/AO.40.000095 [DOI] [PubMed] [Google Scholar]
- Chien C., Jenn-Chyang S., Yeu-Chuen H., and Chen-Kee Y., Appl. Opt. 37, 4137 (1998). 10.1364/AO.37.004137 [DOI] [PubMed] [Google Scholar]
- See C. W., Appel R. K., and Somekh M. G., Appl. Phys. Lett. 53, 10 (1988). 10.1063/1.100118 [DOI] [Google Scholar]
- See C. W., Iravani M. V., and Wickramasinghe H. K., Appl. Opt. 24, 2373 (1985). 10.1364/AO.24.002373 [DOI] [PubMed] [Google Scholar]
- See C. W. and Vaez-Iravani M., Appl. Opt. 27, 2786 (1988). 10.1364/AO.27.002786 [DOI] [PubMed] [Google Scholar]
- Somekh M. G., Valera M. S., and Appel R. K., Appl. Opt. 34, 4857 (1995). 10.1364/AO.34.004857 [DOI] [PubMed] [Google Scholar]
- Komatsu S., Suhara H., and Ohzu H., Appl. Opt. 29, 4244 (1990). 10.1364/AO.29.004244 [DOI] [PubMed] [Google Scholar]
- Suddendorf M. B., Somekh M. G., and See C. W., Appl. Opt. 36, 6202 (1997). 10.1364/AO.36.006202 [DOI] [PubMed] [Google Scholar]
- Zhao M., Peng L., and Nolte D. D., Phase-Contrast Biological Compact Disc for Molecular Recognition (SPIE, Bellingham, WA, 2005). [Google Scholar]
- Zhao M., Peng L. L., Cho W., Regnier F., and Nolte D. D., Proceedings of the Society of Photo-Optical Instrumentation Engineers (SPIE, Bellingham, WA, 2006), Vol. 6095, pp. L950.
- Ostroff R. M., Hopkins D., Haeberli A. B., Baouchi W., and Polisky B., Clin. Chem. 45, 1659 (1999). [PubMed] [Google Scholar]
- Jenison R., Yang S., Haeberli A., and Polisky B., Nat. Biotechnol. 19, 62 (2001). 10.1038/83530 [DOI] [PubMed] [Google Scholar]
- Wang X. F., Zhao M., and Nolte D. D., Anal. Bioanal. Chem. 393, 1151 (2009). 10.1007/s00216-008-2370-8 [DOI] [PubMed] [Google Scholar]
- Wang X. F., Zhao M., and Nolte D. D., Appl. Phys. Lett. 93, 223904 (2008). 10.1063/1.3040303 [DOI] [Google Scholar]
- Wang X. F.,o Zhao M., and Nolte D. D., Biosens. Bioelectron. 24, 981 (2008). 10.1016/j.bios.2008.07.078 [DOI] [PubMed] [Google Scholar]
- Novoselov K. S., Jiang D., Schedin F., Booth T. J., Khotkevich V. V., Morozov S. V., and Geim A. K., Proc. Natl. Acad. Sci. U.S.A. 102, 10451 (2005). 10.1073/pnas.0502848102 [DOI] [PMC free article] [PubMed] [Google Scholar]
- Gopinath S. C. B., Awazu K., Tominaga J., and Kumar P. K. R., ACS Nano 2, 1885 (2008). 10.1021/nn800285p [DOI] [PubMed] [Google Scholar]
- Gopinath S. C. S., Awazu K., Fons P., Tominaga J., and Kumar P. K. R., Anal. Chem. 81, 4963 (2009). 10.1021/ac802757z [DOI] [PubMed] [Google Scholar]
- Varma M., Nolte D. D., Inerowicz H. D., and Regnier F. E., in Microarrays and Combinatorial Technologies for Biomedical Applications: Design, Fabrication, and Analysis, edited by Nicolau D. V. and Raghavachari R. (SPIE, Bellingham, WA, 2003), Vol. 4966, pp. 58–64. [Google Scholar]
- Varma M., “BioCD: Self-referencing interferometer for bioesensing,” Ph.D. thesis, Purdue University, West Lafayette, IN, 2005, p. 114. [Google Scholar]
- Nolte D. D., Photorefractive Effects and Materials (Kluwer, Dordrecht, 1995). [Google Scholar]
- Blouin A. and Monchalin J. -P., Appl. Phys. Lett. 65, 932 (1994). 10.1063/1.112153 [DOI] [Google Scholar]
- Delaye P., Blouin A., Drolet D., Montmorillon L. -A., Roosen G., and Monchalin J. -P., J. Opt. Soc. Am. B 14, 1723 (1997). 10.1364/JOSAB.14.001723 [DOI] [Google Scholar]
- Ing R. K. and Monchalin J. -P., Appl. Phys. Lett. 59, 3233 (1991). 10.1063/1.105742 [DOI] [Google Scholar]
- Honda T., Yamashita T., and Matsumoto H., Jpn. J. Appl. Phys., Part 1 34, 3737 (1995). 10.1143/JJAP.34.3737 [DOI] [Google Scholar]
- Murray T. W., Sui L., Maguluri G., Roy R. A., Nieva A., Blonigen F., and DiMarzio C. A., Opt. Lett. 29, 2509 (2004). 10.1364/OL.29.002509 [DOI] [PubMed] [Google Scholar]
- Nolte D. D., Cubel T., Pyrak-Nolte L. J., and Melloch M. R., J. Opt. Soc. Am. B 18, 195 (2001). 10.1364/JOSAB.18.000195 [DOI] [Google Scholar]
- Nolte D. D., J. Appl. Phys. 85, 6259 (1999). 10.1063/1.370284 [DOI] [Google Scholar]
- Nolte D. D., Olson D. H., Doran G. E., Knox W. H., and Glass A. M., J. Opt. Soc. Am. B 7, 2217 (1990). 10.1364/JOSAB.7.002217 [DOI] [PubMed] [Google Scholar]
- Lahiri I., Pyrak-Nolte L. J., Nolte D. D., Melloch M. R., and Kruger R. A., Appl. Phys. Lett. 73, 1041 (1998). 10.1063/1.122078 [DOI] [Google Scholar]
- Jeong K., Peng L., Turek J. J., Melloch M. R., and Nolte D. D., Appl. Opt. 44, 1798 (2005). 10.1364/AO.44.001798 [DOI] [PubMed] [Google Scholar]
- Jeong K., Turek J. J., and Nolte D. D., Opt. Express 15, 14057 (2007). 10.1364/OE.15.014057 [DOI] [PubMed] [Google Scholar]
- Yu P., Mustata M., French P. M. W., Turek J. J., Melloch M. R., and Nolte D. D., Appl. Phys. Lett. 83, 575 (2003). 10.1063/1.1594830 [DOI] [Google Scholar]
- Yu P., Peng L., Mustata M., Turek J. J., Melloch M. R., and Nolte D. D., Opt. Lett. 29, 68 (2004). 10.1364/OL.29.000068 [DOI] [PubMed] [Google Scholar]
- Ding Y., Nolte D. D., Melloch M. R., and Weiner A. M., IEEE J. Sel. Top. Quantum Electron. 4, 332 (1998). 10.1109/2944.686739 [DOI] [Google Scholar]
- Ding Y., Weiner A. M., Melloch M. R., and Nolte D. D., Appl. Phys. Lett. 75, 3255 (1999). 10.1063/1.125316 [DOI] [Google Scholar]
- Jones R., Nolte D. D., and Melloch M. R., Appl. Phys. Lett. 77, 3692 (2000). 10.1063/1.1329866 [DOI] [Google Scholar]
- Delamarche E., Bernard A., Schmid H., Bietsch A., Michel B., and Biebuyck H., J. Am. Chem. Soc. 120, 500 (1998). 10.1021/ja973071f [DOI] [Google Scholar]
- Nolte D. D. and Zhao M., Proceedings of the Smart Medical and Biomedical Sensor Technology IV, 2006, edited by Cullum B. M. and Carter J. C. (SPIE, Bellingham, WA, 2006), Vol. 6380, pp. U127–U132.
- Ozen H. and Sozen S., Eur. Urol. 5, 495 (2006). 10.1016/j.eursup.2006.02.017 [DOI] [Google Scholar]
- Balk S. P., Ko Y. -J., and Bubley G. J., J. Clin. Oncol. 21, 383 (2003). 10.1200/JCO.2003.02.083 [DOI] [PubMed] [Google Scholar]
- Wang M. C., Papsidero L. D., Kuriyama M., Valenzuela L. A., Murphy G. P., and Chu T. M., Prostate 2, 89 (1981). 10.1002/pros.2990020109 [DOI] [PubMed] [Google Scholar]
- Lovgren J., Valtonen-Andre C., Marsal K., Marsal K., Lilja H.., and Lkundwall A., J. Androl 20, 348 (1999). [PubMed] [Google Scholar]


