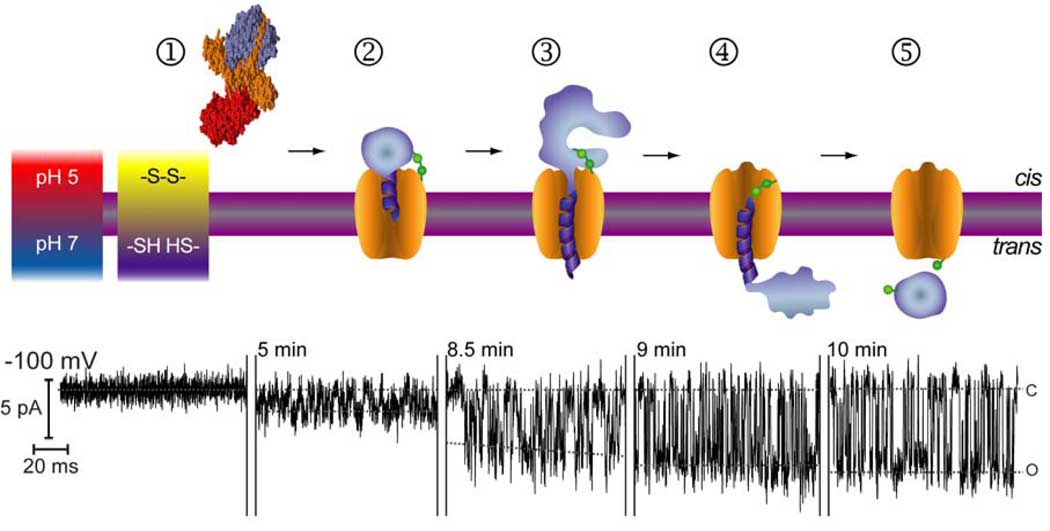
Figure 1.
Sequence of events underlying BoNT LC translocation through the HC channel. ➀ BoNT/A holotoxin prior to insertion in the membrane (grey bar with magenta boundaries); BoNT/A is represented by the crystal structure rendered on YASARA (www.YASARA.org) using Protein Data Bank accession code 3BTA (Lacy et al., 1998). Then, schematic representation of the membrane inserted BoNT/A during an entry event (➁), a series of transfer steps (➂, ➃) and an exit event (➄), under conditions that recapitulate those across endosomes. Segments of a typical record are displayed under the corresponding interpretation for each step. Modified and reproduced with permission from reference (Fischer and Montal, 2007b). Copyright (2007), National Academy of Sciences, U.S.A.

