Abstract
Purpose
To reduce the off-resonance artifact in susceptibility weighted imaging (SWI)-based MR venography (MRV) in the brain regions with severe field inhomogeneity and to reduce the signal loss in the minimum-intensity projection (mIP) display of the 3D MRV.
Materials and Methods
A novel post-processing approach was presented to map the local field gradients (LFGs) using the 3D SWI data without phase-unwrapping. LFG measurements were used to assess the severity of field inhomogeneity and suppress the residual phase in the phase mask induced by the off-resonance effect. Volume segmentation of brain tissue was used to reduce the signal loss in the peripheral regions of the brain in the through-plane mIP images and enable in-plane mIP display of MRV.
Results
Off-resonance artifact in the brain regions with severe field inhomogeneity was effectively reduced by the LFG-based phase suppression approach. Signal loss was reduced in the through-plane mIP of MRV using volume segmentation of brain tissue prior to projection. In-plane mIP of MRV also became feasible with volume segmentation.
Conclusion
Off-resonance artifacts and signal loss in mIP display of MRV can be effectively reduced through post-processing.
Keywords: susceptibility weighted imaging, MR venography, off-resonance artifact, local field gradient, minimum-intensity projection
INTRODUCTION
Susceptibility weighted imaging (SWI)-based MR venougraphy (MRV) uses the difference of magnetic susceptibility between venous blood and background tissue as an intrinsic contrast mechanism for the depiction of venous vasculature (1, 2). Recent studies have demonstrated promising clinical value of SWI in the diagnosis of venous diseases in the brain (3–9). In the SWI-MRV technique, three-dimensional (3D) flow-compensated gradient-echo data are acquired with a relative long echo time (TE) to visualize the venous vasculature in the sub-millimeter regime. Veins parallel to the field have a negative phase relative to the surrounding tissue inside the vessels, and those perpendicular to the field have a positive phase inside the vessels (2, 10). Complex division of the original images and low-pass (LP) filtered images is used to generate high-pass (HP) filtered phase images in which the slow-varying background phase is removed and phase change in the veins is preserved (1,2). A 3D phase mask is constructed by truncating and scaling the phase value in the HP-filtered phase images (2). The veins in the magnitude images also have a negative contrast due to shortened T2* in large veins and out-of-phase partial volume signal cancellation in voxels containing sub-voxel small veins. The magnitude images are multiplied by the phase mask several times to generate SWI with enhanced venous contrast (i.e., vein-to-background contrast). The venous contrast in the resulting SWI is the combination of venous contrast in the magnitude images and phase images. Minimum-intensity projection (mIP) is commonly used for the display of 3D MRV because of the negative venous contrast.
Artifact can arise during the construction of the 3D phase mask in regions with severe field inhomogeneity due to the off-resonance effect. The LP filter is designed to achieve two objectives: removing the phase difference in the veins and preserving the phase variation in the background. After complex division of the original images by the LP-filtered images, the phase difference in the veins is highlighted and the phase variation in the background is removed in the resulting HP-filtered phase images. These two objectives can be well met in most of the brain regions by adequate selection of the filter size. In regions with severe field inhomogeneity, however, the LP filtering does not completely preserve the phase in the background, generating large residual background phase in the HP-filtered phase images and subsequent phase mask. After multiple multiplications of the phase mask with the magnitude images, the residual phase generates dark bands or dark regions in SWI, as referred to off-resonance artifact (11).
Artifact can also arise from the mIP display of the 3D MRV. In conventional mIP implementation, the minimum intensity in voxels along a projection path is selected for the display. Even in through-plane projection, voxels in air and bone can be in the path of projection in the peripheral regions due to the nature shape of the brain. The low intensity in air or bone results in the loss of signal from veins and brain tissue in the mIP images in these regions. For 3D MRV data acquired at a transverse plane, sagittal and coronal projections are often necessary for clinical evaluations. The low intensity in air and bone makes conventional mIP not feasible for in-plane display of MRV.
In this study, we illustrate the effect of the size of LP filter on the severity of the off-resonance artifact in phase mask. We present an approach of using local field gradient (LFG) measurements to assess the severity of field inhomogeneity. We introduce a Fermi weighting function based on the LFG measurements to suppress residual background phase in the phase mask and to reduce the off-resonance artifact in SWI. We employ a volume-segmented mIP (VS-mIP) algorithm to enable in-plane mIP display of MRV and to avoid the signal loss in through-plane mIP in the peripheral regions of the brain.
MATERIALS AND METHODS
Data Acquisition and Image Reconstruction
A transverse 3D spoiled gradient-recalled echo (SPGR) dataset was acquired on a GE 3T scanner (Milwaukee, WI, USA) with a healthy subject using a standard birdcage head coil. Standard consent procedure was complied. The following imaging parameters were used in the scans: field of view (FOV)=26cm×19.5cm, 1.0 mm slice thickness, 512×384×64 matrix, full echo acquisition, readout bandwidth=±31.3 kHz, and TE/TR/α=20ms/34ms/20°(12). The scan time was 14 minutes. Flow compensation was applied along the readout direction to reduce the phase variation caused by blood flow. The 3D complex SWI data were reconstructed using MATLAB (TheMathWorks, Inc., Natick, MA, USA). Zero-filled interpolation was applied along the slice direction to generate a 3D dataset of 512×384×128. The apparent voxel dimension after the interpolation was 0.51×0.51× 0.5mm3, which is nearly isotropic. Four slices at the top and bottom of the 3D dataset were removed to reduce the wrap-around artifact, resulting in a total number of 120 slices.
LP Filtering and Construction of Phase Mask
A symmetric 2D Hamming window, with a size Wx along the readout direction and Wy along the phase-encoding direction, was applied to the 2D k-space data from each slice to generate the LP-filtered images (12). HP-filtered phase images were obtained by complex division of the original images and the LP-filtered images. A phase mask was constructed from the HP-filtered phase images using a standard procedure (2).
3D Mapping of LFG
Veins in regions with severe field inhomogeneity are obscured in SWI because of the large residual background phase in phase mask. These veins are, however, expected to be conspicuous in the magnitude images.. In this study, we use LFG, the first order spatial variation of the static magnetic field, to assess the severity of field inhomogeneity. A previous study has demonstrated the feasibility of direct 3D LFG mapping using two SPGR datasets acquired at different echo times (TEs) without phase unwrapping (13). We have extended this technique for 3D LFG mapping, as described below, using only one SPGR dataset in this study.
The spatial variation of phase, δφs,u, caused by the LFG along a direction, u, in the complex MR signal, A(r), can be calculated by: , where r is the spatial location, φ is the phase, , A(r) = |A(r)|, and Δu is the voxel size along the direction u (u=x, y, or z). The LFG along u at location r can be calculated by: , where γ is the gyromagnetic ratio and arg indicates an operation to take the polar angle of a complex number. A median filter is applied to LFGx(r), LFGy(r), and LFGz(r) to reduce the effect of rapid phase change that may occur in vessels and other fine structures. The median filter with a kernel of 27 evenly-spaced points in a cube of 3×3×3, 5×5×5, and 7×7×7 voxels was applied to the 512×384×120 dataset, respectively. The amplitude of the LFG is given by:
| [1] |
LFG-Suppressed Phase Mask
The LFG-suppressed phase images are generated by multiplying the HP-filtered phase images with a Fermi weighting function (14) defined by:
| [2] |
where R is the size and W is the transition width of the weighting function. The background phase has a large (positive or negative) value in the HP-filtered phase images in the regions with severe field inhomogeneity. The parameters R and W are selected so that Fermi(LFG) ≪ 1 in regions with a large LFG value and Fermi(LFG) ≈ 1 in regions with relatively homogeneous field. After multiplying with Fermi(LFG), the background phase in the phase images is nearly unchanged in regions with relatively homogeneous field and is reduced to near zero in regions with a large LFG. The resulting phase mask, as referred to LFG-suppressed phase mask, has a value near unity in regions with severe field inhomogeneity. The venous contrast in the magnitude images is preserved in the resulting SWI, as referred to LFG-suppressed SWI or LFG-suppressed MRV, after multiple multiplications of the magnitude images with the LFG-suppressed phase mask.
Retrospective Linear Shimming
A post-processing procedure was applied to the 3D SPGR data to reduce large scale background LFG in the data, since such background LFG can possibly reduce the contrast of the veins in SWI. The phase variation in the 3D image data caused by field inhomogeneity,ΔB(r), is given by:
| [3] |
Residual field gradient, g(r), introduces linear phase change in the 3D image data given by:
| [4] |
This residual spatial linear phase variation appears as background LFG in the LFG maps. Such background LFG can undesirably reduce the Fermi(LFG) value and, therefore, the contrast of veins even in regions of homogeneous field in the final MRV. In this study, the average LFGx value was measured in a large rectangular region in the middle parietal of the brain where the B0 field is known to be relatively uniform. The LFGx map of the entire brain in the slab is then subtracted by the measured average LFGx value. The same procedure was repeated for the LFGy and LFGz maps. This procedure compensates the effect of residual field gradient in the 3D image data and is referred as retrospective linear shimming in this study.
VS-mIP Display of SWI
Slice-by-slice segmentation was performed manually to remove air, bone, and intracranial non-brain tissue using the magnitude images to generate a 3D binary mask. In the VS-mIP, the projection was only applied to voxels in brain tissue with a value of “1”, excluding the voxels with a value of “0”. The VS-mIP approach was applied to phase mask, magnitude image, or SWI. Residual voxels in air, bone, and low intensity non-vascular voxels after volume segmentation result in a low intensity spot or patch in the projection. An erosion algorithm (15) was used to remove 3 more layers of voxels in the 3D binary mask prior to VS-mIP to exclude these residual voxels.
RESULTS
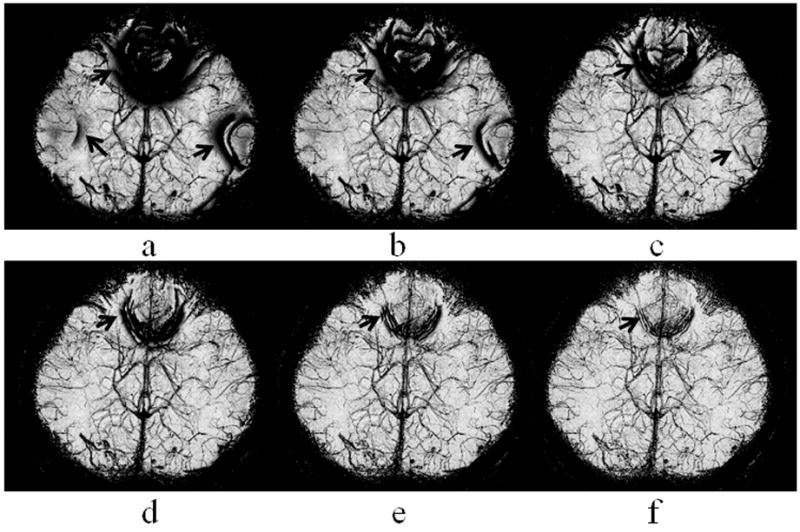
Figure 1 shows the mIP of a 3D phase mask, obtained with a LP filter size Wx×Wy of 48×36 (a), 64×48 (b), 96×72 (c), 128×96 (d), 192×144 (e), and 256×192 (f), respectively. Off-resonance artifact at the orbitofrontal and lateral temporal regions, as indicated by thick arrows, was reduced with a larger filter size. Venous contrast was slightly reduced at increased filter sizes. The filter size of 192×144 and 256×192 were considered adequate in this example. Since the contrast of small veins is usually low in a phase mask, the phase mask is commonly multiplied to the magnitude images multiple times to enhance the contrast in the final SWI. This approach is equivalent to multiplying the phase mask by itself multiple times to form an enhanced phase mask prior to the multiplication of the enhanced phase mask to the magnitude images. For better display of the contrast of small veins, we use the enhanced phase masks, with 4 multiplications, in Figure 1 and the rest of this paper.
Figure 1.
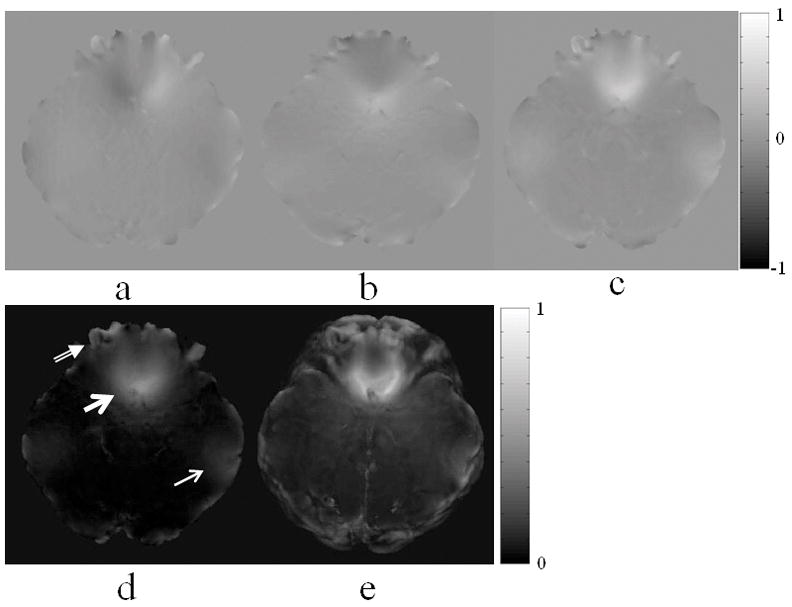
Retrospective shimming was performed by measuring the averaged background LFGs in the middle parietal region of the brain where the field is expected to be homogeneous. The regional averaged LFGx, LFGy, and LFGz was measured to be 5.8×10⁻³mT/m, 1.5×10⁻³mT/m, and 4.7×10⁻²mT/m, respectively. These averaged LFG values were subtracted from the whole brain LFG maps. Figure 2 shows the LFGx, LFGy, LFGz, and LFG maps at Slice 12 covering the orbitofrontal region after retrospective linear shimming and median filtering. The median filter has a kernel size of 5×5×5 voxels. The through-plane maximum-intensity projection (MIP) of LFG in the entire transverse slab is shown in Fig. 2e, with the maximum LFG value of 0.745mT/m at the orbitofrontal region, as indicated by a thick arrow. The lateral temporal region, as indicated by a thin arrow, and the frontal pole, as indicated by a double-lined arrow, also have an increased LFG. Median filtering with kernel sizes of 3×3×3 and 7×7×7 voxels was also tested in this study. With a kernel size of 3×3×3 voxels, error introduced by the major arteries was obvious in the filtered LFG map. Such error was nearly diminished with a kernel size of 7×7×7 voxels. We selected a kernel size of 5×5×5 voxels in the rest of study because it provides a reasonable balance between reducing the error introduced by the arteries and the error introduced by smoothing. For images acquired with a higher spatial resolution, a larger kernel size would be more desirable to effectively reduce the vascular effect.
Figure 2.
The semi-log histogram of LFG in the entire brain volume covered in this slab is shown in Fig. 3a. The regions with LFG≥0.2mT/m contain approximately 2.8% of the brain volume in the slab and are considered to have a severe field inhomogeneity. Figure 3b shows the profiles of the Fermi weighting functions with (R(mT/m), W(mT/m))=(0.1, 0.01), (0.15, 0.01), (0.15, 0.02), (0.2, 0.02), and (0.2, 0.05), respectively. These figures suggest that R=0.10–0.2mT/m would be a reasonable selection for this dataset.
Figure 3.
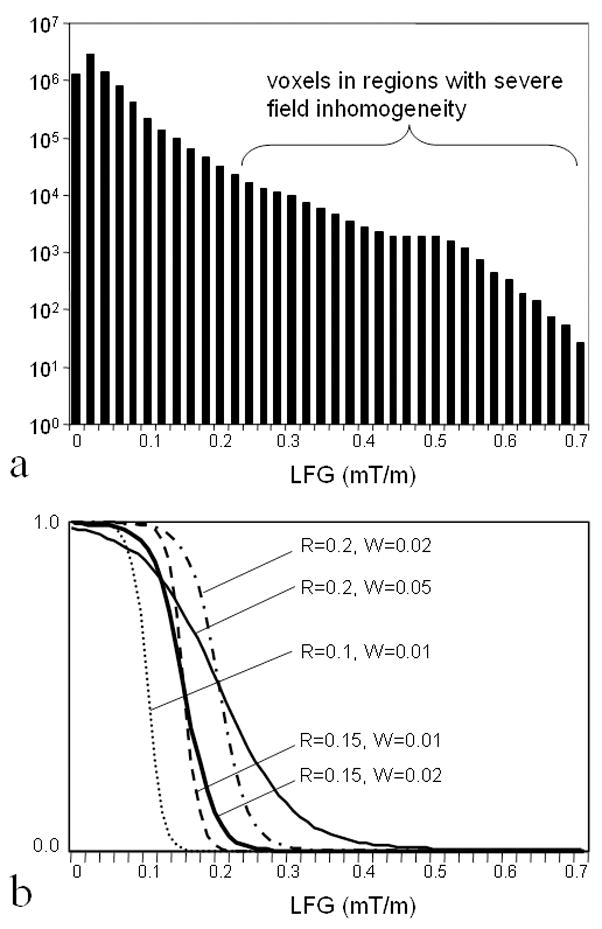
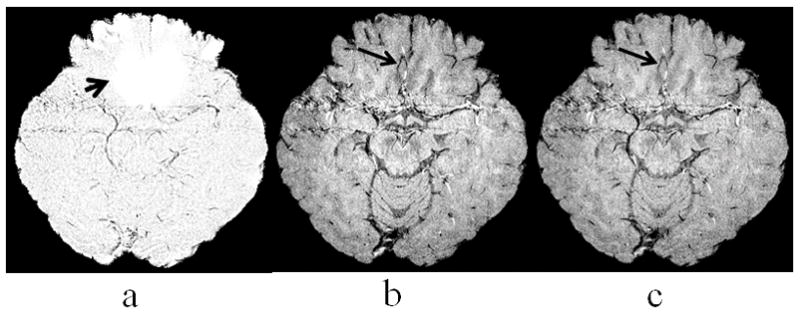
Figure 4 shows an example that veins in regions with severe field inhomogeneity can be well depicted in the magnitude images while they are obscured in conventional phase mask. The mIP of the LFG-suppressed phase mask at two adjacent slices (a), Slices 11 and 12, demonstrate the effect of LFG-suppression with R=0.15mT/m and R=0.02mT/m in a region with severe field inhomogeneity, as indicated by a short arrow. No venous structure was shown in this region as expected due to LFG-suppression. A segment of vein was well depicted in the mIP of magnitude images in this region at the same slice locations, as indicated by an arrow in Fig. 4b. This segment of vein remains to be visible in the mIP of the LFG-suppressed SWI, as shown in Fig. 4c.
Figure 4.
The Fermi weighting function with these R and W parameters were applied to the 3D LFG map to obtain a 3D distribution of the weighting function. The values of Fermi weighting function at Slice 12 are displayed as a map shown in Fig. 5(a–c), with (R(mT/m), W(mT/m))=(0.1, 0.01), (0.15, 0.02), and (0.2, 0.02), respectively. Fig. 5a shows a rather extended LFG suppression at the orbitofrontal region, frontal pole, and lateral temporal region. Fig. 5c shows a more focal LFG suppression, primarily at the orbitofrontal region and frontal pole. The mIP display of the enhance phase masks with LFG suppression shows nearly diminished off-resonance artifact at the orbitofrontal region (Fig. 5d–5f). With LFG suppression, a few veins located superior to the orbitofrontal region become visible in the enhanced phase mask, as indicated by arrows in Fig. 5d. We noticed that the contrast of these veins is slightly lower in Fig. 5d than that in Fig. 5e and 5f. We observed that R=0.15–0.2 mT/m and W=0.02 mT/m, as shown in Fig. 5e and 5f, provide sufficient suppression of the off-resonance artifact while maintaining adequate visibility of the veins in this study. The mIP display of enhanced phase masks with (R(mT/m), W(mT/m))=(0.15, 0.01) and (0.2, 0.05), not shown in this paper, is very similar to that in Fig. 5e and 5f, suggesting that high image quality of MRV can be obtained with a relatively wide range of selection of the R and W parameters.
Figure 5.
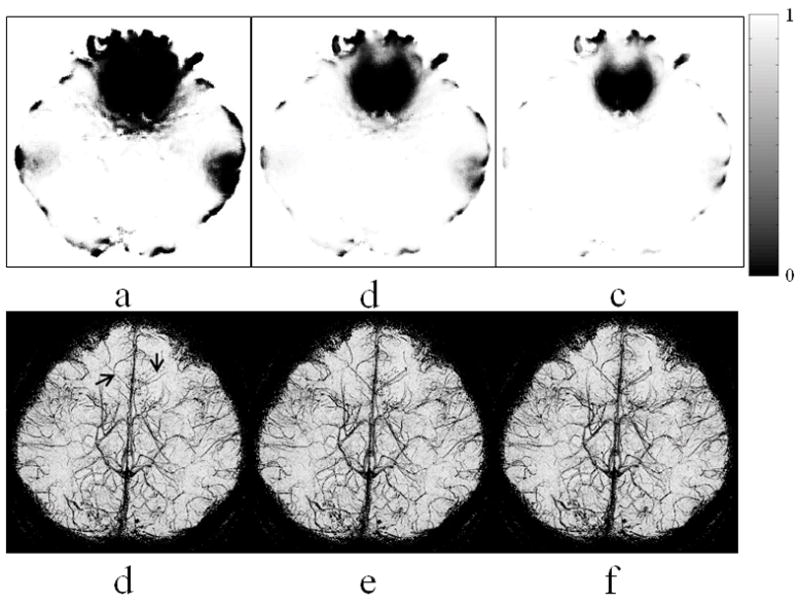
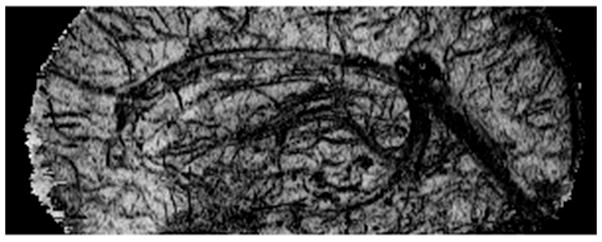
Figure 6 shows the mIP of the conventional MRV (a) and LFG-suppressed MRV with R=0.15 mT/m and W=0.02 mT/m (b). A few veins located at the orbitofrontal region obscured in conventional MRV become well depicted in the LFG-suppressed MRV. The effect of volume segmentation to the through-plane mIP display of the LFG-suppressed MRV is shown in Fig. 6c. Several small veins not visible with conventional mIP display become conspicuous in the VS-mIP display, as indicated by the arrows in Fig. 6c. Volume segmentation also makes in-plane display of MRV feasible. A sagittal view of the VS-mIP of the LFG-suppressed MRV data is shown in Figure 7. It was noticed that most of the small veins are well depicted in this figure.
Figure 6.
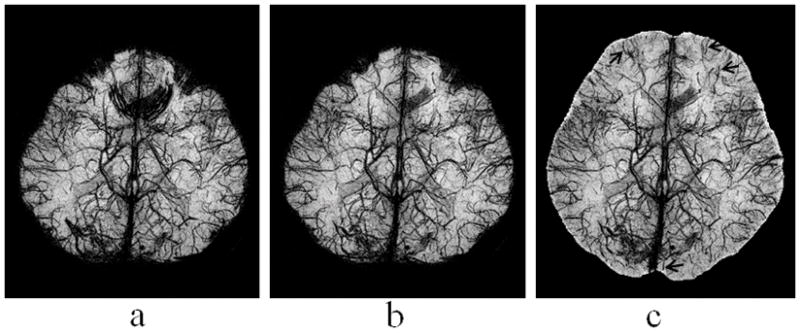
Figure 7.
DISCUSSION
Difference in magnetic susceptibility is the source of both venous contrast and the off-resonance artifact in SWI of the brain. Severe local field inhomogeneity can occur in brain tissue near tissue/bone interfaces at the orbitofrontal and lateral temporal regions as well as the frontal pole. The susceptibility difference induced by the B0 field change in venous blood is in the range of the size of a vein. In contrast, local field inhomogeneity can have a spatial extension of several centimeters. The conventional HP filter applied to k-space, however, is not effective in distinguishing the phase change due to venous blood or local field inhomogeneity. Residual background phase in the HP-filtered phase images can be large enough to introduce substantial off-resonance artifact in the phase mask in regions with severe field inhomogeneity. Ideally, the best solution is to remove the field effect completely and preserve the venous contrast in the phase mask. In this study, we use LFG measurements to estimate the severity of field inhomogeneity and to determine the relative weighting of the venous contrast in phase mask in the composition of the MRV. In regions with small LFG values, the venous contrast in MRV is determined by both the phase and magnitude changes in veins, the same as that obtained by the conventional procedure. In regions with large LFG values, the venous contrast in MRV is more heavily determined by that in the magnitude images. By applying the Fermi weighting function to the HP-filtered phase images, the resulting phase mask has a value near 1.0 in regions with severe field inhomogeneity.
It was found that the Fermi weighting function has minimal adverse effect to the venous contrast in regions with mild field inhomogeneity largely because the Fermi function has a value near 1.0 for a wide range of LFG below R. The Fermi weighting function is also less sensitive to the large-scale background field gradients caused by improper shimming. Proper shimming of the B0 field is still advisable, however, even with the use of Fermi weighting function. The linear shimming can be performed retrospectively during post-processing, as we did in this study, or prospectively on the scanner.
The effectiveness of LFG suppression in the phase mask is primarily determined by the size of the Fermi weighting function, R. A transition width W of one tenth of R (i.e., W~0.1R) would be adequate. The selection of R is also dependent on the size of the LP filter. With a small LP filter size, the off-resonance artifact is more severe and has a larger spatial extension. A smaller R value would be preferred in such case. On the other hand, a larger R value would be adequate when a larger LP filter size is used.
The technique for direct 3D LFG mapping using a single 3D SPGR dataset without the need for phase unwrapping is a novel approach. A major advantage of this LFG algorithm is its robustness. Unlike many other phase unwrapping algorithms, the proposed LFG algorithm does not require the placing of seeds for region growth (16).
Using mIP for the display of veins that have negative contrast introduce signal loss in regions where the projection encounters air or bone. As a result, the peripheral regions of the brain can be obscured in through-plane mIP display. Removing the air cavity and scalp bone through volume segmentation can effectively reduce the signal loss in the peripheral regions of the brain in through-plane mIP display. Noticeable dark shade can also appear in regions where the projection encounters cerebrospinal fluid (CSF) due to its heavy T1 saturation. Exclusion of the cerebrospinal fluid signal can also improve the contrast of some of the veins.
Brain volume segmentation is essential for in-plane mIP display of MRV. The air region and bone structures surrounding the brain have to be excluded from mIP because their low intensity can obscure brain signal. Ideally, the segmentation should preserve all the voxels in the brain and pial veins on the surface of the brain while removing all other voxels. In this study, a 3D binary mask was generated by manual segmentation of the brain tissue using magnitude images. Since both pial veins and CSF surrounding the brain appears dark in the magnitude images, it is challenging to distinguish them during volume segmentation. The bones adjacent to the brain at the base of the brain also appear dark due to the very short T2* of the water inside the bones and the long TE used in the scan, making it difficult to accurately separate the voxels in the bone from the voxels in the veins. A binary erosion algorithm was applied to further remove 3 layers of voxels on the edge of the brain on the 3D binary mask after manual segmentation. The drawback of using the erosion algorithm is the adverse removal of many pial veins on the surface of the brain. An accurate, automated, and robust segmentation algorithm will be desirable for high quality in-plane mIP display. For more accurate and robust volume segmentation, good signal contrast between CSF and pial veins is necessary. Modification of scan parameters can be considered to achieve more desirable contrast for segmentation. For example, signal intensity in CSF can be increased by using a smaller flip angle and signal intensity in the veins can be further reduced by using a longer TE. The reduced venous contrast shown in the in-plane mIP (Fig. 7) compared to that shown in the through-plane mIP (Fig. 6b) may be a result of a lower through-plane resolution (i.e., 1mm) compared to the in-plane resolution (i.e., 0.51mm). Reducing the slice thickness in data acquisition would be desirable for in-plane display. The increased projection length in the in-plane mIP includes a larger range of signal variation and, therefore, may also reduce the background signal and venous contrast in the mIP. Selecting a region-of-interest is expected to yield improved venous contrast in mIP.
In summary, this study demonstrated that increasing the size of LP filter can reduce the off-resonance artifact in phase mask. The size of LP filter can be selected to substantially reduce the off-resonance artifact with only minor reduction of venous contrast. The LFG measurement obtained from the same SWI dataset can be used to assess the severity of local field inhomogeneity. The off-resonance artifact can be effectively reduced by using a LFG-based phase suppression approach. Signal loss can occur in the through-plane mIP display of 3D MRV in the peripheral region of the brain. Conventional mIP approach is not feasible for in-plane display of MRV. Removing the air and non-brain tissue through volume segmentation prior to mIP can effectively avoid the signal lose in through-plane projection and enables in-plane mIP display of the venous vasculature.
Acknowledgments
NIH grants MH68582, MH070037, MH47476, DA009842 (YPD).
We thank Dr. Dosik Hwang for his assistance in data acquisition and preparation of the figures.
References
- 1.Reichenbach JR, Venkatesan R, Schillinger DJ, Kido DK, Haacke EM. Small vessels in the human brain: MR venography with deoxyhemoglobin as an intrinsic contrast agent. Radiology. 1997;204:272–7. doi: 10.1148/radiology.204.1.9205259. [DOI] [PubMed] [Google Scholar]
- 2.Haacke EM, Xu Y, Cheng YC, Reichenbach JR. Susceptibility weighted imaging (SWI) Magn Reson Med. 2004;52:612–8. doi: 10.1002/mrm.20198. [DOI] [PubMed] [Google Scholar]
- 3.Reichenbach JR, Essig M, Haacke EM, Lee BC, Przetak C, Kaiser WA, Schad LR. High-resolution venography of the brain using magnetic resonance imaging. MAGMA. 1998;6:62–9. doi: 10.1007/BF02662513. [DOI] [PubMed] [Google Scholar]
- 4.Essig M, Reichenbach JR, Schad LR, Schoenberg SO, Debus J, Kaiser WA. High-resolution MR venography of cerebral arteriovenous malformations. Magn Reson Imaging. 1999;17:1417–25. doi: 10.1016/s0730-725x(99)00084-3. [DOI] [PubMed] [Google Scholar]
- 5.Sehgal V, Delproposto Z, Haacke EM, et al. Clinical applications of neuroimaging with susceptibility-weighted imaging. J Magn Reson Imaging. 2005;22:439–50. doi: 10.1002/jmri.20404. [DOI] [PubMed] [Google Scholar]
- 6.Sehgal V, Delproposto Z, Haddar D, et al. Susceptibility-weighted imaging to visualize blood products and improve tumor contrast in the study of brain masses. J Magn Reson Imaging. 2006;24:41–51. doi: 10.1002/jmri.20598. [DOI] [PubMed] [Google Scholar]
- 7.Wycliffe ND, Choe J, Holshouser B, Oyoyo UE, Haacke EM, Kido DK. Reliability in detection of hemorrhage in acute stroke by a new three-dimensional gradient recalled echo susceptibility-weighted imaging technique compared to computed tomography: a retrospective study. J Magn Reson Imaging. 2004;20:372–7. doi: 10.1002/jmri.20130. [DOI] [PubMed] [Google Scholar]
- 8.Tan IL, van Schijndel RA, Pouwels PJ, et al. MR venography of multiple sclerosis. AJNR Am J Neuroradiol. 2000;21:1039–42. [PMC free article] [PubMed] [Google Scholar]
- 9.Reichenbach JR, Jonetz-Mentzel L, Fitzek C, et al. High-resolution blood oxygen-level dependent MR venography (HRBV): a new technique. Neuroradiology. 2001;43:364–9. doi: 10.1007/s002340000503. [DOI] [PubMed] [Google Scholar]
- 10.Xu Y, Haacke EM. The role of voxel aspect ratio in determining apparent vascular phase behavior in susceptibility weighted imaging. Magn Reson Imaging. 2006;24:155–60. doi: 10.1016/j.mri.2005.10.030. [DOI] [PubMed] [Google Scholar]
- 11.Rauscher A, Barth M, Reichenbach JR, Stollberger R, Moser E. Automated unwrapping of MR phase images applied to BOLD MR-venography at 3 Tesla. J Magn Reson Imaging. 2003;18:175–80. doi: 10.1002/jmri.10346. [DOI] [PubMed] [Google Scholar]
- 12.Reichenbach JR, Barth M, Haacke EM, Klarhofer M, Kaiser WA, Moser E. High-resolution MR venography at 3.0 Tesla. J Comput Assist Tomogr. 2000;24:949–57. doi: 10.1097/00004728-200011000-00023. [DOI] [PubMed] [Google Scholar]
- 13.Du YP. Three-dimensional mapping of local field gradient in fMRI. Proceedings of the 11th Annual Meeting of ISMRM; Toronto, Canada. 2003. (Abstract 1714) [Google Scholar]
- 14.Bernstein MA, Fain SB, Riederer SJ. Effect of windowing and zero-filled reconstruction of MRI data on spatial resolution and acquisition strategy. J Magn Reson Imaging. 2001 Sep;14(3):270–80. doi: 10.1002/jmri.1183. [DOI] [PubMed] [Google Scholar]
- 15.Baxes GA. Digital image processing: principles and applications. New York: John Wiley and Sons Inc; 1994. pp. 129–135. [Google Scholar]
- 16.Chavez S, Xiang QS, An L. Understanding phase maps in MRI: a new cutline phase unwrapping method. IEEE Trans Med Imaging. 2002;21:966–77. doi: 10.1109/TMI.2002.803106. [DOI] [PubMed] [Google Scholar]


