

Abstract
Diffusion imaging with high-b factors, high spatial resolution, and cerebro-spinal fluid signal suppression was performed in order characterize the biexponential nature of the diffusion-related signal decay with b-factor in normal cortical gray and deep gray matter. Integration of inversion pulses with a line scan diffusion imaging sequence resulted in 91% cerebro-spinal fluid signal suppression, permitting accurate measurement of the fast diffusion coefficient in cortical gray matter (1.142±0.106 μm2/ms) and revealing a marked similarity with that found in frontal white matter (1.155±0.046 μm2/ms). The reversal of contrast between gray and white matter at low vs high b-factors is shown to be due to a significantly faster slow diffusion coefficient in cortical gray matter (0.338±0.027 μm2/ms) than in frontal white matter (0.125±0.014 μm2/ms). The same characteristic diffusion differences between gray matter and white matter are observed in other brain tissue structures. The relative component size showed not significant differences among all tissues investigated. Cellular architecture in GM and WM are fundamentally different and may explain the two to three-fold higher slow diffusion coefficient in GM.
Keywords: High-b Diffusion Imaging, Biexponential Signal Decay, Cortical Gray Matter, Deep Gray Matter, Line Scan Diffusion Imaging, FLAIR
Introduction
The capability of MR to measure and image molecular water diffusion has provided a new source of image contrast, which is predominantly used in the study and diagnosis of neurological diseases. Analysis of the directionally dependent diffusion permits a direct assessment of nerve fiber tract integrity. Different WM tracts are well characterized by their distinct high diffusion anisotropy [1]. On the other hand, deep gray matter (GM) and in particular cortical gray matter can be categorized by their low diffusion anisotropy [1]. It is well known that these specific differences in diffusion anisotropy are predominantly due to the presence of uniformly arranged and densely packed axons and myelin sheets. Just as the architectural tissue differences seem to be reflected in the tissue specific diffusion anisotropy values, it is rather remarkable that the mean diffusivity, i.e., the rotationally invariant measure of diffusion derived from the trace of the diffusion tensor, shows little or no variation over the entire brain. For cortical GM, however, the partial volume effect due to limited spatial resolution and the presence of strong cerebro-spinal fluid (CSF) signal must be carefully considered. Otherwise, the measured mean diffusion appears too high. With high-resolution imaging protocols and diffusion imaging sequences, which permit CSF signal suppression with fluid-attenuated inversion recovery (FLAIR), it was confirmed that the mean diffusivity of cortical GM, deep GM, and WM is very similar [2].
The uniformity of mean diffusivity in normal brain has been established with diffusion imaging sequences that utilize b-factors within a range of 0−1000 s/mm2, the range that is routinely used in clinical exams. Maps of mean diffusivity are then generated assuming that the relationship between diffusion related MR signal decay and b-factor is monoexponential. With diffusion measurements over an extended b-factor range of up to 5000 s/mm2 or higher it has been clearly demonstrated that the signal decay in brain tissue deviates from a monoexponential decay. In particular, the residual signal at very high b-values is clearly higher than measurements at lower b-factors only predict [3,4]. It has also been determined that the non-monoexponential diffusion signal deviation is a genuine tissue property and not merely a partial volume effect or due to low signal-to-noise ratio (SNR). Several analysis models have been proposed to describe the non-monoexponential diffusion-related signal decay [4-6]. The obvious biexponential [4,7] or multiexponential analysis yields two or more diffusion coefficients and respective volume fractions. Interpretation of these diffusion coefficients and volume fractions as an expression of intra and extra-cellular diffusion has been discussed [8], but has not gained unequivocal acceptance, since the volume fractions are clearly different from intra and extra-cellular volume fractions determined with other methods.
The confounding partial volume contribution of CSF is also present in GM measurements at very high b-factors. Sacrifices that need to be made in spatial resolution, in order to satisfy the condition of sufficient SNR, accentuate the partial volume effect even further. The present work seeks to establish reliable measurements of the non-monoexponential diffusion in cortical GM and to compare them with the findings in WM and deep GM. The measurements were obtained with a line scan diffusion imaging (LSDI) sequence [9] that was modified to permit CSF signal suppression with an inversion pulse. A surface coil was used to achieve sufficient SNR in conjunction with high spatial resolution. Moreover, LSDI is a method distinguished by remarkably low distortions due to susceptibility variations and eddy currents, and thus particularly suitable for imaging cortical GM in the vicinity of the skull.
Diffusion imaging is routinely used for stroke diagnosis. However, many advanced applications for diffusion imaging focus solely on diffusion measurements in WM. It is well known that normal aging of the brain leads not only to changes in WM, but also GM. Moreover, many neurological and neurodegenerative diseases, such as Alzheimer's disease and Creutzfeldt-Jakob disease, primarily affect the GM. Thus, a more profound knowledge about the MR diffusion properties of GM, would be of both scientific and clinical interest.
Materials and Methods
An LSDI sequence with a radio-frequency (RF) inversion pulse for fluid signal suppression was implemented on a 1.5 Tesla whole-body scanner (LX, release CNV3, General Electric, Milwaukee, WI). The basic details about the LSDI sequence have been reported elsewhere [9]. The modified acquisition scheme, which uses a selective 180° RF pulse for fluid signal suppression, is presented in Fig. 1. With conventional multi-slice FLAIR sequences, the magnetization of all slices is inverted before the multi-slice acquisitions of particular k-space segments begins. In contrast, with the present implementation of LSDI that includes fluid signal suppression, selective inversion and column excitation are interleaved. This increases scan efficiency considerably and enables the acquisition of one image with an effective repetition time TR of 10 seconds in merely 30 seconds. As with conventional LSDI, the excited columns overlap slightly and, to minimize interference between neighboring columns, they are acquired in three spatially interleaved acquisitions that sweep the column excitation across the FOV within the time TR.
Figure 1.

Column excitation scheme used to suppress the water signal in a LSDI sequence. Column cross sections in the yz-plane are indicated by rhomboids. As with the conventional LSDI sequence, repetitive column excitation at time intervals TRC is accomplished with slice-selective 90° and 180° radio-frequency (RF) pulses. Immediately after column selection and signal readout, an additional slice-selective 180° RF pulse is applied to selectively invert the magnetization within a column that will be scanned later. After each time interval TRC the position of the scanned column and the column with inverted magnetization is incremented. In the scheme shown here and for the protocol used, the column inverted at t = 0 is scanned at t = 11TRC. After the column excitation has reached the edge of the field-of-view (FOV), excitation continues on the opposite side. To avoid cross-talk between columns, there is a gap between sequentially scanned columns. The gaps between the columns are then scanned in two additional sweeps across the FOV.
Informed consent for MR scanning was obtained in six healthy volunteers with a mean age of 38 years. All studies were conducted within the guidelines of the institutional internal review board (IRB) including written informed consent. Separate scans for frontal cortical GM and deep GM were performed in four subjects each. After performing localizing scans, LSDI scans were performed in an axial section at the level of the lateral ventricles. To maximize SNR in the frontal cortex, a 3 inch surface coil placed on the forehead was used to detect the RF signal. The image acquisition parameters were as follows: 3 mm slice thickness, 220×220 mm field of view (FOV), 128 (frequency)×l28 (column) scan matrix, ±2.2 kHz bandwidth, 10 s TR, 2400 ms inversion time (TI), 86 ms echo time (TE), and 24 minutes scan time. The time between individual column excitations, TRC, equaled 227 ms and was determined by the number of columns per sweep and the TR. Diffusion encoding was achieved with diffusion gradients of constant duration δ = 31.5 ms on each side of the spin echo inversion pulse, with their leading edges separated by Δ = 50.4 ms. Sixteen linearly increasing b-factors between 5 to 5000 s/mm2 were generated through gradient amplitude variation. To maximize SNR, a shortest possible TE was realized by maximizing the gradient amplitude of the diffusion encoding gradients. A maximal combined amplitude of 60 mT/m was attained by exploiting the maximum permissible gradient strength of 40 mT/m along each individual main axis and an optimized orthogonal diffusion encoding scheme with the relative gradient strengths (0.5,1.0,1.0), (−1.0,1.0,−0.5), and (1.0,0.5,−1.0), respectively. Even at maximum gradient strength, gradient duty cycle authorized by the manufacturer was not a limiting factor, since the time TRC between the application of the diffusion encoding gradient pairs was fairly long.
For deep GM diffusion imaging, the standard quadrature head coil was used. The image acquisition parameters were as follows: 6 mm slice thickness, 220×165 mm FOV, 64 (frequency)×48 (column) scan matrix, ±2.2 kHz bandwidth, 2635 ms TR, 155 ms TRC, 94 ms TE, 35.4 ms δ, and 47.3 ms Δ. TR and TRC were determined by the number of columns per sweep and the maximal permissible gradient duty cycle. Thirty-two images with linearly increasing diffusion weighting between 5 and 5000 s/mm2 were acquired for each of six non-collinear diffusion directions ((1,1,0), (0,1,1), (1,0,1), (0,1,−1), (1,−1,0), (−1,0,1)) in a total scan time of 27 minutes.
Spatial resolution and bandwidth of both protocols had been optimized to yield sufficient signal at the highest b-factor used without averaging and without combining measurements along different directions. Signal was deemed sufficient as long as for all tissue regions of interest and independent of the diffusion encoding direction measured, the signal exceeded mean baseline noise by a factor three. The data was processed off-line. For each pixel the geometric mean of the measured signal values si, i.e., for cortical gray matter measurements and for deep gray matter measurements was formed. A nonlinear least-squares Levenberg-Marquardt algorithm was employed for each pixel to fit brain signal intensity decay S with diffusion-weighting b to a biexponential function of the form
| (1) |
where Df and Ds are the diffusion coefficients of a fast and a slow diffusion component, respectively, and Af and As are their respective sizes. The quality of the fit was judged on the basis of the χ2 error, i.e., the sum of the unweighted squared differences between the input data points and the function values, evaluated at the same b-factors. In order to avoid solutions at a local minimum of the χ2 error merit function, seed values for Df and Ds were varied incrementally over a relatively wide range and fit values with the overall smallest χ2 error were selected as the optimal solution. Finally, maps were generated of each fitting parameter and of the slow diffusion component relative size fraction fs = As/(Af + As).
Each region of interest (ROI) was drawn manually with a program written by the authors that permits simultaneous visualization of the contour drawing process on different image backgrounds. On the high-resolution data set obtained with CSF signal suppression, the border between cortical GM and CSF was determined on a diffusion-weighted image, whereas the transition zone between GM and WM was determined on a T2-weighted image, i.e., the image with the lowest diffusion-weighting (5 s/mm2). Two neighboring ROIs were defined within the cortical GM: one adjacent to CSF and one proximal to WM. Moreover, for the same data set a ROI was also defined within the frontal WM. In the lower resolution data set without CSF signal suppression, ROIs were drawn on the left and right side for the internal capsule, the thalamus, and the composite of the putamen and globus pallidum. Great care was exercised to avoid the thalamus section next to the CSF-containing ventricle. Each parameter map was analyzed within the defined ROIs and statistical differences were tested with a Student's t-test.
Results
Image data suitable for analysis was obtained in all volunteers. The addition of a selective inversion pulse to the LSDI sequence resulted in a 91% suppression of the CSF signal, reducing the average CSF/WM signal ratio at b=5 s/mm2 from 3.7 to 0.34. An example of LSDI data collected without and with fluid signal suppression is presented in Fig. 2. Examples of the maps used for the ROI analysis of biexponential diffusion signal decay in cortical gray and frontal white matter are shown Fig. 3. The diffusion related signal decay curves for cortical GM and frontal WM ROIs in a normal subject are displayed in Fig. 4. Examples of diffusion maps and ROIs used for the analysis of deep GM and iWM structures are presented in Fig. 5. Average values and standard deviations of the fast diffusion coefficient Df, slow diffusion coefficient Ds, and the relative size fraction of the slow diffusion component fs for all ROIs analyzed are listed in Table 1. There was no statistically significant difference between the fast diffusion coefficient measured in cortical GM next to WMa and the fast diffusion coefficients measured in the thalamus, putamen/globus pallidum, frontal WM, or internal capsule ROI, respectively. In contrast, the fast diffusion coefficient of cortical GM close to CSF was higher than the fast diffusion coefficients of all other ROIs. To further investigate this consistent difference, a multiexponential fit with an additional component diffusing at a set rate of 3.423 μm2/ms, which can be considered typical for CSF [10], was explored for the cortical GM region close to CSF. It revealed a small relative size fraction of 0.100±0.036 for the assumed CSF component and reduced tissue diffusion coefficients Df and Ds of 0.911±0.090 μm2/ms and 0.303±0.076 μm2/ms, respectively. After removing the fastest diffusing component, the relative size fraction fs of the slow diffusion component equaled 0.222±0.072. Multiexponential fits without a predefined diffusion coefficient for the fluid component, resulted in similar values, however, with much larger variability. Slow diffusion coefficients determined in cortical and deep GM ROIs were statistically significantly higher than the slow diffusion coefficients in WM ROIs (p<0.025). Finally, for the slow diffusion component relative size fraction fs there was no statistically significant difference among ROIs, with the exception of the ROI in cortical GM close to CSF (p<0.04), where the highest fs value was measured.
Figure 2.
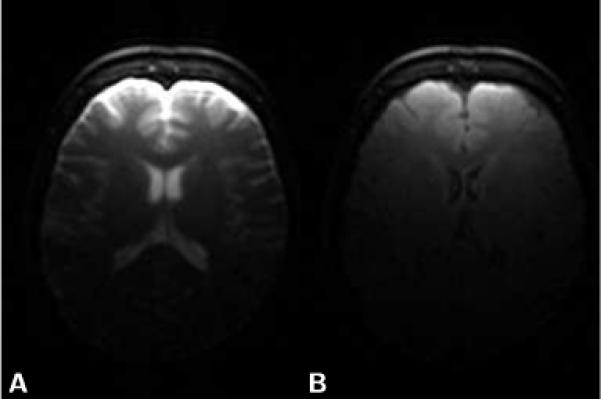
Axial T2-weighted (b=5 s/mm2) brain images obtained with LSDI. The image shown in A) was obtained without fluid signal suppression. For the image shown in B) fluid signal suppression was applied with a 2400 ms delay between magnetization inversion and column scanning. Other imaging parameters remained unchanged.
Figure 3.
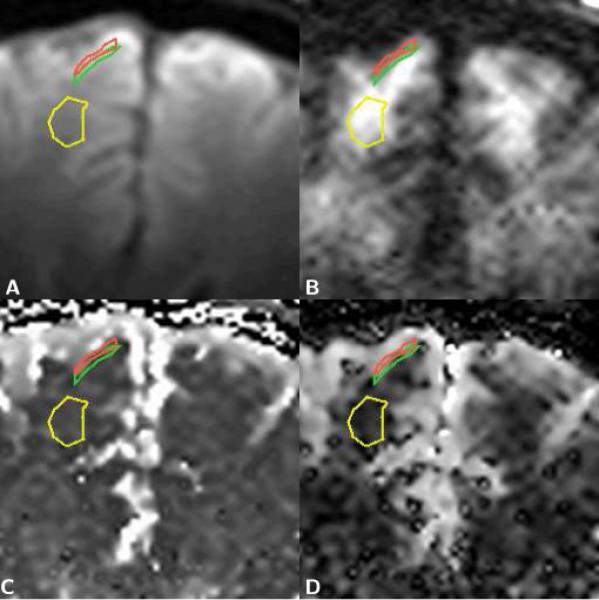
Enlarged sections of axial brain diffusion data maps with regions of interest (ROI) for gray matter next to CSF (red), gray matter next to white matter (green), and frontal white matter (yellow). A) T2-weighted image. B) Trace diffusion-weighted image (b=5000 s/mm2). C) Map of the fast diffusion component, Df. D) Map of the slow diffusion component, Ds. The ROIs were defined on the diffusion-weighted and on the T2-weighted image. On the T2-weighted image, gray and white matter are readily differentiated based on their T2 related differences in signal, i.e., gray matter is brighter than white matter. On the highly diffusion-weighted image an inversion of the gray/white matter contrast can be observed, i.e., gray matter is darker than white matter. Visual inspection of the diffusion component maps, furthermore, reveals that the dark area, which represents low diffusion values, is smaller on the slow diffusion component map.
Figure 4.

Diffusion related signal decay curves of a normal subject. The signal values shown are the geometric mean of three measurements with orthogonal diffusion encoding gradient directions. A) Decay curves of frontal cortical gray matter (GM) and white matter (WM) regions. A monoexponential fit with the signals measured at the four lowest b-values up to 1000 s/mm2 yields almost equal monoexponential diffusion coefficients of 0.672 μm2/ms for GM and 0.680 μm2/ms for WM. Even at b-factors of up to 5000 s/mm2, the signal-to-noise ratio is around 10 or more, much higher than the monoexponential analysis with low b-factors alone would predict. The GM-WM contrast reversal, i.e., brighter GM than WM at low diffusion weighting and darker GM than WM at very high diffusion weighting, can clearly be appreciated. For the experimental setup used in this work, GM and WM appear equally bright at a b-value of around 3000 s/mm2. Different T1 and T2 weighting would obviously change the b-value where GM and WM are equally bright. B) Decay curves of frontal cortical GM regions next to CSF and next to WM. With the linear signal scaling a difference in the low b-factor range is clearly evident, which can be attributed to the presence of a fast decaying signal component, such as CSF.
Figure 5.
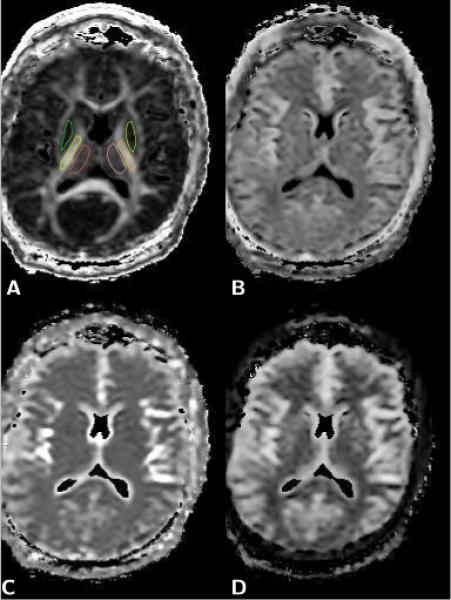
Axial brain diffusion data maps. A) Fractional anisotropy (FA) map, which was used to define the regions of interest (ROI) for right and left thalamus (red, pink), putamen and globus pallidum (green, light green), and internal capsule (yellow, orange). B) Map of the relative size fraction of the slow diffusion component, fs. C) Map of the fast diffusion coefficient, Df. D) Map of the slow diffusion coefficient, Ds. The elevated values of the slow diffusion coefficient observed in the putamen/globus pallidum and thalamus (see Table 1) are clearly evident on the slow diffusion component map shown in D, whereas the same areas appear no different from white matter in the map of the fast diffusion coefficient (C) and the map of the relative size fraction of the slow diffusion component (B).
Table 1.
Biexponential diffusion coefficients and slow diffusion relative size fraction values measured in gray and white matter regions of interest of four normal volunteers.
| Tissue (N=4) | Df [μm2/ms] | Ds [μm2/ms] | fs [] |
|---|---|---|---|
| Cortical GM next to CSF | 1.479±0.166 | 0.466±0.017 | 0.510±0.012 |
| Cortical GM next to WM | 1.142±0.106 | 0.338±0.027 | 0.378±0.038 |
| Thalamus | 1.320±0.164 | 0.271±0.040 | 0.383±0.069 |
| Putamen/Globus Pallidum | 1.069±0.039 | 0.257±0.026 | 0.352±0.028 |
| Frontal WM | 1.155±0.046 | 0.125±0.014 | 0.301±0.050 |
| Internal Capsule WM | 1.215±0.024 | 0.183±0.009 | 0.363±0.020 |
GM: Gray Matter; WM: White Matter; CSF: Cerebro Spinal Fluid
Df: Fast Diffusion Coefficient; Ds: Slow Diffusion Coefficient
fs: Slow Diffusion Component Relative Size Fraction
Discussion
The biexponential diffusion analysis of high-b GM and WM diffusion image data clearly demonstrates that both tissues exhibit non-monoexponential diffusion. Moreover, cortical and deep GM can be differentiated from WM based on the slow diffusion coefficient Ds. Meanwhile, the fast diffusion coefficients Df for GM and WM appear to be similar. These findings fully clarify the reversal of the GM-WM contrast at very high diffusion weightings. The observation of a fast diffusion coefficient that is higher in cortical GM close to the CSF space than in cortical GM next to WM can be explained by incomplete CSF signal suppression. Since CSF has similar diffusion properties as water at body temperature, it will primarily influence the value of the fast diffusion coefficient. Indeed earlier measurements performed by our group [11,12] with the same diffusion imaging sequence, but without fluid signal suppression and at lower spatial resolution, invariably found an even more elevated fast diffusion coefficient for cortical GM, meanwhile the slow diffusion coefficient was similar as in the present study (see Table 2). The multiexponential fit with one additional compartment did reveal a very fast diffusing component with a relatively small size fraction, which could be attributed to CSF. However, this finding should be considered with great caution. The great variation of the results, once the diffusion coefficient of the fluid component is not predefined, is indicative of unreliable fits, which commonly occurs if too many variables are used to fit and noise begins to dominate the results. The addition of one compartment did change the diffusion coefficients and relative size fractions of the other two compartments, but did not yield values that fully agree with the values measured in cortical GM next to WM, i.e., the values believed to be relatively void of CSF contamination. The slightly lower tissue diffusion values found with the 3-compartment model, may also indicate the presence of a fast diffusing component within the tissue, such as perfusing blood.
Table 2.
Biexponential diffusion coefficients and slow diffusion relative size fraction values reported in the literature.
| Tissue | Df [μm2/ms] | Ds [μm2/ms] | fs [] | Reference |
|---|---|---|---|---|
| Cortical GM | 1.71 | 0.37 | 0.42 | [11] |
| Cortical GM | 1.74 | 0.33 | 0.32 | [12] |
| Cortical GM | 1.02 | 0.19 | 0.30 | [13] |
| WM | 1.12 | 0.16 | 0.34 | [13] |
| Cortical GM | 1.505 | 0.397 | 0.477 | [14] |
| WM | 1.482 | 0.213 | 0.421 | [14] |
| Putamen | 0.79 | 0.19 | 0.28 | [4] |
| Putamen | 1.52 | 0.55 | 0.68 | [16] |
GM: Gray Matter; WM: White Matter
Df: Fast Diffusion Coefficient; Ds: Slow Diffusion Coefficient
fs: Slow Diffusion Component Relative Size Fraction
Biexponential cortical and deep GM diffusion values have also been reported by other authors. Clark and Le Bihan [13] measured cortical GM and WM with a single-shot echoplanar diffusion imaging sequence, fluid signal suppression, and b-values up to 3800 s/mm2. Kiselev and Il'ysasov [14] also used a single-shot echo-planar diffusion imaging sequence, but without fluid signal suppression, and b-values of only up to 2500 s/mm2. Both studies report slow diffusion coefficients that are higher for GM than WM, as well as fast diffusion coefficients and relative size fractions that appear to be similar for GM and WM (see also Table 2). Discrepancies among these and the current study could be attributed to the absence or presence of fluid signal inversion as well as differences in the b-factor range, diffusion encoding times, spatial resolution, and echo times that were employed. Too low SNR and a Rician noise distribution due to magnitude signal averaging [15], particularly when single-shot echo-planar sequences with long echo times are applied, could also have contributed to the differences among these studies. Deep GM values of the putamen reported by Mulkern et al. [4] (Table 2) were obtained with a single line scan technique. The putamen exhibits a slight diffusion anisotropy due to crossing nerve fibers [1] and the discrepancy in comparison to the values of the present study may be the result of measuring the diffusion along a single direction only. Moreover, this study employed much longer diffusion encoding and echo times than the present study. Finally, Yoshiura et al. [16] also reported biexponenential diffusion values of the putamen that are clearly different from the present study (see Table 2). A noteworthy shortcoming of the study by Yoshiura et al. is the use of diffusion gradients with constant amplitude and variable duration, instead of variable amplitude and constant duration. A more likely source of error, however, is the low SNR of the diffusion imaging study, which encompassed 36 signal averages.
Our choice of a biexponential function for fitting the water signal decay with b-factor is largely an empirical choice dictated by the quality of such fits to the data. Of course a biexponential function would be the choice dictated by the presence of two water compartments, such as intra- and extracellular water compartments with slow and fast diffusion coefficients, respectively. These are, however, two different statements and it is far from apparent that a two-compartment model is appropriate for in vivo grey matter, though in simpler cell suspension systems such a model has been gainfully employed and generally validated [17-20]. Indeed an immediate objection to an intra- and extracellular interpretation for the observed decays is that the relative volume fractions of the slow and fast diffusion components are roughly opposite that which would be expected on the basis of intra- and extracellular volume fractions in brain parenchyma [4,13]. As such, alternate mathematical functions designed to specifically or indirectly avoid the conceptual formulation of physically discrete water compartments have been forwarded to describe the non-monoexponential signal decay. Among these are statistical models involving a truncated Gaussian distribution of diffusion coefficients [21] and a stretched exponential model [22] with an intrinsic relationship to a statistical distribution of coefficients [23]. Others [24,25] have turned to the rather old result [26] that restricted diffusion leads to complicated, non-monoexponential signal decay with b-factor, as has been observed from preparations yielding intra-cellular signals alone [3, 27]. Presumably, a distribution of the spatial dimensions of the restrictions obfuscate the non-monotonic nature of idealized restriction between evenly spaced barriers [25,26] in most, if not all cases [28].
Despite alternatives, physical water compartmentation continues to be taken seriously as partially or wholly responsible for the observed biexponential like signal decays. Le Bihan has recently suggested that the slow diffusion component may represent water associated with cell membranes and associated cytoskeleton structures while the fast diffusion component represents the remaining, less restricted water, found in both intra- and extracellular spaces [29]. Vestergaard-Poulsen et al have worked further with the intra- and extracellular interpretation but employed a 7 parameter model which included not only intrinsically different diffusion coefficients and volume fractions but also water exchange between the compartments and intrinsic T2 decay differences [30]. They rather successfully modeled signal vs b-factor data in gray matter, albeit at the introduction of a short intra-cellular water T2 component that, unlike the presumed myelin associated water in white matter [31], has not been detected experimentally to date. Direct observations of the T1 relaxation and magnetization transfer properties of the fast and slow diffusion components made by our group [32,33] failed to discern differences in these parameters, findings which must ultimately be reconciled if water compartmentation is to be deemed responsible for fast and slow diffusion components observed when biexponential fits are used to model the data.
Summary
Biexponential analysis of high-b diffusion data reveals a profound difference in water diffusion between GM and WM. Evidently the results need to be interpreted with great care, since the Df value appears to increase in the layer closest to the cortical surface. One possible interpretation of the elevated Df is the incomplete suppression of the CSF signal. Cellular architecture in GM and iWM are fundamentally different and may explain the two to three-fold higher Ds coefficient in GM. The presence of nerve fibers, corroborated by the elevated anisotropy on conventional diffusion tensor scans [1], may explain the somewhat lower Ds values in the deep GM structures. The observation of similar fast diffusion coefficients and relative component sizes, but radically different slow diffusion coefficients among the brain tissues investigated furthers our understanding of non-monoexponential diffusion signal decay and may ultimately hold the key to a correct interpretation.
Acknowledgments
The research presented was supported by grants from the National Institute of Neurological Disorders and Stroke (NIH R01 NS39335), the National Institute for Biomedical Imaging (R01 EB006867), and the National Center for Research Resources (U41 RR019703).
References
- 1.Mamata H, Jolesz FA, Maier SE. Characterization of central nervous system structures by magnetic resonance diffusion anisotropy. Neurochem Int. 2004;45(4):553–60. doi: 10.1016/j.neuint.2003.11.014. [DOI] [PubMed] [Google Scholar]
- 2.Falconer JC, Narayana PA. Cerebrospinal fluid-suppressed high-resolution diffusion imaging of human brain. Magn Reson Med. 1997;37:119–123. doi: 10.1002/mrm.1910370117. [DOI] [PubMed] [Google Scholar]
- 3.Assaf Y, Cohen Y. Non-mono-exponential attenuation of water and N-acetyl aspartate signals due to diffusion in brain tissue. J Magn Reson. 1998;131(1):69–85. doi: 10.1006/jmre.1997.1313. [DOI] [PubMed] [Google Scholar]
- 4.Mulkern RV, Gudbjartsson H, Westin CF, Zengingonul HP, Gartner W, Guttmann CR, Robertson R, Kyriakos W, Schwartz R, Holtzman D, Jolesz FA, Maier SE. Multicomponent apparent diffusion coefficients in human brain. NMR in Biomedicine. 1999;12:51–62. doi: 10.1002/(sici)1099-1492(199902)12:1<51::aid-nbm546>3.0.co;2-e. [DOI] [PubMed] [Google Scholar]
- 5.Assaf Y, Cohen Y. Assignment of the water slow-diffusing component in the central nervous system using q-space diffusion MRS: Implications for fiber tract imaging. Magn Reson Med. 2000;43(2):191–199. doi: 10.1002/(sici)1522-2594(200002)43:2<191::aid-mrm5>3.0.co;2-b. [DOI] [PubMed] [Google Scholar]
- 6.Jensen JH, Helpern JA, Ramani A, Lu H, Kaczynski K. Diffusional kurtosis imaging: the quantification of non-gaussian water diffusion by means of magnetic resonance imaging. Magn Reson Med. 2005;53(6):1432–40. doi: 10.1002/mrm.20508. [DOI] [PubMed] [Google Scholar]
- 7.Maier SE, Vajapeyam S, Mamata H, Westin CF, Jolesz FA, Mulkern RV. Biexponential diffusion tensor analysis of human brain diffusion data. Magn Reson Med. 2004;51(2):321–330. doi: 10.1002/mrm.10685. [DOI] [PubMed] [Google Scholar]
- 8.Niendorf T, Dijkhuizen RM, Norris DG, van Lookeren Campagne M, Nicolay K. Biexponential diffusion attenuation in various states of brain tissue: Implications for diffusion-weighted imaging. Magn Reson Med. 1996;36(6):847–857. doi: 10.1002/mrm.1910360607. [DOI] [PubMed] [Google Scholar]
- 9.Gudbjartsson H, Maier SE, Mulkern RV, Mórocz IÁ, Patz S, Jolesz FA. Line scan diffusion imaging. Magn Reson Med. 1996;36(4):509–519. doi: 10.1002/mrm.1910360403. [DOI] [PubMed] [Google Scholar]
- 10.Hakyemez B, Aksoy U, Yildiz H, Ergin N. Intracranial epidermoid cysts: Diffusion-weighted, FLAIR and conventional MR findings. Eur J Radiol. 2005;54(2):214–20. doi: 10.1016/j.ejrad.2004.06.018. [DOI] [PubMed] [Google Scholar]
- 11.Maier SE, Bogner P, Bajzik G, Mamata H, Mamata Y, Repa I, Jolesz FA, Mulkern RV. Normal brain and brain tumor: Multicomponent apparent diffusion coefficient line scan imaging. Radiology. 2001;219:842–849. doi: 10.1148/radiology.219.3.r01jn02842. [DOI] [PubMed] [Google Scholar]
- 12.Mulkern RV, Vajapeyam S, Robertson RL, Caruso PA, Rivkin MJ, Maier SE. Biexponential apparent diffusion coefficient parametrization in adult vs newborn brain. Magn Reson Imaging. 2001;19(5):659–668. doi: 10.1016/s0730-725x(01)00383-6. [DOI] [PubMed] [Google Scholar]
- 13.Clark CA, Le Bihan D. Water diffusion compartmentation and anisotropy at high b values in the human brain. Magn Reson Med. 2000;44(6):852–9. doi: 10.1002/1522-2594(200012)44:6<852::aid-mrm5>3.0.co;2-a. [DOI] [PubMed] [Google Scholar]
- 14.Kiselev VG, Il'yasov KA. Is the ”biexponential diffusion” biexponential. Magn Reson Med. 2007;57(3):464–469. doi: 10.1002/mrm.21164. [DOI] [PubMed] [Google Scholar]
- 15.Gudbjartsson H, Patz S. The Rician distribution of noisy MRI data. Magn Reson Med. 1995;34(6):910–4. doi: 10.1002/mrm.1910340618. [DOI] [PMC free article] [PubMed] [Google Scholar]
- 16.Yoshiura T, Wu O, Zaheer A, Reese TG, Sorensen AG. Highly diffusion-sensitized MRI of brain: dissociation of gray and white matter. Magn Reson Med. 2001;45(5):734–40. doi: 10.1002/mrm.1100. [DOI] [PubMed] [Google Scholar]
- 17.Pilatus U, Shim H, Artemov D, Davis D, van Zijl PCM, Glickson JD. Intracellular volume and apparent diffusion constants of perfused cancer cell cultures, as measured by NMR. Magn Reson Med. 1997;37:825–832. doi: 10.1002/mrm.1910370605. [DOI] [PubMed] [Google Scholar]
- 18.Pfeuffer J, Flogel U, Leibfritz D. Monitoring of cell volume and water exchange time in perfused cells by diffusion-weighted 1H NMR spectroscopy. NMR Biomed. 1998;11(1):11–8. doi: 10.1002/(sici)1099-1492(199802)11:1<11::aid-nbm498>3.0.co;2-e. [DOI] [PubMed] [Google Scholar]
- 19.Pfeuffer J, Flögel U, Dreher W, Leibfritz D. Restricted diffusion and exchange of intracellular water: Theoretical modelling and diffusion time dependence of 1H NMR measurements on perfused glial cells. NMR Biomed. 1998;11(1):19–31. doi: 10.1002/(sici)1099-1492(199802)11:1<19::aid-nbm499>3.0.co;2-o. [DOI] [PubMed] [Google Scholar]
- 20.Thelwall PE, Grant SC, Stanisz GJ, Blackband SJ. Human erythrocyte ghosts: Exploring the origins of multiexponential water diffusion in a model biological tissue with magnetic resonance. Magn Reson Med. 2002;48(4):649–57. doi: 10.1002/mrm.10270. [DOI] [PubMed] [Google Scholar]
- 21.Yablonskiy DA, Bretthorst GL, J AJ. Statistical model for diffusion attenuated MR signal. Magn Reson Med. 2003;50(4):664–9. doi: 10.1002/mrm.10578. [DOI] [PMC free article] [PubMed] [Google Scholar]
- 22.Bennett KM, Schmainda K, Bennett R, Rowe D, Lu H, Hyde J. Characterization of continuously distributed cortical water diffusion rates with a stretched-exponential model. Magn Reson Med. 2003;50(4):727–34. doi: 10.1002/mrm.10581. [DOI] [PubMed] [Google Scholar]
- 23.Alvarez F, Alegra A, Colmenero J. Relationship between the time-domain Kohlrausch-Williams-Watts and frequency-domain Havriliak-Negami relaxation functions. Phys Rev B Condens Matter. 1991;44(14):7306–7312. doi: 10.1103/physrevb.44.7306. [DOI] [PubMed] [Google Scholar]
- 24.Frøhlich AF, Ostergaard L, Kiselev VG. Effect of impermeable boundaries on diffusion-attenuated MR signal. J Magn Reson. 2005;53(3):564–73. doi: 10.1016/j.jmr.2005.12.005. [DOI] [PubMed] [Google Scholar]
- 25.Peled S, Cory DG, Raymond SA, A KD, A JF. Water diffusion, T(2), and compartmentation in frog sciatic nerve. Magn Reson Med. 1999;42(5):911–8. doi: 10.1002/(sici)1522-2594(199911)42:5<911::aid-mrm11>3.0.co;2-j. [DOI] [PMC free article] [PubMed] [Google Scholar]
- 26.Robertson B. Spin-echo decay of spins diffusing in a bounded region. Phys Rev. 1966;151:273–277. [Google Scholar]
- 27.Sehy JV, Ackerman JJ, Neil JJ. Evidence that both fast and slow water ADC components arise from intracellular space. Magn Reson Med. 2002;48(5):765–770. doi: 10.1002/mrm.10301. [DOI] [PubMed] [Google Scholar]
- 28.Weng JC, Chen JH, Kuo LW, Wedeen VJ, Tseng WY. Maturation-dependent microstructure length scale in the corpus callosum of fixed rat brains by magnetic resonance diffusion-diffraction. Magn Reson Imaging. 2007;25(1):77–86. doi: 10.1016/j.mri.2006.08.018. [DOI] [PubMed] [Google Scholar]
- 29.Le Bihan D. The ’wet mind’: Water and functional neuroimaging. Phys Med Biol. 2007;52(7):R57–90. doi: 10.1088/0031-9155/52/7/R02. [DOI] [PubMed] [Google Scholar]
- 30.Vestergaard-Poulsen P, Hansen B, Østergaard L, Jakobsen R. Microstructural changes in ischemic cortical gray matter predicted by a model of diffusion-weighted MRI. J Magn Reson Imaging. 2007;26(3):529–40. doi: 10.1002/jmri.21030. [DOI] [PubMed] [Google Scholar]
- 31.MacKay A, Whittall K, Adler J, Li D, Paty D, Graeb D. In vivo visualization of myelin water in brain by magnetic resonance. Magn Reson Med. 1994;31(6):673–7. doi: 10.1002/mrm.1910310614. [DOI] [PubMed] [Google Scholar]
- 32.Mulkern RV, Vajapeyam S, Haker SJ, Maier SE. Magnetization transfer studies of the fast and slow tissue water diffusion components in the human brain. NMR in Biomedicine. 2005;18(3):186–94. doi: 10.1002/nbm.939. [DOI] [PubMed] [Google Scholar]
- 33.Mulkern RV, Zengingonul HP, Robertson RL, Bogner P, Gudbjartsson H, Guttmann CR, Holtzman D, Kyriakos W, Jolesz FA, Maier SE. Multi-component apparent diffusion coefficients in human brain: Relationship to spin-lattice relaxation. Magn Reson Med. 2000;44:292–300. doi: 10.1002/1522-2594(200008)44:2<292::aid-mrm17>3.0.co;2-q. [DOI] [PubMed] [Google Scholar]