Abstract
Computer-aided diagnosis (CAD) has been an active area of study in medical image analysis. A filter for enhancement of lesions plays an important role for improving the sensitivity and specificity in CAD schemes. The filter enhances objects similar to a model employed in the filter; e.g., a blob-enhancement filter based on the Hessian matrix enhances sphere-like objects. Actual lesions, however, often differ from a simple model, e.g., a lung nodule is generally modeled as a solid sphere, but there are nodules of various shapes and with inhomogeneities inside such as a nodule with spiculations and ground-glass opacity. Thus, conventional filters often fail to enhance actual lesions. Our purpose in this study was to develop a supervised filter for enhancement of actual lesions (as opposed to a lesion model) by use of a massive-training artificial neural network (MTANN) in a CAD scheme for detection of lung nodules in CT. The MTANN filter was trained with actual nodules in CT images to enhance actual patterns of nodules. By use of the MTANN filter, the sensitivity and specificity of our CAD scheme were improved substantially. With a database of 69 lung cancers, nodule candidate detection by the MTANN filter achieved a 97% sensitivity with 6.7 false positives (FPs) per section, whereas nodule candidate detection by a difference-image technique achieved a 96% sensitivity with 19.3 FPs per section. Classification MTANNs were applied for further reduction of the FPs. The classification MTANNs removed 60% of the FPs with a loss of 1 true positive; thus, it achieved a 96% sensitivity with 2.7 FPs per section. Overall, with our CAD scheme based on the MTANN filter and classification MTANNs, an 84% sensitivity with 0.5 FPs per section was achieved.
Keywords: supervised filter, lesion enhancement, non-model-based approach, artificial neural network, computer-aided diagnosis
1. Introduction
Computer-aided diagnosis (CAD) (Giger and Suzuki 2007) has been an active area of study in medical image analysis, because evidence suggests that CAD can help improve the diagnostic performance of radiologists in their image interpretations (Li, Aoyama et al. 2004; Li, Arimura et al. 2005; Dean and Ilvento 2006). Many investigators have participated in and developed CAD schemes for detection/diagnosis of lesions in medical images, such as detection of lung nodules in chest radiographs (Giger, Doi et al. 1988; van Ginneken, ter Haar Romeny et al. 2001; Suzuki, Shiraishi et al. 2005) and in thoracic CT (Armato, Giger et al. 1999; Armato, Li et al. 2002; Suzuki, Armato et al. 2003; Arimura, Katsuragawa et al. 2004), detection of microcalcifications/masses in mammography (Chan, Doi et al. 1987), breast MRI (Gilhuijs, Giger et al. 1998), and breast US (Horsch, Giger et al. 2004; Drukker, Giger et al. 2005), and detection of polyps in CT colonography (Yoshida and Nappi 2001; Suzuki, Yoshida et al. 2006; Suzuki, Yoshida et al. 2008).
A generic CAD scheme consists of segmentation of the target organ, detection of lesion candidates, feature analysis of the detected candidates, and classification of the candidates into lesions or non-lesions based on the features. For CT images, thresholding-based methods such as multiple thresholding (Giger, Doi et al. 1988; Xu, Doi et al. 1997; Aoyama, Li et al. 2002; Bae, Kim et al. 2002) are often used for detection of lesion candidates. With such methods, the specificity can generally be low, because normal structures of gray levels similar to those of lesions could be detected erroneously as lesions. To obtain a high specificity as well as sensitivity, some researchers employ a filter for enhancement of lesions before the lesion-candidate-detection step. Such a filter aims at enhancement of lesions and sometimes suppression of noise. The filter enhances objects similar to a model employed in the filter. For example, a blob-enhancement filter based on the Hessian matrix enhances sphere-like objects (Frangi, Niessen et al. 1999). A difference-image technique employs a filter designed for enhancement of nodules and suppression of noise in chest radiographs (Xu, Doi et al. 1997).
Actual lesions, however, are not simple enough to be modeled accurately by a simple equation in many cases. For example, a lung nodule is generally modeled as a solid sphere, but there are nodules of various shapes and with internal inhomogeneities such as spiculated opacity and ground-glass opacity. A polyp in the colon is modeled as a bulbous object, but there are also polyps which exhibit a flat shape (Lostumbo, Tsai et al. 2007). Thus, conventional filters often fail to enhance actual lesions. Moreover, such filters enhance any objects similar to a model employed in the filter. For example, a blob-enhancement filter enhances not only spherical solid nodules, but also any spherical parts of objects in the lungs such as vessel crossing, vessel branching, and a part of a vessel, which leads to a low specificity. Therefore, methods which can enhance actual lesions accurately (as opposed to enhancing a simple model) are demanded for improvement of the sensitivity and specificity of the lesion-candidate detection and thus of the entire CAD scheme.
We believe that enhancing actual lesions requires some form of “learning from examples;” thus, machine learning plays an essential role. To enhance actual lesions accurately, we develop a supervised filter based on a machine-learning technique called a massive-training artificial neural network (MTANN) (Suzuki, Armato et al. 2003) filter in a CAD scheme for detection of lung nodules in CT in this study. By extension of “neural filters” (Suzuki, Horiba et al. 2002) and “neural edge enhancers” (Suzuki, Horiba et al. 2003; Suzuki, Horiba et al. 2004), which are ANN-based (Rumelhart, Hinton et al. 1986) supervised nonlinear image-processing techniques, MTANNs (Suzuki, Armato et al. 2003) have been developed for accommodating the task of distinguishing a specific opacity from other opacities in medical images. MTANNs have been applied to the reduction of false positives (FPs) in the computerized detection of lung nodules in low-dose CT (Suzuki, Armato et al. 2003; Arimura, Katsuragawa et al. 2004) and chest radiography (Suzuki, Shiraishi et al. 2005), for distinction between benign and malignant lung nodules in CT (Suzuki, Li et al. 2005), for suppression of ribs in chest radiographs (Suzuki, Abe et al. 2006), and for reduction of FPs in computerized detection of polyps in CT colonography (Suzuki, Yoshida et al. 2006; Suzuki, Yoshida et al. 2008). The MTANN filter is trained with actual lesions in CT images to enhance the actual patterns of the lesions (Suzuki, Shi et al. 2008). We evaluate and compare the performance of our CAD scheme incorporating the MTANN filter with that of a CAD scheme with a conventional filter.
2. Materials and Methods
2.1. A supervised “lesion-enhancement” MTANN filter
2.1.1. Architecture of an MTANN filter
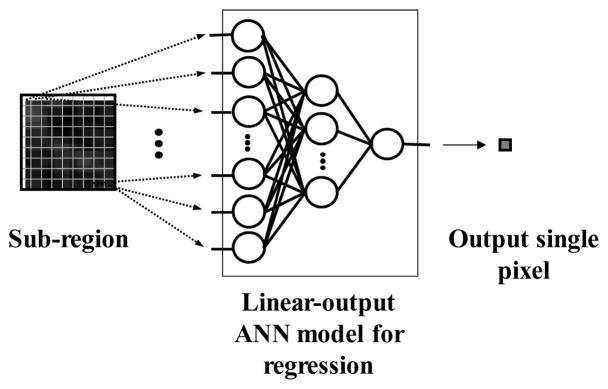
The architecture of an MTANN supervised filter is shown in Fig. 1. An MTANN filter consists of a linear-output regression ANN (LORANN) model (Suzuki, Horiba et al. 2003), which is a regression-type ANN capable of operating on pixel data directly. The MTANN filter is trained with input CT images and the corresponding “teaching” images that contain a map for the “likelihood of being lesions.” The pixel values of the input images are linearly scaled such that –1,000 Hounsfield units (HU) corresponds to 0 and 1,000 HU corresponds to 1 (values below 0 and above 1 are allowed). The input to the MTANN filter consists of pixel values in a sub-region, RS, extracted from an input image. The output of the MTANN filter is a continuous scalar value, which is associated with the center pixel in the sub-region, and is represented by
Figure 1.
Architecture of an MTANN consisting of a LORANN model with sub-region input and single-pixel output. All pixel values in a sub-region extracted from an input CT image are entered as input to the LORANN. The LORANN outputs a single pixel value for each subregion, the location of which corresponds to the center pixel in the sub-region. Output pixel value is mapped back to the corresponding pixel in the output image.
| (1) |
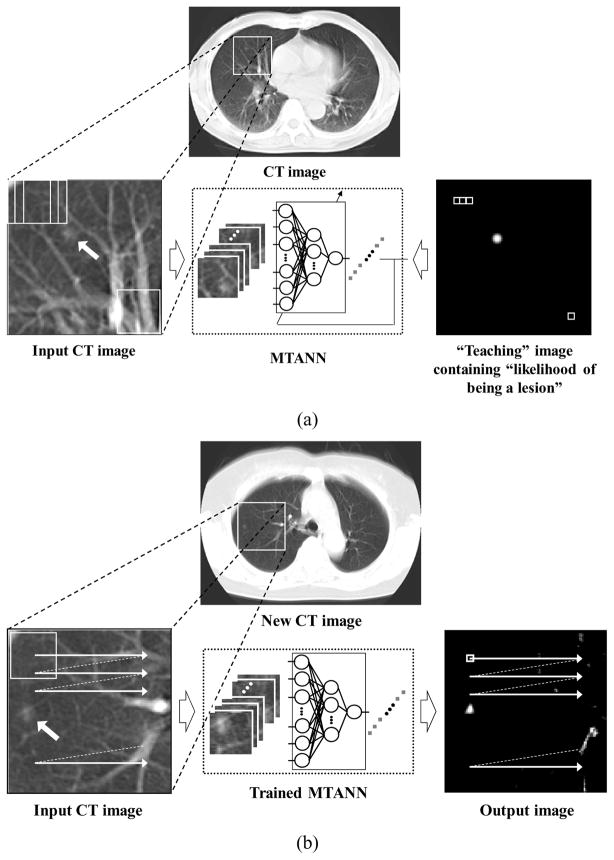
where x and y are the coordinate indices, LORANN (·) is the output of the LORANN model, and I(x, y) is a pixel value in the input image. The LORANN employs a linear function, fL (u) =a·u +0.5, instead of a sigmoid function, fs(u) = 1/{1+exp(−u)}, as the activation function of the output layer unit because the characteristics and performance of an ANN are improved significantly with a linear function when applied to the continuous mapping of values in image processing (Suzuki, Horiba et al. 2003). Note that the activation function in the hidden layers is still a sigmoid function. For processing of the entire image, the scanning of an input CT image with the MTANN is performed pixel by pixel, as illustrated in Fig. 2(b).
Figure 2.
Training and application of an MTANN filter for enhancement of lesions. (a) Training of an MTANN filter. The input CT image is divided pixel by pixel into a large number of overlapping sub-regions. The corresponding pixels are extracted from the “teaching” image containing the “likelihood of being a lesion.” The MTANN filter is trained with pairs of the input sub-regions and the corresponding teaching pixels. (b) Application of the trained MTANN filter to a new CT image. Scanning with the trained MTANN filter is performed for obtaining pixel values in the entire output image.
2.1.2. Training of an MTANN filter
For enhancement of lesions and suppression of non-lesions in CT images, the teaching image T(x, y) contains a map of the “likelihood of being lesions,” as illustrated in Fig. 2(a). To create the teaching image, we first segment lesions manually for obtaining a binary image with 1 being lesion pixels and 0 being non-lesion pixels. Then, Gaussian smoothing is applied to the binary image for smoothing down the edges of the segmented lesions, because the likelihood of being lesions should gradually be diminished as the distance from the boundary of the lesion decreases. Note that the ANN was not able to be trained when binary teaching images were used.
The MTANN filter involves training with a large number of pairs of sub-regions and pixels; we call it a massive-sub-region training scheme. For enrichment of the training samples, a training image, RT, extracted from the input CT image is divided pixel by pixel into a large number of sub-regions. Note that close sub-regions overlap each other. Single pixels are extracted from the corresponding teaching image as teaching values. The MTANN filter is massively trained by use of each of a large number of input sub-regions together with each of the corresponding teaching single pixels; hence the term “massive-training ANN.” The error to be minimized by training of the MTANN filter is given by
| (2) |
where c is a training case number, Oc is the output of the MTANN for the cth case, Tc is the teaching value for the MTANN for the cth case, and P is the number of total training pixels in the training images, RT. The MTANN filter is trained by a linear-output back-propagation algorithm where the generalized delta rule (Rumelhart, Hinton et al. 1986) is applied to the LORANN architecture (Suzuki, Horiba et al. 2003). After training, the MTANN filter is expected to output the highest value when a lesion is located at the center of the sub-region of the MTANN filter, a lower value as the distance from the sub-region center increases, and zero when the input subregion contains a non-lesion.
2.2. Experiments
2.2.1. Database of lung nodules in CT
To test the performance of the MTANN filter, we applied it to our CT database consisting of 69 lung cancers in 69 patients (Li, Sone et al. 2002). The scans used for this study were acquired with a low-dose protocol of 120 kVp, 25 mA or 50 mA, 10-mm collimation, and a 10-mm reconstruction interval at a helical pitch of two. The reconstructed CT images were 512 × 512 pixels in size with a section thickness of 10 mm. The 69 CT scans consisted of 2,052 sections. All cancers were confirmed either by biopsy or surgically. The locations of the cancers were determined by an expert chest radiologist.
2.2.2. Enhancement of nodules in the lungs in CT
To limit processing area to the lungs, we segmented the lung regions in a CT image by use of thresholding based on Otsu’s threshold value determination (Otsu 1979). Then, we applied a “rolling-ball” technique (Hanson 1992), which is a mathematical morphology operator, along the outlines of the extracted lung regions to include a nodule attached to the pleura in the segmented lung regions (Armato, Giger et al. 2001).
To enhance lung nodules in CT images, we trained an MTANN filter with 13 lung nodules in a training database which was different from the testing database and the corresponding “teaching” images that contained maps for the “likelihood of being nodules,” as illustrated in Fig. 2(a). To obtain the training regions, RT, we applied a mathematical morphology opening filter to the manually segmented lung nodules (i.e., binary regions) such that the training regions sufficiently covered nodules and surrounding normal structures (i.e., a 9 times larger area than the nodule region, on average). A three-layer structure was employed for the MTANN filter, because any continuous mapping can be approximated by a three-layer ANN (Funahashi 1989). The number of hidden units was selected to be 20 by use of a method for designing the structure of an ANN (Suzuki, Horiba et al. 2001; Suzuki 2004). The method is a sensitivity-based pruning method, i.e., the sensitivity to the training error was calculated when a certain unit was removed experimentally, and the unit with the smallest training error was removed. Removing the redundant hidden units and retraining for recovering the potential loss due to the removal were performed alternately, resulting in a reduced structure where redundant units were removed. The size of the input sub-region, RS, was 9 by 9 pixels, which was determined experimentally in our previous studies, i.e., the highest performance was obtained with this size (Suzuki, Armato et al. 2003; Arimura, Katsuragawa et al. 2004; Suzuki and Doi 2005); thus, the number of input units in the MTANN filter is 81. The slope of the linear function, a, was 0.01. With the parameters above, training of the MTANN filter was performed by 1,000,000 iterations. To test the performance, we applied the trained MTANN filter to the entire lungs. We applied thresholding to the output images of the trained MTANN filter to detect nodule candidates. We compared the results of nodule-candidate detection with and without the MTANN filter.
2.2.3. A CAD scheme incorporating the MTANN lesion-enhancement
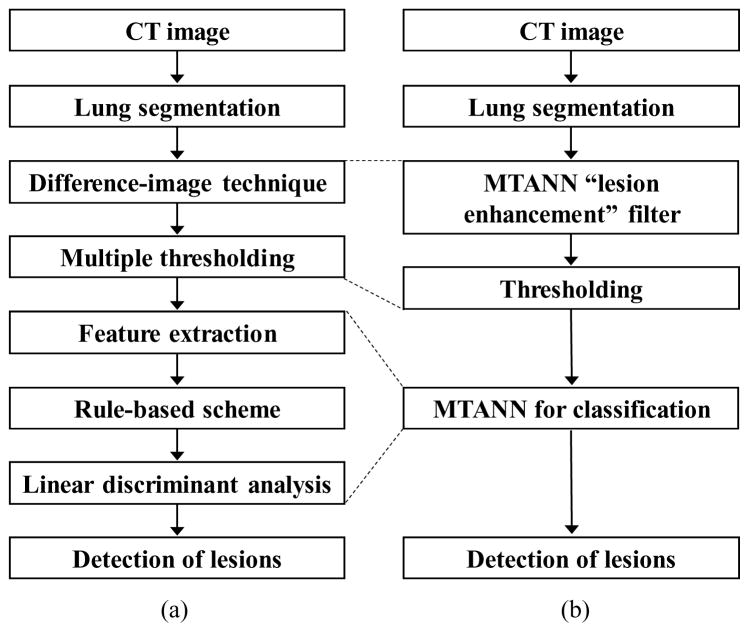
A previously reported CAD scheme (Arimura, Katsuragawa et al. 2004) for lung nodule detection in CT is shown in Fig. 3(a). The CAD scheme employs a standard approach which consists of lung segmentation, a difference-image technique for enhancing nodules (Xu, Doi et al. 1997), multiple thresholding for detection of nodule candidates, feature extraction of the detected nodule candidates, a rule-based scheme for reduction of FPs, and linear discriminant analysis (LDA) for the final FP reduction. The difference-image technique uses two different filters: a matched filter is used for enhancing nodule-like objects in CT images, and a ring-average filter is used for suppressing nodule-like objects.
Figure 3.
Comparison of a standard CAD scheme with an MTANN-based CAD scheme. (a) Schematic diagram of a standard CAD scheme. (b) Schematic diagram of an MTANN-based CAD scheme.
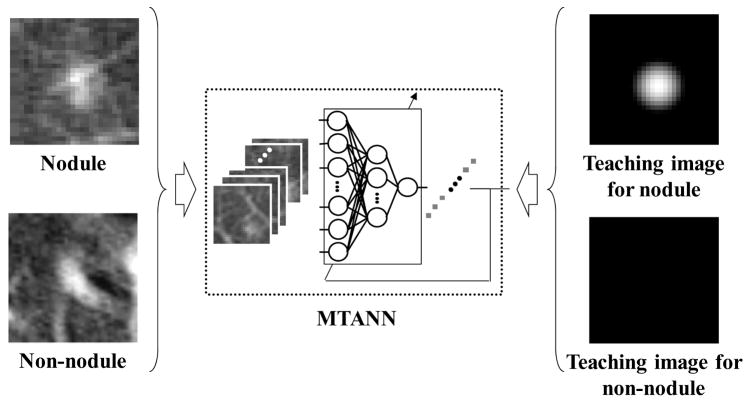
We incorporated the MTANN lesion-enhancement filter in our CAD scheme to improve the overall performance. A schematic diagram of our MTAN-based CAD scheme is shown in Fig. 3(b). In the MTANN-based CAD scheme, nodule candidates are detected (localized) by the MTANN lesion-enhancement filter followed by thresholding. The detected nodule candidates generally include true positives and mostly FPs (If the distance between the center of a nodule and the centroid of a nodule candidate is less than or equal to 10 mm, the candidate is considered a true positive, otherwise an FP). For reduction of the FPs, we used previously reported multiple MTANNs (Suzuki, Armato et al. 2003; Suzuki, Yoshida et al. 2008) for classification of the detected nodule candidates into nodules or non-nodules, i.e., the multiple MTANNs were used as a classifier. The architecture and training of the classification-MTANN are shown in Fig. 4. For distinction between nodules (i.e., true positives) and non-nodules (i.e., FPs), the teaching image contains a 2D distribution of values that represents the “likelihood of being a nodule.” We used a 2D Gaussian distribution, the peak of which is located at the center of a nodule, as a teaching image for a nodule and an image that contains zero (i.e., completely dark) for a non-nodule. We trained 6 classification-MTANNs with 10 typical nodules and 6 different types of 10 non-nodules such as medium-sized vessels, small vessels, and large vessels from a training database, because these 6 types were 6 major sources of FPs based on the visual judgment and knowledge gained from our previous studies (Suzuki, Armato et al. 2003; Arimura, Katsuragawa et al. 2004; Suzuki and Doi 2005). The trained classification-MTANN provided some distribution similar to the teaching 2D Gaussian distribution for a nodule and darker pixels for a non-nodule. A scoring method was applied to the output images of the classification-MTANNs to combine pixel-based output responses into a single score for each nodule candidate. The scores indicating the likelihood of being a nodule from the 6 classification-MTANNs were combined with LDA to form a mixture of expert classification-MTANNs, i.e., a decision boundary in the 6 dimensional score space was determined by using LDA. To compare the performance of the MTANN-based CAD scheme with that of the previously reported CAD scheme (Arimura, Katsuragawa et al. 2004), we applied the two schemes to the same database. We used a leave-one-out cross-validation test for testing the LDA in the mixture of expert MTANNs and the LDA in the standard CAD scheme. We evaluated the performance by using free-response receiver-operating-characteristic (FROC) analysis (Egan, Greenberg et al. 1961).
Figure 4.
Architecture and training of an MTANN for classification of candidates into a nodule or a non-nodule. A teaching image for a nodule contains a Gaussian distribution at the center of the image, whereas that for a non-nodule contains zero (i.e., it is completely dark).
3. Results
3.1. Enhancement of nodules in the lungs on CT images
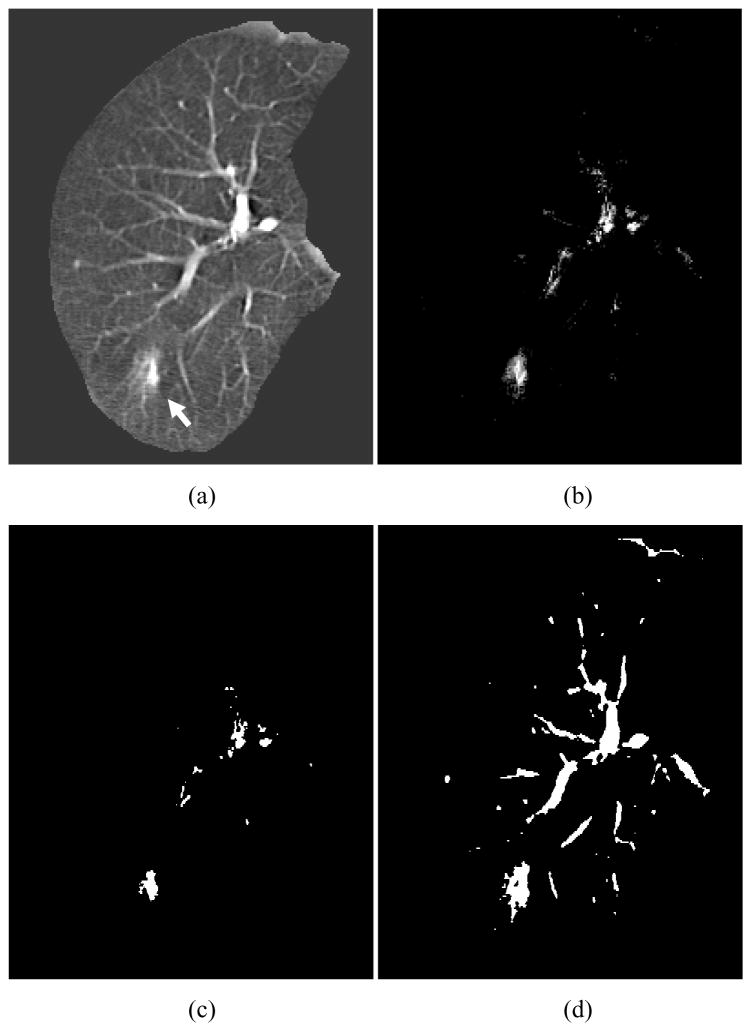
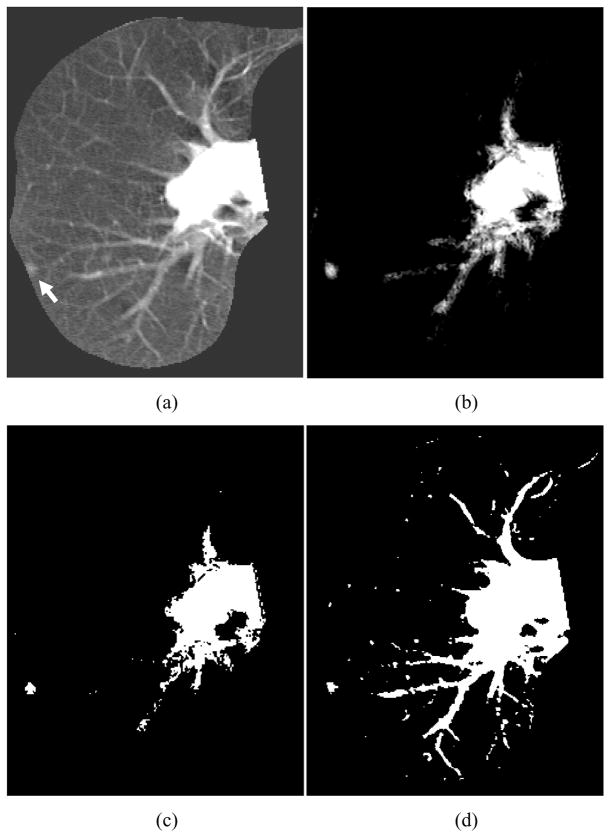
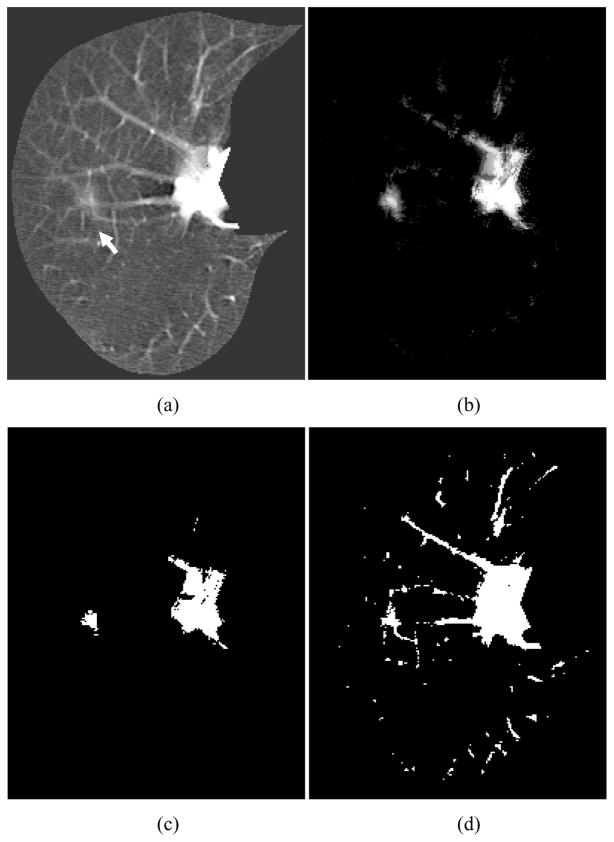
We applied the trained MTANN filter to original CT images. The results of enhancement of nodules in CT images by the trained MTANN filter (Suzuki, Shi et al. 2008) are shown in Figs. 5–7. The MTANN filter enhances nodules and suppresses most of the normal structures in CT images. Although some medium-sized vessels in cases A, B, and C (Figs. 5–7) and some of the large vessels in the hilum in cases B and C (Figs. 6 and 7) remain in the output images, the nodules with spiculation in cases A and B (Figs. 5 and 6) and the nodule attached to the pleura in case C (Fig. 7) are enhanced well. We applied thresholding with a single threshold value (65% of the maximum gray scale) to the output images of the trained MTANN filter. There is a smaller number of candidates in the MTANN-based images, as shown in Figs 5–7(c), whereas there are many nodule candidates in binary images obtained by use of simple thresholding without the MTANN filter, as shown in Figs 5–7(d). Note that the large vessels in the hilum can easily be separated from nodules by use of their area information.
Figure 5.
Enhancement of a lesion by the trained lesion-enhancement MTANN filter for a non-training case (Case A). (a) Original image of the segmented lung with a nodule (indicated by an arrow). (b) Output image of the trained lesion-enhancement MTANN filter. The nodule is enhanced, whereas most of the normal structures are suppressed. (c) Nodule candidates detected by the trained lesion-enhancement MTANN followed by thresholding. (d) Nodule candidates detected by simple thresholding only.
Figure 7.
Enhancement of a lesion by the trained lesion-enhancement MTANN filter for a non-training case (Case C). (a) Original image of the segmented lung with a nodule (indicated by an arrow). (b) Output image of the trained lesion-enhancement MTANN filter. The nodule is enhanced, whereas most of the normal structures are suppressed. (c) Nodule candidates detected by the trained lesion-enhancement MTANN followed by thresholding. (d) Nodule candidates detected by simple thresholding only.
Figure 6.
Enhancement of a lesion by the trained lesion-enhancement MTANN filter for a non-training case (Case B). (a) Original image of the segmented lung with a nodule (indicated by an arrow). (b) Output image of the trained lesion-enhancement MTANN filter. The nodule is enhanced, whereas most of the normal structures are suppressed. (c) Nodule candidates detected by the trained lesion-enhancement MTANN followed by thresholding. (d) Nodule candidates detected by simple thresholding only.
3.2. Performance of a CAD scheme
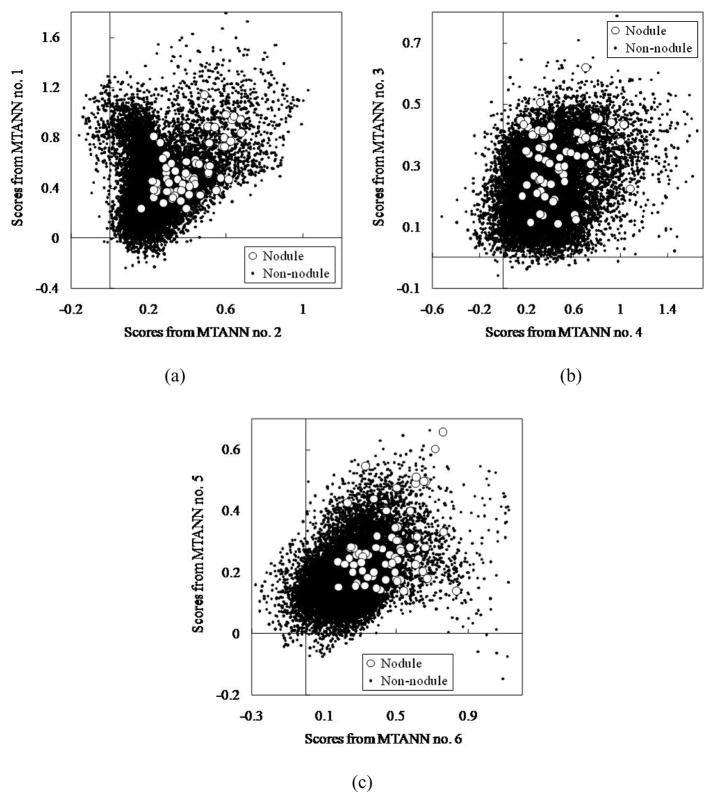
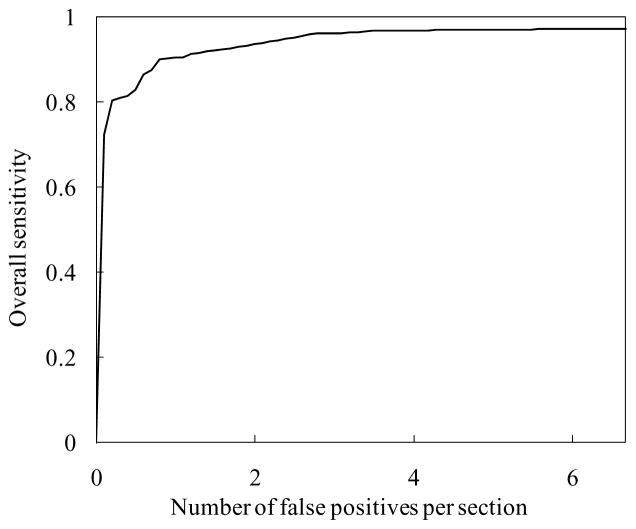
The MTANN filter followed by thresholding identified 97% (67/69) of cancers with 6.7 FPs per section. The 6 classification-MTANNs were applied to the nodule candidates (true positives and FPs) for classification of the candidates into nodules or non-nodules. The scores from the 6 classification-MTANNs are shown in Fig. 8. Although the distributions for nodules and non-nodules overlap, each expert classification-MTANN removes different FPs; thus, many more nodules can be separated from non-nodules by decision boundaries than does a single classification-MTANN. The LDA in the mixture of expert classification-MTANNs determined a hyper-plane for classifying them in the 6-dimensional score space. The FROC curve indicating the performance of the mixture of expert MTANNs is shown in Fig. 9. The mixture of expert MTANNs was able to remove 60% (8,172/13,688) or 93% (12,667/13,688) of non-nodules (FPs) with a loss of 1 true positive or 10 true positives, respectively. Thus, our MTANN-based CAD scheme achieved a 96% (66/69) or 84% (57/69) sensitivity with 2.7 (5,516/2,052) or 0.5 (1,021/2,052) FPs per section, respectively, as shown in Table 1. The remaining true-positive nodules included a ground-glass opacity, a cancer overlapping vessels, and a cancer touching the pleura. In contrast, the difference-image technique followed by multiple thresholding in the previously reported CAD scheme detected 96% (66/69) of cancers with 19.3 FPs per section. Thus, the MTANN lesion-enhancement filter was effective for improving the sensitivity and specificity of a CAD scheme. The feature analysis and the rule-based scheme removed FPs further and achieved 9.3 FPs per section. Finally, with LDA, the previously reported CAD scheme yielded a sensitivity of 84% (57/69) with 1.4 (2,873/2,052) FPs per section (the difference between the specificity of the previously reported CAD scheme and that of our new MTANN-based CAD scheme at the 84% sensitivity level was statistically significant (P < 0.05) (Edwards, Kupinski et al. 2002)). Table 1 summarizes the comparison of the performance of the previously reported CAD scheme with that of the MTANN-based CAD scheme at different stages. Therefore, MTANNs were effective for improving the sensitivity and specificity of a CAD scheme.
Figure 8.
Distributions of scores from the 6 classification-MTANNs for 67 nodules (white circles) and 13,688 non-nodules (black dots) detected by the lesion-enhancement MTANN filter followed by thresholding. (a) Distributions of scores from classification-MTANN nos. 1 and 2. (b) Distributions of scores from classification-MTANN nos. 3 and 4. (c) Distributions of scores from classification-MTANN nos. 5 and 6.
Figure 9.
Performance of the mixture of expert MTANNs for classification between 67 nodules and 13,688 non-nodules. The FROC curve indicates that the mixture of expert MTANNs yielded a reduction of 60% (8,172/13,688) or 93% (12,667/13,688) of non-nodules (FPs) with a loss of 1 true positive or 10 true positives, respectively, i.e., it achieved a 96% (66/69) or 84% (57/69) sensitivity with 2.7 (5,516/2,052) or 0.5 (1,021/2,052) FPs per section, respectively.
Table 1.
Comparison of the performance of the previously reported CAD scheme with that of the MTANN-based CAD scheme at different stages.
| Previously reported CAD scheme | MTANN-based CAD scheme | ||
|---|---|---|---|
| Nodule candidate detection by multiple thresholding | 96% sensitivity with 19.3 FPs/section | Nodule candidate detection by MTANN | 97% sensitivity with 6.7 FPs/section |
| Feature analysis and rule-based scheme | 96% sensitivity with 9.3 FPs/section | Classification by MTANN | 96% sensitivity with 2.7 FPs/section |
| Classification by LDA | 84% sensitivity with 1.4 FPs/section | 84% sensitivity with 0.5 FPs/section | |
4. Discussion
In this study, we used LDA in the mixture of MTANNs instead of the ANN used in our previous studies (Suzuki, Yoshida et al. 2006; Suzuki, Yoshida et al. 2008), because performing a leave-one-out cross-validation test for an ANN with 13,755 samples (67 positive + 13,688 negative samples) takes a tremendous amount of time (i.e., training of 13,755 ANNs is required). Because an ANN can provide a nonlinear boundary as opposed to a linear boundary by LDA, the performance of an ANN-based mixture of expert MTANNs can potentially be higher than that of the LDA-based mixture of expert MTANNs reported in this study. We will need to demonstrate this in the future.
In a previous study (Suzuki, Yoshida et al. 2006), we investigated the effect of the intra- and inter-observer variations in selecting training cases on the performance of an MTANN, because the performance would depend on the manual selection of training cases. The differences in the performance of the trained MTANNs with the three different sets selected by the same observer at different times (i.e., the intra-observer variation) were not statistically significant (two-tailed p-value > 0.05). The differences in the performance of the trained 3D MTANNs depended on which observer selected the training cases (i.e., the inter-observer variation), although these differences were not statistically significant (two-tailed p-value > 0.05). Therefore, changing training nodules for MTANNs could change the performance of MTANNs, but we expect that these changes would not be significant.
In our previous study (Suzuki, Li et al. 2005), we performed an experiment to gain insight into the enrichment of the input information to an MTANN by the division of cases into sub-regions. We examined the relationship between ten training lesions and 76 lesions in the entire database in the input multidimensional vector space. We applied principal-component analysis (also referred to as Karhune-Loeve analysis) (Oja 1983) on the input vector to the MTANN. The result of our analysis showed that the ten training cases represented the entire database of 76 cases very well in the input vector space, i.e., the ten training lesions covered, on average, 94% of the components of each lesion. Because all components of each lesion are combined with the scoring method in the MTANN, the non-covered 6% of components would not be critical at all for the classification accuracy. Thus, the division of each lesion into a large number of sub-regions enriched the input information on lesions for the MTANN. We believe that this enrichment process would contribute to the generalization ability of MTANNs.
In our previous study (Suzuki, Li et al. 2005), we did experiments to examine the effect of the number of MTANNs and that of the number of hidden units on the performance of multiple MTANNs. In the experiments, we used a relatively large database containing 76 malignant nodules and 413 benign nodules in thoracic CT. The result showed that, as the number of MTANNs increased from two to eight, the area under the ROC curve (AUC) value went up from 0.81 and peaked at 0.88 when the number of MTANNs was six, and then declined to 0.84. As to the number of hidden units, as the number of hidden units increased from two to seven, the AUC value went up from 0.84 and peaked at 0.88 when the number of MTANNs was four, and then declined to 0.86. Therefore, we expect that a similar trend would be observed for MTANNs in this study.
A limitation of this study is the number of nodule cases: use of a larger database will provide more reliable evaluation results for the performance of a CAD scheme. However, it should be noted that 69 testing nodule cases are different from 13 training nodules used for the MTANN lesion-enhancement filter or 10 training nodules for the classification MTANN. Therefore, we believe that the results obtained in this study can be generalizable; and we expect that the performance of the MTANN-based CAD scheme for a large database would potentially be comparable to that obtained in this study.
5. Conclusion
The MTANN supervised filter was effective for enhancement of lesions and suppression of non-lesions in medical images and was able to improve the sensitivity and specificity of a CAD scheme substantially.
Acknowledgments
The authors are grateful to S. Sone for providing CT data and to Ms. E. F. Lanzl for improving the manuscript. This work was supported by an American Cancer Society Illinois Division Research Grant, and National Cancer Institute Grant (R01CA120549).
References
- Aoyama M, Li Q, et al. Automated computerized scheme for distinction between benign and malignant solitary pulmonary nodules on chest images. Medical Physics. 2002;29(5):701–8. doi: 10.1118/1.1469630. [DOI] [PubMed] [Google Scholar]
- Arimura H, Katsuragawa S, et al. Computerized scheme for automated detection of lung nodules in low-dose computed tomography images for lung cancer screening. Academic Radiology. 2004;11(6):617–629. doi: 10.1016/j.acra.2004.02.009. [DOI] [PubMed] [Google Scholar]
- Armato SG, 3rd, Giger ML, et al. Automated detection of lung nodules in CT scans: preliminary results. Medical Physics. 2001;28(8):1552–1561. doi: 10.1118/1.1387272. [DOI] [PubMed] [Google Scholar]
- Armato SG, 3rd, Giger ML, et al. Computerized detection of pulmonary nodules on CT scans. Radiographics. 1999;19(5):1303–1311. doi: 10.1148/radiographics.19.5.g99se181303. [DOI] [PubMed] [Google Scholar]
- Armato SG, 3rd, Li F, et al. Lung cancer: performance of automated lung nodule detection applied to cancers missed in a CT screening program. Radiology. 2002;225(3):685–692. doi: 10.1148/radiol.2253011376. [DOI] [PubMed] [Google Scholar]
- Bae KT, Kim JS, et al. Automatic detection of pulmonary nodules in multi-slice CT: performance of 3D morphologic matching algorithm. Radiology. 2002;225(P):476. [Google Scholar]
- Chan HP, Doi K, et al. Image feature analysis and computer-aided diagnosis in digital radiography. I. Automated detection of microcalcifications in mammography. Medical Physics. 1987;14(4):538–548. doi: 10.1118/1.596065. [DOI] [PubMed] [Google Scholar]
- Dean JC, Ilvento CC. Improved cancer detection using computer-aided detection with diagnostic and screening mammography: prospective study of 104 cancers. AJR Am J Roentgenol. 2006;187(1):20–8. doi: 10.2214/AJR.05.0111. [DOI] [PubMed] [Google Scholar]
- Drukker K, Giger ML, et al. Robustness of computerized lesion detection and classification scheme across different breast US platforms. Radiology. 2005;237(3):834–40. doi: 10.1148/radiol.2373041418. [DOI] [PubMed] [Google Scholar]
- Edwards DC, Kupinski MA, et al. Maximum likelihood fitting of FROC curves under an initial-detection-and-candidate-analysis model. Med Phys. 2002;29(12):2861–70. doi: 10.1118/1.1524631. [DOI] [PubMed] [Google Scholar]
- Egan JP, Greenberg GZ, et al. Operating characteristics, signal detectability, and the method of free response. Journal of the Acoustical Society of America. 1961;33:993–1007. [Google Scholar]
- Frangi AF, Niessen WJ, et al. Model-based quantitation of 3-D magnetic resonance angiographic images. IEEE Trans Med Imaging. 1999;18(10):946–56. doi: 10.1109/42.811279. [DOI] [PubMed] [Google Scholar]
- Funahashi K. On the approximate realization of continuous mappings by neural networks. Neural Networks. 1989;2:183–192. [Google Scholar]
- Giger ML, Doi K, et al. Image feature analysis and computer-aided diagnosis in digital radiography. 3. Automated detection of nodules in peripheral lung fields. Medical Physics. 1988;15(2):158–166. doi: 10.1118/1.596247. [DOI] [PubMed] [Google Scholar]
- Giger ML, Suzuki K. Computer-Aided Diagnosis (CAD) In: Feng DD, editor. Biomedical Information Technology. Academic Press; 2007. pp. 359–374. [Google Scholar]
- Gilhuijs KG, Giger ML, et al. Computerized analysis of breast lesions in three dimensions using dynamic magnetic-resonance imaging. Med Phys. 1998;25(9):1647–54. doi: 10.1118/1.598345. [DOI] [PubMed] [Google Scholar]
- Hanson AJ. Graphics Gems III. Cambridge, MA: Academic Press; 1992. The rolling ball; pp. 51–60. [Google Scholar]
- Horsch K, Giger ML, et al. Performance of computer-aided diagnosis in the interpretation of lesions on breast sonography. Acad Radiol. 2004;11(3):272–80. doi: 10.1016/s1076-6332(03)00719-0. [DOI] [PubMed] [Google Scholar]
- Li F, Aoyama M, et al. Radiologists’ performance for differentiating benign from malignant lung nodules on high-resolution CT using computer-estimated likelihood of malignancy. AJR American Journal of Roentgenology. 2004;183(5):1209–1215. doi: 10.2214/ajr.183.5.1831209. [DOI] [PubMed] [Google Scholar]
- Li F, Arimura H, et al. Computer-aided detection of peripheral lung cancers missed at CT: ROC analyses without and with localization. Radiology. 2005;237(2):684–90. doi: 10.1148/radiol.2372041555. [DOI] [PubMed] [Google Scholar]
- Li F, Sone S, et al. Lung cancers missed at low-dose helical CT screening in a general population: comparison of clinical, histopathologic, and imaging findings. Radiology. 2002;225(3):673–683. doi: 10.1148/radiol.2253011375. [DOI] [PubMed] [Google Scholar]
- Lostumbo A, Tsai J, et al. Comparison of 2D and 3D views for measurement and conspicuity of flat lesions in CT colonography. Proc. International Symposium on Virtual Colonoscopy (ISVC); Boston, MA. 2007. [Google Scholar]
- Oja E. Subspace methods of pattern recognition. Letchworth, Hertfordshire, England; New York: Research Studies Press; Wiley; 1983. [Google Scholar]
- Otsu N. A Threshold Selection Method from Gray Level Histograms. IEEE Transactions on Systems, Man and Cybernetics. 1979;9(1):62–66. [Google Scholar]
- Rumelhart DE, Hinton GE, et al. Learning representations by back-propagating errors. Nature. 1986;323:533–536. [Google Scholar]
- Suzuki K. Determining the receptive field of a neural filter. Journal of Neural Engineering. 2004;1(4):228–237. doi: 10.1088/1741-2560/1/4/006. [DOI] [PubMed] [Google Scholar]
- Suzuki K, Abe H, et al. Image-processing technique for suppressing ribs in chest radiographs by means of massive training artificial neural network (MTANN) IEEE Transactions on Medical Imaging. 2006;25(4):406–416. doi: 10.1109/TMI.2006.871549. [DOI] [PubMed] [Google Scholar]
- Suzuki K, Armato SG, et al. Massive training artificial neural network (MTANN) for reduction of false positives in computerized detection of lung nodules in low-dose CT. Medical Physics. 2003;30(7):1602–1617. doi: 10.1118/1.1580485. [DOI] [PubMed] [Google Scholar]
- Suzuki K, Doi K. How can a massive training artificial neural network (MTANN) be trained with a small number of cases in the distinction between nodules and vessels in thoracic CT? Academic Radiology. 2005;12(10):1333–1341. doi: 10.1016/j.acra.2005.06.017. [DOI] [PubMed] [Google Scholar]
- Suzuki K, Horiba I, et al. A simple neural network pruning algorithm with application to filter synthesis. Neural Processing Letters. 2001;13(1):43–53. [Google Scholar]
- Suzuki K, Horiba I, et al. Efficient approximation of neural filters for removing quantum noise from images. IEEE Transactions on Signal Processing. 2002;50(7):1787–1799. [Google Scholar]
- Suzuki K, Horiba I, et al. Neural edge enhancer for supervised edge enhancement from noisy images. IEEE Transactions on Pattern Analysis and Machine Intelligence. 2003;25(12):1582–1596. [Google Scholar]
- Suzuki K, Horiba I, et al. Extraction of left ventricular contours from left ventriculograms by means of a neural edge detector. IEEE Transactions on Medical Imaging. 2004;23(3):330–339. doi: 10.1109/TMI.2004.824238. [DOI] [PubMed] [Google Scholar]
- Suzuki K, Li F, et al. Computer-aided diagnostic scheme for distinction between benign and malignant nodules in thoracic low-dose CT by use of massive training artificial neural network. IEEE Transactions on Medical Imaging. 2005;24(9):1138–1150. doi: 10.1109/TMI.2005.852048. [DOI] [PubMed] [Google Scholar]
- Suzuki K, Shi Z, et al. Supervised enhancement of lesions by use of a massive-training artificial neural network (MTANN) in computer-aided diagnosis (CAD). Proc. Int. Conf. Pattern Recognition (ICPR); Tampa, FL. 2008. [Google Scholar]
- Suzuki K, Shiraishi J, et al. False-positive reduction in computer-aided diagnostic scheme for detecting nodules in chest radiographs by means of massive training artificial neural network. Academic Radiology. 2005;12(2):191–201. doi: 10.1016/j.acra.2004.11.017. [DOI] [PubMed] [Google Scholar]
- Suzuki K, Yoshida H, et al. Mixture of expert 3D massive-training ANNs for reduction of multiple types of false positives in CAD for detection of polyps in CT colonography. Med Phys. 2008;35(2):694–703. doi: 10.1118/1.2829870. [DOI] [PubMed] [Google Scholar]
- Suzuki K, Yoshida H, et al. Massive-training artificial neural network (MTANN) for reduction of false positives in computer-aided detection of polyps: Suppression of rectal tubes. Medical Physics. 2006;33(10):3814–3824. doi: 10.1118/1.2349839. [DOI] [PubMed] [Google Scholar]
- van Ginneken B, ter Haar Romeny BM, et al. Computer-aided diagnosis in chest radiography: a survey. IEEE Transactions on Medical Imaging. 2001;20(12):1228–1241. doi: 10.1109/42.974918. [DOI] [PubMed] [Google Scholar]
- Xu XW, Doi K, et al. Development of an improved CAD scheme for automated detection of lung nodules in digital chest images. Medical Physics. 1997;24(9):1395–1403. doi: 10.1118/1.598028. [DOI] [PubMed] [Google Scholar]
- Yoshida H, Nappi J. Three-dimensional computer-aided diagnosis scheme for detection of colonic polyps. IEEE Trans Med Imaging. 2001;20(12):1261–74. doi: 10.1109/42.974921. [DOI] [PubMed] [Google Scholar]


