

Abstract
C-reactive protein (CRP), an inflammatory marker of cardiovascular risk, is often elevated in major depressive disorder (MDD). The magnitude and consistency of this elevation have not been previously characterized in premenopausal women with MDD. The aim of the study was to prospectively assess plasma CRP levels, body composition, endocrine and metabolic parameters, and depressive status in premenopausal women with MDD (n = 77) and controls (n = 41), aged 21 to 45. Women were enrolled in a 12-month, controlled study of bone turnover, the P.O.W.E.R. (Premenopausal, Osteoporosis, Women, Alendronate, Depression) Study. Blood samples were taken at Baseline, Month 6, and Month 12. Most subjects with MDD were in clinical remission. These women tended to have consistently higher CRP levels than controls over 12 months (p = 0.077). BMI was positively related to log[CRP] in women with MDD only. Nine women with MDD had CRP levels greater than 10 mg/l, a value associated with a very high cardiovascular risk. This subset was obese and had significantly higher triglycerides, total cholesterol, LDL-cholesterol, fasting insulin, and HOMA-IR than the rest of women with MDD. The variations in CRP levels over time were high (intra- and inter-individual coefficients of variations of ∼30–50% and ∼70–140%, respectively). No control had CRP levels greater than 10 mg/l. Depression was associated with increased plasma CRP in women with MDD. The clinical significance of abnormal plasma CRP for cardiovascular risk needs to be assessed in large prospective studies of women with depression.
Keywords: obesity, women's health, inflammation, cytokine, cardiovascular morbidity, metabolic syndrome
Introduction
Major depression (MDD) is more common in subjects with coronary artery disease (CAD) than in the general population, with prevalence ranging from 17 to 30% [1–3]. Depression may be predictive of CAD [4–6], although life style factors such as poor diet, lack of exercise, excessive smoking, and poor compliance with medical treatment may also contribute. Sub-clinical inflammation may also cause CAD: subjects with depression often exhibit immune imbalance, altered endothelial function, and other inflammatory features [7]. We previously reported that premenopausal women with MDD had increased levels of prothrombotic factors [8], which may induce coronary or aortic calcification and plaque formation [9, 10].
C-reactive protein (CRP), a nonspecific marker of inflammation, is now regarded as a risk factor for cardiovascular events and abnormal CRP added prognostic value to the 10-year Framingham risk score estimates, which is based on total cholesterol, HDL cholesterol, smoking, and systolic blood pressure [11]. Recently, it has been proposed to include CRP as a clinical criterion for the metabolic syndrome as well [12].
In the Women's Health Study, a large, prospective study, CRP values were stronger predictors of first time cardiovascular events than LDL cholesterol levels [13]. Elevated plasma levels of CRP have been observed in a cross-sectional fashion in subjects with depression [14–25], but the existence of a causal relationship between depression and CRP remains controversial [26]. More recently, not only depression per se but also personality traits that increase the susceptibility to develop depression, such as harm avoidance and self directness have been associated with increased CRP in women [27]. However, no such association was found in the Heart and Soul Study, a large, cohort study of elderly men and women with coronary artery disease [28]. Similarly, CRP levels and depressive status were not related to each other in a large sample of middle-aged and older Chinese men [29]. It is possible that demographic factors such as age, sex, and ethnicity modulate and potentially confound the association between depression and CRP. Although young to middle-aged Caucasian women with past history of depression greatly contribute to the life-time prevalence of depression in the general population [30], prospective information for supporting a causal link between CRP levels and MDD in this group is limited.
CRP is being proposed as a marker clinically useful for following prospectively subjects with cardiovascular conditions, however, only limited information on the variability of CRP over time exists. The reported variability over a week is approximately 30–50%, underlining the importance of performing serial sampling, especially if the values are in a high range [31]. Of note, a diurnal variation in CRP levels with a peak at 15:00, as well as a small seasonal variation with highest values at winter-time were recently noted in a 45-year old population of a large cohort study of healthy men and women [32].
The goal of this study was to prospectively assess whether premenopausal women with MDD, most in clinical remission, have abnormal CRP levels over an extended period of time. To accomplish this goal we measured CRP levels at Baseline, Month 6, and Month 12 in a sample of 21–45 years old women with history of MDD and in age-matched healthy controls.
Materials and Methods
Study design
This ancillary study was conducted as part of the P.O.W.E.R. (Premenopausal, Osteoporosis, Women, Alendronate, Depression) Study, a prospective trial of bone turnover in 21–45 years old premenopausal women with MDD and controls. Recruitment was conducted from July 1, 2001 to February 29, 2003 in the Washington, DC, metropolitan area. Further details on study design have been reported elsewhere [8,33]. The study was approved by the Scientific Review Board and the Institutional Review Board of the National Institute of Mental Health.
Study subjects
A total of 89 women with MDD and 44 healthy control women participated in the POWER study. Recruitment for both the experimental and the control group was conducted in the Washington, DC, metropolitan area by advertising in newspapers, radio, internet, and flyers. Forty-four control women were individually matched with a subset of 44 patients with MDD based on age (± 3 years) and BMI (± 2.0). Except for 2 pairs, all other pairs were also matched by self-defined race. Women with depression were enrolled if they met DSM-IV criteria for MDD and had experienced a depressive episode in the preceding three years. Current depression was defined as a depressive episode diagnosed up to 1 month prior to enrollment with severity assessed by the Hamilton Depression (HAM-D, 24 questions) and Hamilton Anxiety scales. None of the participants had clinical CAD, as assessed by history and clinical examination.
We report here on a subset of participants (77 subjects with MDD and 41 controls) who had baseline CRP measurements. Of these, 64 subjects with MDD and 35 controls had also CRP measurements at Month 6 and/or at Month 12. Although the subset was based on serum availability, there were no clinical differences between subjects who had multiple CRP measurements and the subjects who did not (data not shown).
Procedures
Participants were evaluated at Baseline, Month 6, and 12 Month. At Baseline, the Structured Clinical Interview for DSM-IV was administered. At each visit, they received a history, physical examination, and laboratory screening with fasting blood and 24-h urine collection. Waist circumference, bone mineral density (BMD), and body composition (fat and lean mass) were measured as previously described [33]. The Hamilton scale for depression and for anxiety was administered at Baseline, Month 6, and Month 12.
Blood and urine tests
Fasting blood was collected between 8 and 10 AM. All laboratory tests were performed at the Department of Laboratory Medicine, CC, NIH and had inter/intra-assay imprecision of <10%. We used a high sensitivity chemiluminescent immunometric assay for CRP with a detection limit of 0.1 mg/l (Immulite 2000, Siemens/DPC, Los Angeles, California, USA). Serum cortisol and urinary free cortisol (UFC) concentrations were measured using competitive chemiluminescent immunoassays (Immulite 2000). Plasma ACTH and serum insulin were measured by chemiluminescent immunometric assays (Immulite 2000). Insulin resistance was calculated using homeostasis model assessment for insulin resistance (HOMA-IR). Lipid parameters (total cholesterol, LDL-C, HDL-C, and triglycerides), and glucose were assayed by routine chemistry methods on automated analyzers (Synchron LX-20, Beckman-Coulter, Brea, California, USA).
Statistical analysis
We assessed normality by the Kolmogorov–Smirnov test and log transformed the CRP values because of their skewed distribution. We plotted the frequency distribution of CRP values in women with MDD and controls and performed an independent sample t-test for differences in distributions. We tested associations between log CRP and psychiatric, metabolic, and hormonal variables by Pearson and Spearman correlations. We used ANOVA or t-test for continuous variables and Chi-square or Fisher exact test for categorical variables. We used an analysis of covariance to examine the relationships among CRP, BMI, and MDD. Inter- and intra-coefficient of variations (CV) were computed for CRP on subjects who had more than 1 measurement over time. Differences in log CRP levels between control women and women with MDD were assessed nonparametrically using the Mann–Whitney U-test. We further analyzed the relationship between BMI and log CRP levels by linear regression. We set the p value at 0.05 with 2-sided level of significance. We report all data as mean ±SD.
Results
Characteristics of study subjects
Table 1 describes the demographic and clinical characteristics of healthy control women and women with MDD. The two groups were similar for demographic parameters. Regarding psychiatric parameters, the patients with MDD were mildly depressed at the time of examination, as indicated by low Hamilton depression and anxiety scores, which capture these parameters over the previous 2 weeks. These patients had, on average, a cumulative history of depression of approximately five years and five episodes of depression. Age of onset of depression was in the late teens and one-half of the patients with MDD also suffered or had previously suffered from anxiety disorders. Eighty-four percent of these women were taking antidepressants. The metabolic and endocrine characteristics of study subjects are shown in Table 2. It is apparent that, despite similar demographic characteristics, BMI, waist circumference and some of the lipid parameters were significantly higher in women with MDD than in controls. The distribution of BMI values was different between groups: 4 out 41 (10%) of controls and 24 out of 79 (30%) of women with MDD had a BMI greater than 30.
Table 1.
Demographic and clinical characteristics of healthy control women and women with MDD at baseline
| Controls (n = 41) | All MDD (n = 77) | MDD with CRP < 10 mg/l (n = 68) |
MDD with CRP ≥ 10 mg/l (n = 9) |
|
|---|---|---|---|---|
| Demographic Characteristics | ||||
| Age (years) | 35.2 ± 7 | 35.5 ± 7 | 35.8 ± 7 | 32.8 ± 6 |
| Race: white (%) | 90 | 90 | 88 | 100 |
| Current smoker (%) | 10 | 12 | 13 | 0 |
| Birth control pill use (%) | 37 | 30 | 27 | 56 |
| Years of education | 16.4 ± 2.1 | 16.6 ± 1.9 | 16.6 ± 2.0 | 16.4 ± 1.5 |
| Estimated alcohol intake (g/day) | 7 ± 12 | 5 ± 6 | 5 ± 6 | 3 ± 2 |
| Cooper test (cumulative meters) | 1428 ± 267 (n = 20) | 1300 ± 331 (n = 36) | 1314 ± 345 (n = 32) | 1186 ± 160 (n = 4) |
| Psychiatric Characteristics | ||||
| Hamilton depression score | 1.5 ± 2† | 9 ± 7† | 9 ± 7 | 7 ± 6 |
| Hamilton anxiety score | 1.4 ± 2† | 7 ± 5† | 7 ± 5 | 5 ± 3 |
| Age of onset of depression (years) | N/A | 19.5 ± 9 (n = 49) | 19.3 ± 9 (n = 42) | 20.4 ± 7 (n = 7) |
| Number of depressive episodes | N/A | 5 ± 3 (n = 49) | 5 ± 3 (n = 42) | 4 ± 3 (n = 7) |
| Cumulative duration of depression (months) | N/A | 62 ± 70 (n = 49) | 65 ± 73 (n = 42) | 46 ± 43 (n = 7) |
| Antidepressant use (%) | N/A | 84 | 82 | 100 |
Values are expressed as mean ± SD. N/A: not applicable.
Significant at α = 0.05, p < 0.0001
Table 2.
Metabolic and endocrine parameters in healthy control women and women with MDD, stratified according to CRP levels at Baseline
| Controls (n = 41) | All MDD (n = 77) | p-Value | MDD with CRP < 10 mg/l (n = 68) |
MDD with CRP ≥ 10 mg/l (n = 9) |
p–Value | |
|---|---|---|---|---|---|---|
| Body mass index (BMI) (kg/cm2) | 24 ± 4 | 26.5 ± 6 | 0.010 | 26 ± 6 | 33.8 ± 5 | 0.0001 |
| Abdominal circumference (cm) | 86 ± 9 | 92 ± 15 | 0.0001 | 91 ± 14 | 104 ± 11 | 0.0001 |
| Fat mass (%) | 31.3 ± 5 | 33.7 ± 8 | 0.067 | 32.2 ± 8 | 44.4 ± 5 | 0.0001 |
| Lean mass (kg) | 44.9 ± 6 | 45.2 ± 8 | 0.072 | 44.7 ± 8 | 48.9 ± 7 | 0.229 |
| Fasting insulin (uU/ml) | 6.6 ± 4 | 7.5 ± 6 | 0.052 | 7.8 ± 6 | 13.8 ± 7 | 0.002 |
| Fasting glucose (mg/dl) | 87.6 ± 10 | 89 ± 10 | 0.480 | 88.9 ± 11 | 89.2 ± 7 | 0.778 |
| HOMA-IR | 1.5 ± 1.1 | 1.9 ± 2 | 0.070 | 1.8 ± 1.4 | 3.1 ± 1.9 | 0.007 |
| Triglycerides (mg/dl) | 76 ± 33 | 114 ± 73 | 0.0001 | 108 ± 72 | 164 ± 55 | 0.0001 |
| Total cholesterol (mg/dl) | 173 ± 26 | 185.6 ± 32 | 0.36 | 183 ± 31 | 203 ± 36 | 0.016 |
| LDL-C (mg/dl) | 106 ± 23 | 118.2 ± 28 | 0.020 | 116 ± 27 | 135 ± 37 | 0.008 |
| HDL-C (mg/dl) | 59 ± 12 | 57.0 ± 14 | 0.488 | 57 ± 14 | 54 ± 12 | 0.578 |
| 8 AM ACTH (pg/ml) | 23.5 ± 8.2 (n = 28) | 29.4 ± 17 (n = 62) | 0.091 | 30.52 ± 18 (n = 54) | 21.8 ± 9.6 (n = 8) | 0.191 |
| 8 AM Cortisol (μg/dl) | 20.7 ± 8 (n = 29) | 20.6 ± 7 (n = 65) | 0.932 | 20.1 ± 6 (n = 56) | 23.4 ± 7 | 0.167 |
| Urinary free cortisol (μg/24 h) | 62.2 ± 23 (n = 40) | 57.1 ± 28 (n = 77) | 0.328 | 56.2 ± 27 (n = 68) | 63.5 ± 42 | 0.473 |
Values are expressed as mean ± SD. Conversion Factors: mmol/l cholesterol: mg/dl × 0.0259; pmol/l ACTH: pg/ml × 0.22; nmol/l cortisol: μg/dl × 27.59; mmol/l glucose: mg/dl × 0.0555; pmol/l insulin: uU/ml × 6.945; mmol/l triglycerides: = mg/dl × 0.0113
CRP Levels in women with MDD and control women at baseline and over a 12-month follow-up
CRP levels at Baseline are depicted in Fig. 1. Since CRP levels do not follow a Gaussian distribution, it was deemed appropriate to analyze the data by box plots (Fig. 1A) and percentile distribution (Fig. 1B). We found CRP levels above 10 mg/l, a value associated with a markedly increased cardiovascular risk, in 9 women with depression but in none of the controls. In addition, women with MDD showed a greater spread in the distribution of CRP values above the median and a greater number of outlier values. An independent sample t-test performed on log-transformed CRP levels showed a trend (p = 0.077) towards higher values in women with MDD. Mixed models analysis using data from all visits yielded similar results (data not shown). Above the 75th percentiles, CRP levels were more than twice as high in women with MDD as in controls (inset to Fig. 1B).
Fig. 1.
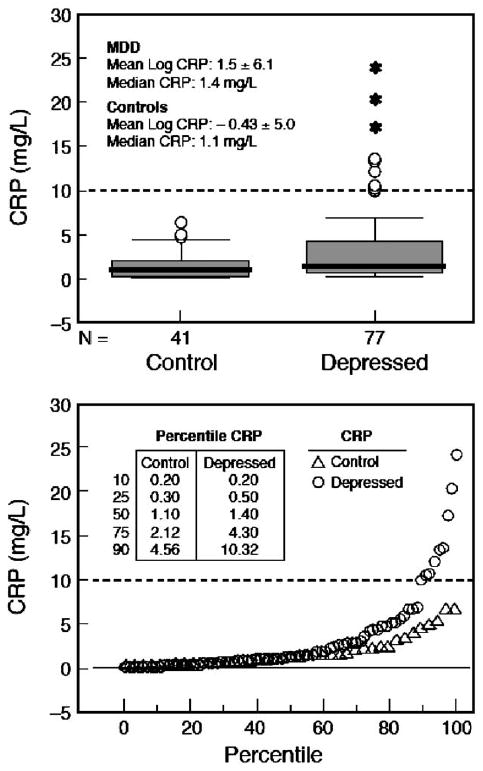
Analysis of baseline CRP levels in women with MDD and healthy control women. A. Box plots showing median, quartiles, and extreme values. The box represents the values between the 25th and 75th percentiles. The horizontal bar across each box represents the median value. Asterisks represent extreme values (values more than 3 box lengths from the upper edge of box). Open circles represent outliers (values between 1.5 and 3 box lengths from upper edge of box). One depressed subject with high CRP levels (29.3 mg/l) had reported recovery from an acute infection at the time of visit and was therefore excluded from the analyses. B. Percentile distribution of CRP values. CRP values for select percentiles are shown in the inset table. At the uppermost percentile (75th), women with MDD have CRP levels over twice as high as control women. The dashed line marks the CRP level of 10 mg/l above which there are only MDD subjects.
Individual CRP levels obtained over a 12-month period are depicted in Fig. 2. In the majority of controls (Fig. 2A), CRP levels were below 2 mg/l at Baseline and remained below this value at Month 6 month and at Month 12. Only a minority of controls, approximately one-quarter, at Baseline had CRP levels between 2 mg/l and 7 mg/l, representing moderate to high cardiovascular risk. In these subjects there was a more accentuated variability over time compared to the rest of the controls, up to 3-fold baseline values.
Fig. 2.
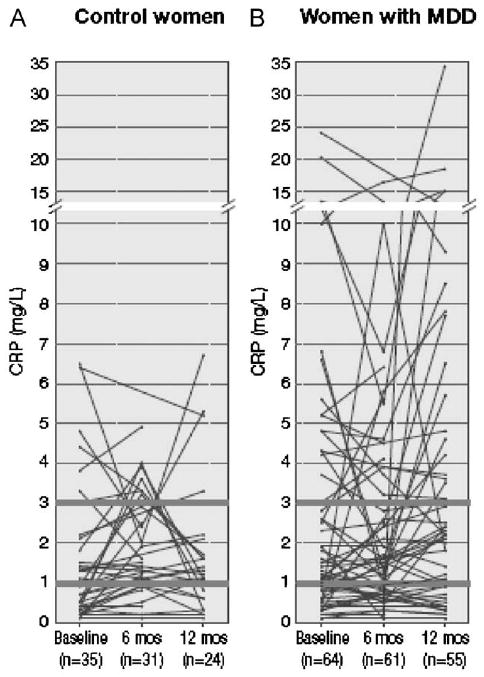
Individual plots of CRP values at Baseline, Month 6, and Month 12. Only subjects with at least 2 prospective measurements of CRP are plotted. Heavy lines indicate beginning of moderate (> 1–3 mg/l) and high (>3 mg/l) cardiovascular risk CRP levels.
Similar to control subjects, approximately one-fourth of women with MDD had CRP values above 2 mg/l but, unique to this group, several of these women had CRP values greater than 10 mg/l, which carries a markedly increased cardiovascular risk (Fig. 2B). Furthermore, as evident from visual inspection in most of the subjects who had CRP values above 10 mg/l at Baseline, CRP levels remained above 10 mg/l at Month 6 and Month 12. The variability over time in CRP levels was accentuated in these subjects, several-folds the baseline values. Of note, in women with MDD the Hamilton's score for depression, expressed as mean and 95% confidence intervals (CI) were low, indicating clinical remission and remained low over time. Specifically, Baseline mean was 9.1; 95% CI: 7.6–10.6, Month 6 mean was 9.5; 95% CI 7.6–11.3, and Month 12 mean was 9.1; 95% CI 7.3–10.9.
Inter- and intra-individual variability of CRP measurements
Table 3 reports the mean and standard deviation, the range and the inter-individual CV for CRP in control women and in women with MDD who had at least 2 CRP measurements over a 12-month period. Likely due to the large inter-individual variations, CRP levels in MDD subjects were weakly to borderline significantly higher over controls only at Baseline and at 12 months (Table 3). The inter-individual CVs were similar whether subjects with 2 or 3 CRP measurements or only subjects with 3 CRP measurements were included in the calculations. Furthermore, the inter-individual CVs were similar among controls and MDD patients and ranged from ∼70% to ∼140% (Table 3). The intra-individual CVs were also similar between groups, but they amounted only to less than half of the inter-individual CVs. In control women, the intra-individual CVs averaged 42% (range, 0–139, n = 35) for all cases and 50% (range, 0–139, n = 20) for cases with all 3 CRP determinations. In patients with MDD, the intra-individual CVs averaged 39% (range, 0–159, n = 64) for all cases and 41% (range, 0–159, n = 50) for cases with all 3 CRP determinations.
Table 3.
CRP levels (mg/l) and inter-individual coefficients of variation (CV) for CRP over a 12-month follow-up
| Baseline | Month 6 | Month 12 | ||||
|---|---|---|---|---|---|---|
| Controls | MDD | Controls | MDD | Controls | MDD | |
| Women with 2 or 3 CRP measurements | ||||||
| Mean ± S.D. | 1.57 ± 1.74 | 3.40 ± 4.79 | 1.80 ± 1.27 | 2.88 ± 3.51 | 1.71 ± 1.74 | 4.45 ± 6.14 |
| p-Value* | 0.075 | 0.65 | 0.052 | |||
| (Range) | (0.10–6.50) | (0.10–24.00) | (0.10–4.90) | (0.10–16.40) | (0.10–6.70) | (0.10–34.20) |
| CV | 111% (n = 35) | 141% (n = 64) | 71% (n = 31) | 122% (n = 60) | 102% (n = 24) | 138% (n = 54) |
| Only women with all 3 CRP measurements | ||||||
| Mean ± S.D. | 1.38 ± 1.79 | 2.83 ± 3.69 | 1.80 ± 1.2 | 2.67 ± 3.41 | 1.45 ± 1.67 | 4.51 ± 6.20 |
| p-Value* | 0.062 | 0.88 | 0.012 | |||
| (Range) | (0.10–6.50) | (0.10–13.50) | (0.10–4.00) | (0.10–16.40) | (0.10–6.70) | (0.10–34.20) |
| CV | 130% (n = 20) | 130% (n = 50) | 72% (n = 20) | 127% (n = 50) | 115% (n = 20) | 137% (n = 50) |
Mann –Whitney U-test on log-transformed CRP values
Relationship between CRP Levels and BMI
We further explored in each group the relationship between CRP and BMI by performing a regression analysis of BMI versus log CRP values (Fig. 3). In women with depression BMI was strongly related to CRP and accounted for 39% of the variability in log CRP levels (R2 = 0.39; p < 0.0001). In contrast, no relationship was found between these two factors in healthy control women. CRP was significantly related to MDD (p = 0.01) and BMI (p = 0.01) and there was a significant interaction between MDD and BMI (p = 0.009).
Fig. 3.
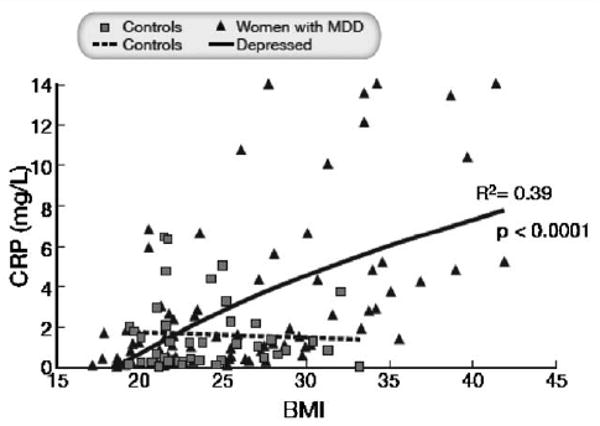
Regression analysis of BMI versus CRP baseline levels in control women and in women with MDD. BMI was related to CRP in women with depression (R2 = 0.39; p < 0.0001) but not in control subjects. Three women with MDD had CRP values greater than 14 mg/l and these values were equated to 14 mg/l for graphical reasons. Results were similar at Month 6 and Month 12 (data not shown)
Subset analysis of women with ≥ 10 mg/l CRP
The subset of women with MDD who had unusually high (≥ 10mg/l) CRP levels was approximately 3 years younger, did not smoke, more often used the birth control pill, tended to have a lower alcohol intake, and covered a shorter distance in the Cooper test (Table 1). These women were also heavier and had greater waist circumference and higher fat mass, fasting insulin, HOMA, triglycerides, total cholesterol, and LDL cholesterol, all alterations reminiscent of the metabolic syndrome (Table 2). Eight AM plasma ACTH, and 24-h UFC were similar in the two groups, while 8 AM cortisol tended to be higher in the subset of women with MDD and unusually high CRP levels. Of note is that indices of MDD in the subset were similar to the rest of the women with MDD (Table 1).
Discussion
Premenopausal women with MDD, most in clinical remission, had higher CRP levels than age-matched healthy control women during a 12-month follow-up. Furthermore, CRP levels were above 10 mg/l, a level associated with high cardiovascular risk, in a subset of women with depression and in none of the controls [34]. BMI was directly related to CRP in women with depression but not in control women, suggesting a synergy between adiposity and BMI in patients with MDD. Depressive symptoms in obese men are known to increase the association between weight and CRP [35].
Apart from MDD in the study group, our sample consisted of healthy women, relatively young, and of higher educational status. There were few smokers and alcohol intake was modest. Higher CRP levels in women with MDD were associated with slightly lower alcohol intake than in controls. However, none of the women with MDD and high CRP levels were current smokers. Smoking is known to increase CRP levels [36]. Given the similar demographic characteristics of the MDD and control study subjects, the increased CRP levels in women with MDD are unlikely related to different life style habits, except for a possible minor effect of lower alcohol intake [37].
Abnormal CRP suggests sub-clinical inflammation, which has been often associated with severe depression, but rarely reported in milder forms of depression or in young and clinically healthy subjects. Of note, the increase in CRP levels reported here was not an isolated phenomenon but rather was part of an unfavorable immune and inflammatory profile, which includes plasma as well as sweat increases in the proinflammatory cytokines TNF alpha, IL-2, IL-6, IL-8, and in the neuropeptides NPY, SP and CGRP, as we have recently reported in a related publication [38]. This finding is consistent with a prospective 12-month study in which apparently healthy subjects with high CRP levels also had high levels of other inflammatory markers such as plasminogen activator inhibitor-1, MMP-9, fibrinogen, as well as LPS-stimulated IL-1 beta, IL-6, and TNF [39].
In the Women's Health Study, a large, prospective cohort study of initially healthy women, elevated CRP levels had similar or better predictive values than lipids for cardiovascular events and stroke [34]. In the same study, CRP was associated with an increased risk of hypertension [40]. It is now believed that CRP contributes to global cardiovascular risk as much as total cholesterol, and HDL or LDL cholesterol [41].
Mostly due to a subset, women with MDD had higher BMI, waist circumference and fat mass than controls and, within the depressed group, subjects with higher BMI were those who had higher CRP. Although free of clinical diabetes, the subset of women with MDD and unusually high (≥ 10mg/l) CRP level had higher fasting insulin and HOMA index, an accepted indicator of insulin resistance. They also had higher triglycerides and total and LDL cholesterol. The higher BMI associated with greater waist circumference and fat mass is particularly important because the adipose tissue is a documented source of cytokines, including IL-6 [42], a main regulator of CRP production in the liver. Our observation that many of the women with MDD had at least some of the components of the metabolic syndrome is consistent with findings of the NHANES Study [43]. In that study, women with depression had two times higher rates of metabolic syndrome than controls.
Most women with MDD (84%) were taking antidepressants at the time of our study. Treatment with antidepressants has been associated with modest weight gain; tricyclics usually cause a dose- and duration-dependent weight gain of approximately 3–4kg, whereas the effects of SSRIs are more variable as they are characterized by an initial weight loss, followed by a modest weight gain of approximately 2 kg after 1 year of treatment [44]. Substantial inter-individual variability to weight gain is observed. The most common antidepressant drug in our study of women with MDD involved the use of selective serotonin uptake inhibitors (SSRIs), therefore it is possible that part of the weight gain in these women was due to these drugs. Given the long-term nature of this study it would have not been feasible to follow these subjects off medication.
The clinical usefulness of consecutive CRP measurements and their tempo is currently the object of active debate. In a large prospective cohort study of initially healthy middle-age women, high sensitivity CRP levels were independently associated with future cardiovascular events with odds ratio of approximately 3 [45]. In contrast, the clinical utility of CRP in patients with acute coronary disease in predicting future cardiovascular events was limited [46]. To our knowledge, no prospective measurements of CRP have been conducted over an extended period of time in this specific patients population, women with MDD, although measurements taken 6 days apart in a similar population have been found to be stable [21]. Measuring CRP at 6 months interval for 12 months in women with depression and in healthy controls allowed us to make a number of clinically relevant observations. As far as women with MDD are concerned, we learnt that at least a subset harbored for an extended period of time high cardiovascular risk, as indicated by high CRP levels. We also noticed that even in a group of apparently healthy subjects, some individuals had consistently CRP values above 3, which is in the range of high cardiovascular risk.
Consistent with previous reports of CRP measurements over time [31,47], the intra-individual CVs for CRP were large, between 30% and 50% on average, in our study as well. Therefore, as a valid alternative to sampling each individual more than once in order to determine the typical value for that individual we suggest to re-test only subjects with a high initial value. For this population of premenopausal women mostly on the birth control pill, a factor known to increase CRP levels, the proposed “high value” would be greater than 2mg/l. As expected, the inter-individual CVs for CRP were even higher (about 2-times) than the intra-individual CVs, amounting to about 70–140 %. The large biological variation in CRP levels necessitates large-scale studies for obtaining reliable results.
We identified a subset with unusually high CRP levels (≥ 10mg/l). Given the small size of this subgroup and the non-normal distribution of CRP, it is not clear whether this phenomenon was simply a sampling issue or whether some women with MDD are more susceptible to increased CRP levels, possibly because of a genetic predisposition. Recently, polymorphisms of the CRP gene have been reported, contributing to inter-individual variability in CRP levels and increased cardiovascular risk [48]. In future studies, women with depression and elevated CRP levels should be prospectively followed to monitor the rate of cardiovascular events. Although only women with depression had markedly elevated CRP levels, it is also difficult to ascertain whether these high CRP levels were due to depression or increased BMI or to a synergy between the two factors. Further, because of the different BMI distribution in the two groups, it is not possible to exclude the presence of a similar relationship between BMI and CRP at the higher BMI values in otherwise healthy women.
The strengths of our study include the fact that this population was homogenous and well characterized and we analyzed the relationship between CRP and depression prospectively. The 12-month follow-up was longer than in most studies. Since the intra-individual variability of CRP levels over time is approximately 30–50% and the distribution is wide and skewed, it was important to perform determinations of CRP over an extended period of time [47], as well as accounting for seasonality. A seasonal variation in CRP levels, albeit small, has been reported [32,49]. Since our healthy controls and patients were both enrolled randomly throughout the year, a seasonal effect is an unlikely factor of our conclusions. Although we performed single time-point measurements, CRP has a relatively long half-life (19h), and is therefore subject only to a small diurnal variation [32,50]. While diurnal variations can make the time of sample collection important, our blood samples were consistently collected between 8 and 10 AM. Another study merit was that trained interviewers made the diagnosis of depression using an accepted, standardized method with DSM-IV criteria, while some of the previous studies used only self-reporting diagnoses.
Nevertheless, this ancillary study also had limitations. Sample size was relatively small. Because of the prospective study design, it would have been unethical to take our subjects off their antidepressant treatment. Consequently, we could not evaluate the effects that antidepressant use per se may have had on CRP. Antidepressant treatment is associated with reduction in CRP level [51], therefore most likely CRP would have been higher had these subjects not been treated for depression.
In conclusion, premenopausal women with depression exhibited clinically significant increases in CRP levels. Given the high prevalence of depression in the general population, our findings of elevated CRP levels in premenopausal women with MDD may have major public health implications. Approximately 16% of the 134 million US women between the ages of 21 and 45 are or have been suffering from MDD [8]. Hence millions of women currently may have abnormal CRP levels conferring a moderate to major increase in cardiovascular risk, especially when associated with obesity. The results of our study suggest that CRP should be measured in women with depression, especially if overweight, together with traditional assessments of cardiovascular risk factors. Since dieting is effective in lowering CRP levels [52], weight loss should be recommended even in moderately overweight women with depression, especially if they have higher CRP levels and/or other cardiovascular risk factors. The cardiovascular consequences of CRP elevations in premenopausal women with mild depression should be further characterized in large prospective studies, preferably with repeat CRP measurements over time.
Acknowledgments
This research was supported in part by the Intramural Research Programs of the National Institute of Mental Health, the National Institute of Diabetes, Digestive and Kidney Diseases, and the Clinical Center of the National Institutes of Health, DHHS in Bethesda, MD. We would like to thank all the subjects participating in this study and Mr. Rene Costello for performing CRP assays. The following individuals were investigators of the P.O.W.E.R. Protocol (Premenopausal, Osteoporosis, Women, Alendronate, Depression): Giovanni Cizza (Principal Investigator) and, alphabetically, Anne Berger, Marc R. Blackman, Karim A. Calis, Gyorgy Csako, Bart Drinkard, Farideh Eskandari, Philip W. Gold, McDonald Horne, Christine Kotila, Pedro Martinez, Kate Musallam, Terry M. Phillips, James. C. Reynolds, Nancy G. Sebring, Esther Sternberg, and Sara Torvik (Associate Investigators).
References
- 1.Carney RM, Rich MW, Tevelde A, Saini J, Clark K, Jaffe AS. Major depressive disorder in coronary artery disease. Am J Cardiol. 1987;60:1273–1275. doi: 10.1016/0002-9149(87)90607-2. [DOI] [PubMed] [Google Scholar]
- 2.Gonzalez MB, Snyderman TB, Colket JT, Arias RM, Jiang JW, O'Connor CM, Krishnan KR. Depression in patients with coronary artery disease. Depression. 1996;4:57–62. doi: 10.1002/(SICI)1522-7162(1996)4:2<57::AID-DEPR3>3.0.CO;2-C. [DOI] [PubMed] [Google Scholar]
- 3.Ferketich AK, Schwartzbaum JA, Frid DJ, Moeschberger ML. Depression as an antecedent to heart disease among women and men in the NHANES I study National Health and Nutrition Examination Survey. Arch Intern Med. 2000;160:1261–1268. doi: 10.1001/archinte.160.9.1261. [DOI] [PubMed] [Google Scholar]
- 4.Rugulies R. Depression as a predictor for coronary heart disease. A review and meta-analysis. Am J Prev Med. 2002;23:51–61. doi: 10.1016/s0749-3797(02)00439-7. [DOI] [PubMed] [Google Scholar]
- 5.Wassertheil-Smoller S, Shumaker S, Ockene J, Talavera GA, Greenland P, Cochrane B, Robbins J, Aragaki A, Dunbar-Jacob J. Depression and cardiovascular sequelae in postmenopausal women. The Women's Health Initiative (WHI) Arch Intern Med. 2004;164:289–298. doi: 10.1001/archinte.164.3.289. [DOI] [PubMed] [Google Scholar]
- 6.Miller GE, Stetler CA, Carney RM, Freedland KE, Banks WA. Clinical depression and inflammatory risk markers for coronary heart disease. Am J Cardiol. 2002;90:1279–1283. doi: 10.1016/s0002-9149(02)02863-1. [DOI] [PubMed] [Google Scholar]
- 7.Marques-Deak A, Cizza G, Sternberg E. Brain-immune interactions and disease susceptibility. Mol Psychiatry. 2005;10:239–250. doi: 10.1038/sj.mp.4001643. [DOI] [PubMed] [Google Scholar]
- 8.Eskandari F, Mistry S, Martinez PE, Torvik S, Kotila C, Sebring N, Drinkard BE, Levy C, Reynolds JC, Csako G, Gold PW, Horne M, Cizza G, POWER (Premenopausal, Osteopenia/Osteoporosis Women Alendronate Depression) Study Group Younger, premenopausal women with major depressive disorder have more abdominal fat and increased serum levels of prothrombotic factors: implications for greater cardiovascular risk. Metabolism. 2005;54:918–924. doi: 10.1016/j.metabol.2005.02.006. [DOI] [PubMed] [Google Scholar]
- 9.Agatisa PK, Matthews KA, Bromberger JT, Edmundowicz D, Chang YF, Sutton-Tyrrell K. Coronary and aortic calcification in women with a history of major depression. Arch Intern Med. 2005;165:1229–1236. doi: 10.1001/archinte.165.11.1229. [DOI] [PubMed] [Google Scholar]
- 10.Jones DJ, Bromberger JT, Sutton-Tyrrell K, Matthews KA. Lifetime history of depression and carotid atherosclerosis in middle-aged women. Arch Gen Psychiatry. 2003;60:153–160. doi: 10.1001/archpsyc.60.2.153. [DOI] [PubMed] [Google Scholar]
- 11.Ridker PM, Hennekens CH, Buring JE, Rifai N. C-reactive protein and other markers of inflammation in the prediction of cardiovascular disease in women. N Engl J Med. 2000;342:836–843. doi: 10.1056/NEJM200003233421202. [DOI] [PubMed] [Google Scholar]
- 12.Ridker PM, Wilson PW, Grundy SM. Should C-reactive protein be added to metabolic syndrome and to assessment of global cardiovascular risk? Circulation. 2004;109:2818–2825. doi: 10.1161/01.CIR.0000132467.45278.59. [DOI] [PubMed] [Google Scholar]
- 13.Ridker PM, Rifai N, Rose L, Buring JE, Cook NR. Comparison of C-reactive proteinand low-density lipoprotein cholesterol levels in the prediction of first cardiovascular events. N Engl J Med. 2002;347:1557–1565. doi: 10.1056/NEJMoa021993. [DOI] [PubMed] [Google Scholar]
- 14.Penninx BW, Kritchevsky SB, Yaffe K, Newman AB, Simonsick EM, Rubin S, Ferrucci L, Harris T, Pahor M. Inflammatory markers and depressed mood in older persons: results from the Health, Aging and Body Composition study. Biol Psychiatry. 2003;54:566–572. doi: 10.1016/s0006-3223(02)01811-5. [DOI] [PubMed] [Google Scholar]
- 15.Miller GE, Stetler CA, Carney RM, Freedland KE, Banks WA. Clinical depression and inflammatory risk markers for coronary heart disease. Am J Cardiol. 2002;90:1279–1283. doi: 10.1016/s0002-9149(02)02863-1. [DOI] [PubMed] [Google Scholar]
- 16.Berk M, Wadee AA, Kuschke RH, O'Neill-Kerr A. Acute phase proteins in major depression. J Psychosom Res. 1997;43:529–534. doi: 10.1016/s0022-3999(97)00139-6. [DOI] [PubMed] [Google Scholar]
- 17.Frasure-Smith N, Lesperance F, Irwin MR, Sauve C, Lesperance J, Theroux P. Depression, C-reactive protein and two-year major adverse cardiac events in men after acute coronary syndromes. Biol Psychiatry. 2007;62:302–308. doi: 10.1016/j.biopsych.2006.09.029. [DOI] [PubMed] [Google Scholar]
- 18.Huang TL, Lin FC. High-sensitivity C-reactive protein levels in patients with major depressive disorder and bipolar mania. Prog Neuropsy-chopharmacol Biol Psychiatry. 2007;31:370–372. doi: 10.1016/j.pnpbp.2006.09.010. [DOI] [PubMed] [Google Scholar]
- 19.Empana JP, Sykes DH, Luc G, Juhan-Vague I, Arveiler D, Ferrieres J, Amouyel P, Bingham A, Montaye M, Ruidavets JB, Haas B, Evans A, Jouven X, Ducimetiere P, PRIME Study Group Contributions of depressive mood and circulating inflammatory markers to coronary heart disease in healthy European men: the Prospective Epidemiological Study of Myocardial Infarction (PRIME) Circulation. 2005;111:2299–2305. doi: 10.1161/01.CIR.0000164203.54111.AE. [DOI] [PubMed] [Google Scholar]
- 20.Panagiotakos DB, Pitsavos C, Chrysohoou C, Tsetsekou E, Papageorgiou C, Christodoulou G, Stefanadis C, ATTICA study Inflammation, coagulation, and depressive symptomatology in cardiovascular disease-free people; the ATTICA study. Eur Heart J. 2004;25:492–499. doi: 10.1016/j.ehj.2004.01.018. [DOI] [PubMed] [Google Scholar]
- 21.Kling MA, Alesci S, Csako G, Costello R, Luckenbaugh DA, Bonne O, Duncko R, Drevets WC, Manji HK, Charney DS, Gold PW, Neumeister A. Sustained low-grade pro-inflammatory state in unmedicated, remitted women with major depressive disorder as evidenced by elevated serum levels of the acute phase proteins C-reactive protein and serum amyloid A. Biol Psychiatry. 2007;62:309–313. doi: 10.1016/j.biopsych.2006.09.033. [DOI] [PMC free article] [PubMed] [Google Scholar]
- 22.Dogan E, Erkoc R, Eryonucu B, Sayarlioglu H, Agargun MY. Relation between depression, some laboratory parameters, and quality of life in hemodialysis patients. Ren Fail. 2005;27:695–699. doi: 10.1080/08860220500242728. [DOI] [PubMed] [Google Scholar]
- 23.O'Brien SM, Scott LV, Dinan TG. Antidepressant therapy and C-reactive protein levels. Br J Psychiatry. 2006;188:449–452. doi: 10.1192/bjp.bp.105.011015. [DOI] [PubMed] [Google Scholar]
- 24.Lesperance F, Frasure-Smith N, Theroux P, Irwin M. The association between major depression and levels of soluble intercellular adhesion molecule 1, interleukin-6, and C-reactive protein in patients with recent acute coronary syndromes. Am J Psychiatry. 2004;161:271–277. doi: 10.1176/appi.ajp.161.2.271. [DOI] [PubMed] [Google Scholar]
- 25.Tiemeier H, van Tuijl HR, Hofman A, Kiliaan AJ, Breteler MM. Plasma fatty acid composition and depression are associated in the elderly: the Rotterdam Study. Am J Clin Nutr. 2003;78:40–46. doi: 10.1093/ajcn/78.1.40. [DOI] [PubMed] [Google Scholar]
- 26.Kuo HK, Yen CJ, Chang CH, Kuo CK, Chen JH, Sorond F. Relation of C-reactive protein to stroke, cognitive disorders, and depression in the general population: systematic review and meta-analysis. Lancet Neurol. 2005;4:371–380. doi: 10.1016/S1474-4422(05)70099-5. [DOI] [PubMed] [Google Scholar]
- 27.Henningsson S, Baghaei F, Rosmond R, Holm G, Landén M, Anckarsäter H, Ekman A. Association between serum levels of C-reactive protein and personality traits in women. Behav Brain Funct. 2008;4:16. doi: 10.1186/1744-9081-4-16. [DOI] [PMC free article] [PubMed] [Google Scholar]
- 28.Whooley MA, Caska CM, Hendrickson BE, Rourke MA, Ho J, Ali S. Depression and inflammation in patients with coronary heart disease: findings from the Heart and Soul Study. Biol Psychiatry. 2007;62:314–320. doi: 10.1016/j.biopsych.2006.10.016. [DOI] [PMC free article] [PubMed] [Google Scholar]
- 29.Pan A, Ye X, Franco OH, Li H, Yu Z, Wang J, Qi Q, Gu W, Pang X, Liu H, Lin X. The association of depressive symptoms with inflammatory factors and adipokines in middle-aged and older Chinese. PLoS ONE. 2008;3:e1392. doi: 10.1371/journal.pone.0001392. [DOI] [PMC free article] [PubMed] [Google Scholar]
- 30.Kessler RC, Berglund P, Demler O, Jin R, Koretz D, Merikangas KR, Rush JA, Walter EE, Wang PS. The epidemiology of major depressive disorder: results from the National Comorbidity Survey Replication (NCS-R) JAMA. 2003;289:3095–3105. doi: 10.1001/jama.289.23.3095. [DOI] [PubMed] [Google Scholar]
- 31.Riese H, Vrijkotte TG, Meijer P, Kluft C, De Geus EJ. Diagnostic strategies for C-reactive protein. BMC Cardiovasc Disord. 2002;2:9. doi: 10.1186/1471-2261-2-9. [DOI] [PMC free article] [PubMed] [Google Scholar]
- 32.Rudnicka AR, Rumley A, Lowe GD, Strachan DP. Diurnal, seasonal, and blood-processing patterns in levels of circulating fibrinogen, fibrin D-dimer, C-reactive protein, tissue plasminogen activator, and von Willebrand factor in a 45-year-old population. Circulation. 2007;115:996–1003. doi: 10.1161/CIRCULATIONAHA.106.635169. [DOI] [PubMed] [Google Scholar]
- 33.Eskandari F, Martinez P, Torvik S, Phillips TM, Sternberg EM, Mistry S, Ronsaville D, Wesley R, Toomey C, Sebring NG, Reynolds JC, Blackman MC, Calis KA, Gold PW, Cizza G, for the Power Study Group Low bone mass in premenopausal women with depression. Arch Intern Med. 2007;167:2329–2336. doi: 10.1001/archinte.167.21.2329. [DOI] [PubMed] [Google Scholar]
- 34.Sabatine MS, Morrow DA, Jablonski KA, Rice MM, Warnica JW, Domanski MJ, Hsia J, Gersh BJ, Rifai N, Ridker PM, Pfeffer MA, Braunwald E, PEACE Investigators Prognostic significance of the Centers for Disease Control/American Heart Association high-sensitivity C-reactive protein cut points for cardiovascular and other outcomes in patients with stable coronary artery disease. Circulation. 2007;115:1528–1536. doi: 10.1161/CIRCULATIONAHA.106.649939. [DOI] [PubMed] [Google Scholar]
- 35.Ladwig KH, Marten-Mittag B, Lowel H, Doring A, Koenig W. Influence of depressive mood on the association of CRP and obesity in 3205 middle aged healthy men. Brain Behav Immun. 2003;17:268–275. doi: 10.1016/s0889-1591(03)00056-4. [DOI] [PubMed] [Google Scholar]
- 36.Dietrich T, Garcia RI, de Pablo P, Schulze PC, Hoffmann K. The effects of cigarette smoking on C-reactive protein concentrations in men and women and its modification by exogenous oral hormones in women. Eur J Cardiovasc Prev Rehabil. 2007;14:694–700. doi: 10.1097/HJR.0b013e328270b913. [DOI] [PubMed] [Google Scholar]
- 37.Raum E, Gebhardt K, Buchner M, Schiltenwolf M, Brenner H. Long-term and short-term alcohol consumption and levels of C-reactive protein. Int J Cardiol. 2007;121:224–226. doi: 10.1016/j.ijcard.2006.08.104. [DOI] [PubMed] [Google Scholar]
- 38.Cizza G, Marques AH, Eskandari F, Christie IC, Torvik S, Silverman MN, Phillips TM, Sternberg EM, POWER Study Group Elevated neuroimmune biomarkers in sweat patches and plasma in premenopausal women with major depressive disorder in remission: the POWER Study. Biol Psychiatry. 2008 Nov 15;64(10):907–911. doi: 10.1016/j.biopsych.2008.05.035. Epub 2008 Jul 26. [DOI] [PMC free article] [PubMed] [Google Scholar]
- 39.Devaraj S, O'Keefe G, Jialal I. Defining the proinflammatory phenotype using high sensitive C-reactive protein levels as the biomarker. J Clin Endocrinol Metab. 2005;90:4549–4554. doi: 10.1210/jc.2005-0069. [DOI] [PubMed] [Google Scholar]
- 40.Sesso HD, Wang L, Buring JE, Ridker PM, Gaziano JM. Comparison of interleukin-6 and C-reactive protein for the risk of developing hypertension in women. Hypertension. 2007;49:304–310. doi: 10.1161/01.HYP.0000252664.24294.ff. [DOI] [PubMed] [Google Scholar]
- 41.Cook NR, Buring JE, Ridker PM. The effect of including C-reactive protein in cardiovascular risk prediction models for women. Ann Intern Med. 2006;145:21–29. doi: 10.7326/0003-4819-145-1-200607040-00128. [DOI] [PubMed] [Google Scholar]
- 42.Mohamed-Ali V, Goodrick S, Rawesh A, Katz DR, Miles JM, Yudkin JS, Klein S, Coppack SW. Subcutaneous adipose tissue releases interleukin-6, but not tumor necrosis factor-alpha, in vivo. J Clin Endocrinol Metab. 1997;82:4196–4200. doi: 10.1210/jcem.82.12.4450. [DOI] [PubMed] [Google Scholar]
- 43.Kinder LS, Carnethon MR, Palaniappan LP, King AC, Fortmann Depression and the metabolic syndrome in young adults: findings from the Third National Health and Nutrition Examination Survey. Psychosom Med. 2004;66:316–322. doi: 10.1097/01.psy.0000124755.91880.f4. [DOI] [PubMed] [Google Scholar]
- 44.Jensen GL. Drug-induced hyperphagia: what can we learn from psychiatric medications? J Parenter Enteral Nutr. 2008;32:578–581. doi: 10.1177/0148607108321708. [DOI] [PubMed] [Google Scholar]
- 45.Ridker PM, Rifai N, Cook NR, Bradwin G, Buring JE. Non-HDL cholesterol, apolipoproteins A-I and B100, standard lipid measures, lipid ratios, and CRP as risk factors for cardiovascular disease in women. JAMA. 2005;294:326–333. doi: 10.1001/jama.294.3.326. [DOI] [PubMed] [Google Scholar]
- 46.Bogaty P, Boyer L, Simard S, Dauwe F, Dupuis R, Verret B, Huynh T, Bertrand F, Dagenais GR, Brophy JM. Clinical utility of C-reactive protein measured at admission, hospital discharge, and 1 month later to predict outcome in patients with acute coronary disease. The RISCA (recurrence and inflammation in the acute coronary syndromes) study. J Am Coll Cardiol. 2008;51:2339–2346. doi: 10.1016/j.jacc.2008.03.019. [DOI] [PubMed] [Google Scholar]
- 47.Kluft C, de Maat MP. Determination of the habitual low blood level of C-reactive protein in individuals. Ital Heart J. 2001;3:172–180. [PubMed] [Google Scholar]
- 48.Kathiresan S, Larson MG, Vasan RS, Guo CY, Gona P, Keaney JF, Jr, Wilson PW, Newton-Cheh C, Musone SL, Camargo AL, Drake JA, Levy D, O'Donnell CJ, Hirschhorn JN, Benjamin EJ. Contribution of clinical correlates and 13 C-reactive protein gene polymorphisms to inter-individual variability in serum C-reactive protein level. Circulation. 2006;113:1415–1423. doi: 10.1161/CIRCULATIONAHA.105.591271. [DOI] [PubMed] [Google Scholar]
- 49.Kelly GS. Seasonal variations of selected cardiovascular risk factors. Altern Med Rev. 2005;10:307–320. [PubMed] [Google Scholar]
- 50.Kao PC, Shiesh SC, Wu TJ. Serum C-reactive protein as a marker for wellness assessment. Ann Clin Lab Sci. 2006;36:163–169. [PubMed] [Google Scholar]
- 51.Lanquillon S, Krieg JC, Bening-Abu-Shach U, Vedder H. Cytokine production and treatment response in major depressive disorder. Neuropsychopharmacology. 2000;22:370–379. doi: 10.1016/S0893-133X(99)00134-7. [DOI] [PubMed] [Google Scholar]
- 52.Selvin E, Paynter NP, Erlinger TP. The effect of weight loss on C-reactive protein: a systematic review. Arch Intern Med. 2007;167:31–39. doi: 10.1001/archinte.167.1.31. [DOI] [PubMed] [Google Scholar]