Abstract
Purpose
We sought to determine whether a relationship exists between primary tumor size and histopathologic features in localized renal cancers.
Materials and Methods
Data from Surveillance, Epidemiology and End Results (SEER) were used to create a cohort of patients diagnosed with localized, node negative renal masses from 1988–2004. Nuclear grade was divided into “low” and “high” grade groups. We used a multinomial logistic model to predict the probability of nuclear grade and histologic subytpe with increasing size of the primary tumor.
Results
19,932 patients in SEER with localized renal masses were evaluated. The overall nuclear grade distribution was 80% and 20% for low and high grade tumors respectively. A multinomial logistic model reveals that the probability of a high grade tumor increases with size. For each 1 cm increase in size of a primary localized RCC, the odds of high grade disease increases by 13% (OR=1.13, p<0.001). Multinomial models also predict that the odds of papillary RCC compared to clear cell RCC decreases with tumor size. Conversely, the odds of chromophobe RCC versus clear cell RCC increases with increasing tumor size.
Conclusion
The majority of localized, node negative RCCs are low grade tumors. Although the probability of a high grade tumor increases with size, nearly 85% of RCC <4cm and 70% of localized RCC >7cm demonstrate low nuclear grade. The probability of detecting particular histologic subtypes also varies with increasing tumor size. These data suggest that many localized renal tumors can grow very large locally without acquiring metastatic potential.
Introduction
Increased detection of all stages of kidney cancer has been correlated to routine use of cross sectional imaging modalities.1 This incidental detection has been most pronounced in the increased numbers of small renal masses (SRM).2 Modern surgical techniques offer patients the opportunity to pursue new minimally invasive treatments including excision or ablation. Recent studies have also described the use of active surveillance in appropriately selected patients.3 Renal mass biopsies are still not routinely being performed on enhancing renal masses, despite accuracy reported at greater than 90%.4 Therefore, data used to counsel patients are most often extrapolated from radiographic characteristics. We sought to identify a relationship between the tumor size of localized RCC, an easily measured variable preoperatively, and histopathologic features including nuclear grade and subtype.
Materials and Methods
Data from Surveillance, Epidemiology and End Results (SEER) were used to create a cohort of 19,932 patients diagnosed with localized (pT1 and T2), node negative (N0 and Nx) RCC from 1988–20045. SEER is maintained by the National Cancer Institute and collects information on cancers diagnosed in approximately 14% of the United States population. Patients less than 30 years old, those with tumors greater than 20 cm, those with histology other than clear cell, papillary, and chromophobe, and those with inadequate histologic classification were excluded from analysis. Patients less than 30 were excluded to eliminate chance of hereditary cancer, tumors greater than 20cm were excluded to eliminate unusual histologies. We used the International Classification of Diseases 03 (ICD03) to determine histology for four major histology types. Codes used were: Clear Cell: 8310, 8312, Papillary: 8260, Chromophobe: 8317, 8270. Additional tumor types classified as other were 8032, 8041, 8240, 8318, 8319, and 8960. Nuclear grades 1 or 2 were considered “low” grade, while grade 3, 4, or “anaplastic” tumors were “high” grade. We used logistic models to predict the probability and odds of high grade tumors with increasing primary tumor size. We used multinomial logistic models to predict the probability of histologic subtype based on primary tumor size. Tumor size was entered as an untransformed term to estimate odds ratios, and transformed using restricted cubic splines with five knots to estimate probabilities and figures6.
Results
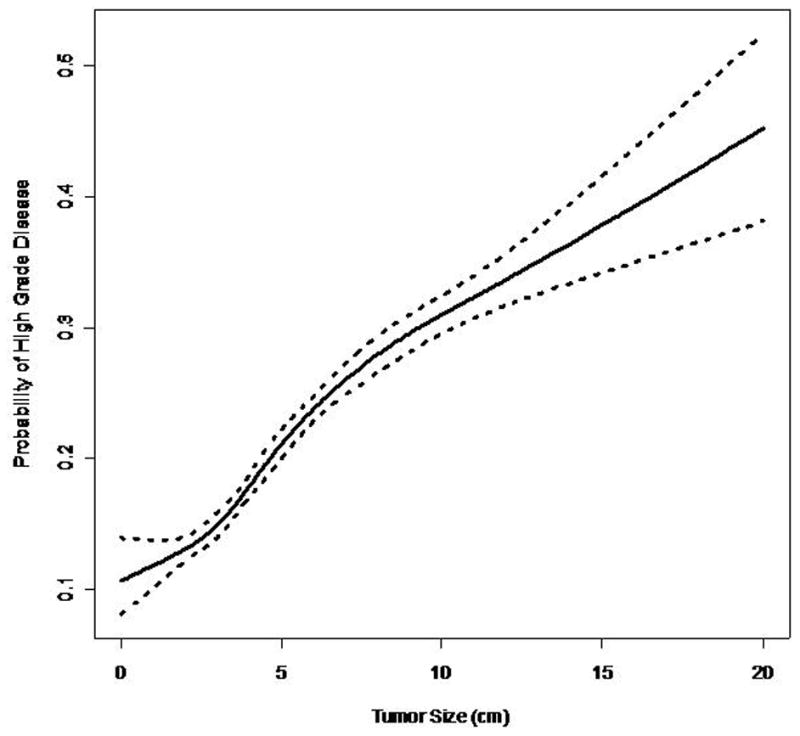
19,932 patients in SEER with localized renal masses were evaluated. 12,158 (61%) were male. The mean age at diagnosis was 61.8 years (SD 12.7 years). The mean tumor size was 5 cm (SD 2.9 cm). Surgical data was available in for the years 1998–2004 accounting for 14,016 patients. 98% (13,676) were treated surgically. 81% (11416) underwent nephrectomy, 16% (2260) underwent partial nephrectomy, and 2% (340) had other surgical procedures (i.e. ablative therapy). 84% (16743) of patients were white, 10% (1993) were African American, and 6% (1196) were other races. 36% (7175) of cases were between 1988 and 1998, and 64% (12757) were between 1999 and 2004 (Tables 1 and 2). The nuclear grade distribution was 80% (15,881) and 20% (4051) for low and high grade tumors respectively. 84.2% (9494/11263) of localized tumors ≤4cm, 78% (6844/8749) of tumors 4cm to 7cm, and 69% (2097/3066) of localized tumors >7cm were classified as low grade (Table 3). The logistic model predicts that the probability of high grade disease increases with increasing primary pathologic tumor size (Figure 1). The model also indicates that the odds of high grade disease increase by 13% (OR=1.13, p<0.001) for each one 1 cm increase in tumor size.
Table 1.
Patient Demographics
| %(N) | |
|---|---|
| N | 19932 |
| Gender | |
| Male | 61% (12158) |
| Female | 39% (7774) |
| Race | |
| Black | 10% (1993) |
| White | 84% (16,743) |
| Other | 6% (1196) |
| Surgery (n=14,016) | 98% (13,676) |
| Neprectomy | 81% (11,416) |
| Partial Nephectomy | 16% (2260) |
| Other | 2% (340) |
| Age, mean(SD) | 61.9 (SD 12.7) |
| SEER Histology | |
| Clear Cell | 88% (17552) |
| Papillary | 4% (865) |
| Chromophobe | 2% (388) |
| Other | 6% (1127) |
| Year | |
| 1988–1998 | 36% (7175) |
| 1999–2004 | 64% (12757) |
Table 2.
Demographics by tumor grade
| Low Grade | High Grade | p-value | |
|---|---|---|---|
| N | 15,881 | 4,051 | |
| Sex | <0.001 | ||
| Female | 82% | 18% | |
| Male | 78% | 22% | |
| Race | 0.504 | ||
| Black | 79% | 21% | |
| White | 80% | 20% | |
| Other | 80% | 20% | |
| Surgery | 0.776 | ||
| No | 80% | 20% | |
| Yes | 80% | 20% | |
| Age, mean(SD) | 61.7 (12.7) | 62.4 (12.5) | 0.001 |
| SEER Histology | <0.001 | ||
| Clear Cell | 81% | 19% | |
| Papillary | 80% | 20% | |
| Chromophobe | 73% | 27% | |
| Other | 64% | 36% | |
| Year | <0.001 | ||
| 1988–1998 | 83% | 17% | |
| 1999–2004 | 78% | 22% |
Table 3.
Tumor Grade and Size
| Tumor Size | Low Grade | High Grade | ||
|---|---|---|---|---|
| (cm) | N | % | N | % |
| <1 | 175 | 89.3% | 21 | 10.7% |
| 1 | 1,010 | 86.5% | 158 | 13.5% |
| 2 | 2,717 | 86.9% | 410 | 13.1% |
| 3 | 3,038 | 83.8% | 588 | 16.2% |
| 4 | 2,554 | 81.2% | 592 | 18.8% |
| 5 | 1,885 | 78.3% | 523 | 21.7% |
| 6 | 1,383 | 75.4% | 451 | 24.6% |
| 7 | 1,022 | 75.1% | 339 | 24.9% |
| 8 | 703 | 73.2% | 257 | 26.8% |
| 9 | 442 | 66.7% | 221 | 33.3% |
| 10 | 287 | 65.7% | 150 | 34.3% |
| 11 | 220 | 70.5% | 92 | 29.5% |
| 12 | 152 | 67.3% | 74 | 32.7% |
| 13 | 90 | 68.2% | 42 | 31.8% |
| 14 | 54 | 56.8% | 41 | 43.2% |
| 15 | 79 | 64.8% | 43 | 35.3% |
| 16 | 20 | 52.6% | 18 | 47.4% |
| 17 | 26 | 63.4% | 15 | 36.6% |
| 18 | 7 | 53.9% | 6 | 46.2% |
| 19 | 7 | 53.9% | 6 | 46.2% |
| 20 | 10 | 71.4% | 4 | 28.6% |
| Total | 15,881 | 79.7% | 4,051 | 20.3% |
Figure 1.

Probability of High Grade vs. Tumor Size
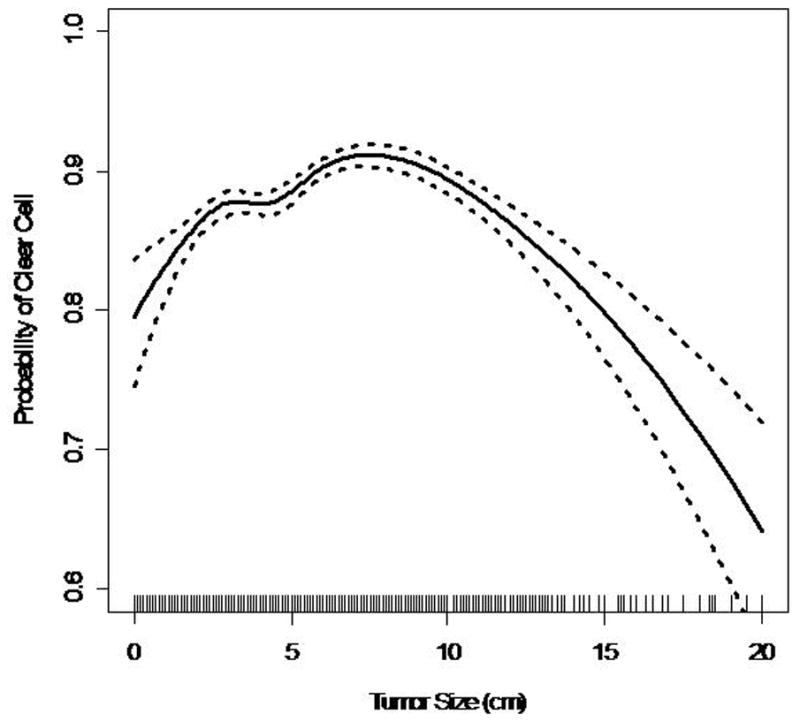
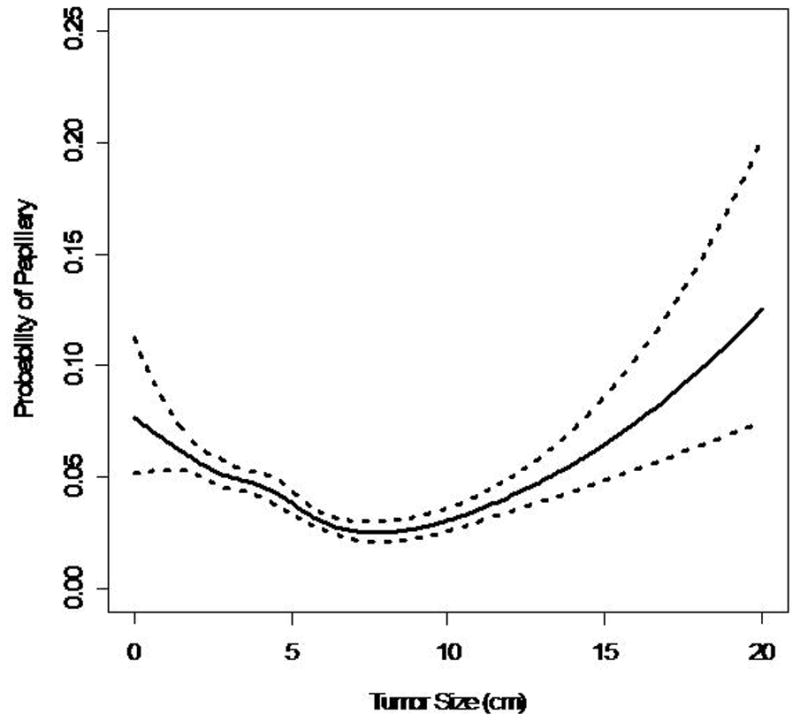
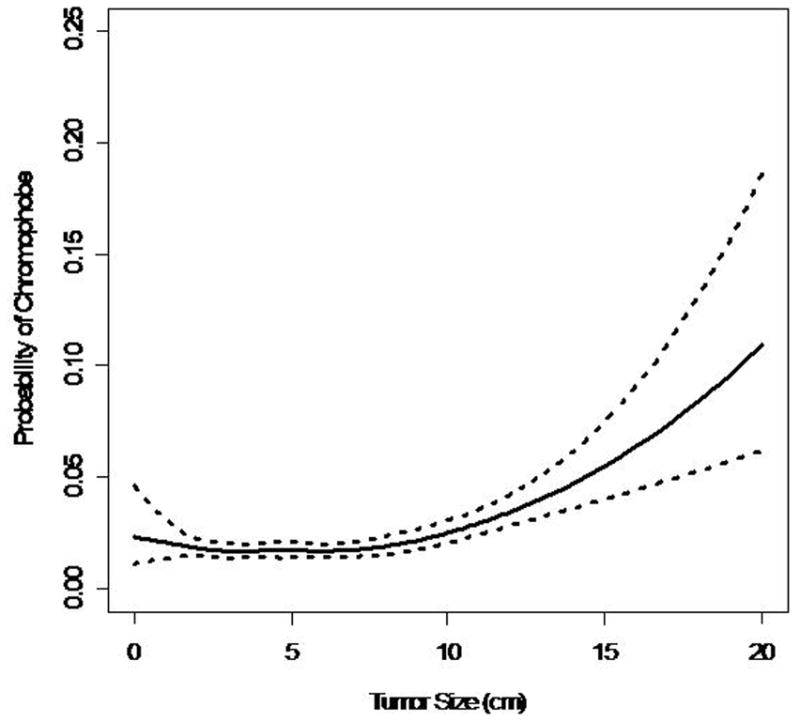
88% (17,552) patients had clear cell RCC, 4.4% (865) had papillary RCC, 1.9% (388) had chromophobe RCC. The probability of clear cell RCC remained at 85–93% for tumors up to 12 cm in size (Figure 2a). The multinomial logistic model indicated that the odds of papillary RCC relative to clear cell RCC generally decreases with increasing primary pathologic tumor size (OR=0.95 per 1 cm increase, p<0.001) (Figure 2b). However, the spline models indicate that there might be a u-shaped relationship between tumor size and the probability of papillary histologic subtype. Therefore, it appears that for tumors greater than 10 cm the probability of papillary RCC increases. The probability of chromophobe RCC increased with increasing pathologic tumor size (Figure 2c). The odds of chromophobe relative to clear cell RCC increased by 8% with each 1 cm increase in tumor size (OR=1.07 per 1 cm increase, p<0.001).
Figure 2.


Figure 2a. Probability of Clear Cell RCC vs. Tumor Size (dashed lines represent 95% Cl, solid lines represent point estimate; lines at horizontal axis represent distribution of data points)
Figure 2b. Probability of Papillary RCC vs. Tumor Size
Figure 2c. Probability of Chromophobe RCC vs. Tumor Size
Discussion
Clinically, renal cell carcinoma is a radiographic diagnosis. The finding of an enhancing solid renal mass without radiographic evidence of fat on contrast based cross sectional imaging is considered diagnostic for RCC and sufficient to recommend intervention. Unfortunately, more specific radiographic characteristics to predict a tumor’s biological potential do not currently exist. One consistently recorded preoperative variable for localized RCC is the size of the primary tumor. While radiographic imaging studies may overestimate pathological tumor size7, size is an essential element for clinical staging and has been shown to have prognostic implications independent from other histopathologic features.8 However, if additional biologically relevant histopathologic characteristics could be correlated to the size of the primary tumor, this would result in more informed preoperative clinical decision making.
Here we demonstrate that the majority of localized node negative renal cancers exhibit low nuclear grade. Moreover, this study demonstrates that the probability of high grade tumors increases with increasing tumor size. The odds of high grade disease increases by 13% for each 1 cm increase in tumor size. These data are consistent with previously published single institutional series. Frank et al. from the Mayo Clinic found a 32% increase of high grade tumors for each 1 cm increase of tumor size; however, their data were in clear cell RCC variants only9. Other smaller series have reported a similar relationship between smaller tumors and favorable histopathologic features.10–13
Of the 19,932 with renal malignancies in this series, nearly 85% of patients with tumors 4 cm or less exhibited a low nuclear grade. Surprisingly, almost 70% of tumors greater than 7 cm were also noted to demonstrate low nuclear grade. Importantly, the 30% of tumors greater than 7 cm with high grade disease correlates closely to the 5 year relative survival rate of patients with biologically aggressive (i.e. high grade or other negative histologic features) localized RCC.6 This represents a significant difference from prior studies with smaller cohorts which report that only 33–48% of localized tumors > 7 cm were low grade.9–12 In series with only 213 and 287 patients that focused on tumors less than 7 cm and 4 cm respectively, Hsu et al. and Remzi et al., both conclude that at a cutoff primary tumor size of 3 cm is associated with a much higher likelihood of aggressive biological potential14–15. Our data suggests that a significant majority of localized tumors much larger than 3 cm have low grade disease and might not be as biologically aggressive as previously published. A recent meta-analysis has shown an overall growth rate of 0.3 cm year in tumors under active surveillance undergoing serial imaging3. In theory, large asymptomatic tumors incidentally discovered may have been present for long periods of time and their favorable histopathologic features have led to indolent, localized disease. Schlomer et al. conclude that the rate of benign versus malignant disease in symptomatic versus asymptomatic T2 tumors was equal; however, a higher rate of high grade disease was seen in the symptomatic cohort.11 When analyzed together these data may also explain the short term oncologic success of ablation in the management of SRMs, as well as recent reports evaluating cancer control for nephron sparing surgery on asymptomatic cT1b or cT2 tumors16–17. These data may also be used to cautiously extend the role of active surveillance strategies for larger tumors in selected elderly patients with significant co-morbidities and/or chronic kidney disease stage III–IV in whom radical nephrectomy has been shown to markedly worsen glomerular filtration rates.18 Although tumor size is often used as a criteria of observation, the data on observation of renal masses based on size is immature and surveillance strategies must be used cautiously with appropriate patient counseling.
Almost 88% of the patients in this study had clear cell RCC. This represents a higher number than previously reported in the literature. In our cohort, the probability of clear cell remained around 90% until the primary tumor size exceeded 10 cm. Among tumors < 10 cm, the odds of papillary RCC compared to clear cell RCC decreased, while the odds of chromophobe RCC increased with each 1 cm increase in the primary tumor’s size. These histologic trends were also seen in other series.9,11 Although our model shows a general decrease in odds of papillary RCC relative to clear cell RCC, the curve seems to demonstrate a u-shaped distribution. Therefore, it is reasonable to conclude that for very large localized tumors (>10cm), the odds of a favorable histologic subtype (ie papillary, or chromophobe) increases. This supports the hypothesis and clinical experience that even large tumors can demonstrate favorable biological indicators such as nuclear grade and subtype.
A conclusion on tumor size in relation to benign versus malignant disease could not be determined in this series. Many series support the conclusion of increased rates of malignancy with increased tumor size. However, a study by Remzi et al. reveals no correlation between radiologic tumor size and benign versus malignant disease7. They concluded that radical nephrectomy could have been avoided in 42% of cases of benign disease and the authors advocate for a broader use of percutaneous needle biopsy.
The main limitation of this study is that interobserver variability can impact pathologic diagnosis. Because of this potential influence on nuclear grade analysis, we chose to report only “low” versus “high” grade assessments. Although variability of histologic subtyping should be less frequent, this is a recognized limitation of the SEER data as there is not a central pathology review process. Another limitation of the SEER database is that it does not distinguish familial from sporadic RCC. Therefore, we eliminated patients less than 30 to try to limit cases of familial RCC. Finally, SEER includes malignant disease so the relationship of tumor size to benign disease could not be evaluated.
Conclusion
A majority of localized, node negative RCCs exhibit low nuclear grade. Although the probability of a high grade tumor increases with size, nearly 85% of RCC ≤4cm and 70% of localized RCC >7cm demonstrate low nuclear grade. The probability of detecting particular histologic subtypes also varies with increasing tumor size. These data have important implications regarding the risk of progression of localized RCC and may help predict the biological potential of localized renal tumors. Although direct predictions on the natural history of localized RCC cannot be determined from these data, they suggest that renal tumors may remain large and localized during the early part of their growth kinetics. These data are important when counseling patients on treatment options for localized renal masses.
References
- 1.Chow WH, Devesa SS, Warren JL, Fraumeni JF., Jr Rising incidence of renal cell cancer in the United States. JAMA. 2000;281:1628. doi: 10.1001/jama.281.17.1628. [DOI] [PubMed] [Google Scholar]
- 2.Jayson M, Sanders H. Increased incidence of serendipitously discovered renal cell carcinoma. Urology. 1998;51:203. doi: 10.1016/s0090-4295(97)00506-2. [DOI] [PubMed] [Google Scholar]
- 3.Chawla SN, Crispen PL, Hanlon AL, Greenberg RE, Chen DY, Uzzo RG. The Natural History of Observed Enhancing Renal Masses: Meta-Analysis and review of the World Literature. J Urol. 2006;175:425. doi: 10.1016/S0022-5347(05)00148-5. [DOI] [PubMed] [Google Scholar]
- 4.Volpe A, Kachura JR, Geddie WR, Evans AJ, Gharajeh A, Saravanan A, Jewett MA. Techniques, Safety, and Accuracy of Sampling of Renal Tumors by Fine Needle Aspiration and Core Biopsy. J Urol. 2007;178:379. doi: 10.1016/j.juro.2007.03.131. [DOI] [PubMed] [Google Scholar]
- 5.Surveillance, Epidemiology, and End Results (SEER) Program(www.seer.cancer.gov) Public-Use Data (1973–2004), National Cancer Institute, DCCPS, Surveillance Research Program, Cancer Statistics Branch, released April 2006, based on the November 2007 submission.
- 6.Harrell FE. Regression Modeling Strategies. Chapter 2. NY: Springer; 2001. [Google Scholar]
- 7.Remzi M, Katzenbeisser D, Waldert M, Klingler HC, Susani M, Memarsadeghi M, et al. Renal tumor size measured radiologically before surgery is an unreliable variable for predicting histopathological featues: benign tumours are not necessarily small. BJU Int. 2007;99:1002. doi: 10.1111/j.1464-410X.2007.06758.x. [DOI] [PubMed] [Google Scholar]
- 8.Kuczyk M, Wegener G, Merseburger AS, Oelke M, Zumbragel A, Bokemeyer C, et al. Impact of tumor size on the long-term survival of patients with early stage renal cell cancer. World J Urol. 2005;23:50. doi: 10.1007/s00345-004-0483-z. [DOI] [PubMed] [Google Scholar]
- 9.Frank I, Blute ML, Cheville JC, Lohse CM, Weaver AL, Zincke H. Solid renal tumors: An analysis of pathological features related to tumor size. J Urol. 2003;170:2217. doi: 10.1097/01.ju.0000095475.12515.5e. [DOI] [PubMed] [Google Scholar]
- 10.Duchene DA, Lotan Y, Cadeddu JA, Sagalowsky AI, Koeneman KS. Histopathology of surgically managed renal tumors: Analysis of a contemporary series. Urology. 2003;62:827. doi: 10.1016/s0090-4295(03)00658-7. [DOI] [PubMed] [Google Scholar]
- 11.Schlomer B, Figenshau RS, Yan Y, Venkatesh R, Bhayani SB. Pathological features of renal neoplasms classified by size and symptomotology. J Urol. 2006;176:1317. doi: 10.1016/j.juro.2006.06.005. [DOI] [PubMed] [Google Scholar]
- 12.Tabibi A, Parvin M, Abdi H, Bashtar R, Zamani N, Abadpour B. Correlation between size of renal cell carcinoma and its grade, stage, and histological subtype. J Urol. 2007;4:10. [PubMed] [Google Scholar]
- 13.Pahernik S, Ziegler S, Roos F, Melchior SW, Thuroff JW. Small renal tumors: Correlation of clinical and pathologic features with tumor size. J Urol. 2007;178:414. doi: 10.1016/j.juro.2007.03.129. [DOI] [PubMed] [Google Scholar]
- 14.Hsu RM, Chan DY, Siegelman SS. Small renal cell carcinomas: Correlation of size with tumor stage, nuclear grade, and histologic subtype. Am J Roent. 2004;182:551. doi: 10.2214/ajr.182.3.1820551. [DOI] [PubMed] [Google Scholar]
- 15.Remzi M, Ozsoy M, Klingler H, Susani M, Waldert M, Seitz C, et al. Are small renal tumors harmless? Analysis of histopathological features according to to tumors 4 cm or less in diameter. J Urol. 2006;176:896. doi: 10.1016/j.juro.2006.04.047. [DOI] [PubMed] [Google Scholar]
- 16.Patard J, Pantuck AJ, Crepel M, Lam JS, Bellec L, Albouy B, et al. Morbidity and clinical outcome of nephron-sparing surgery in relation to tumour size and indication. Eur Urol. 2007;52:148. doi: 10.1016/j.eururo.2007.01.039. [DOI] [PubMed] [Google Scholar]
- 17.Kunkle DA, Egleston BL, Uzzo RG. Excise, ablate or observe: the small renal mass dilemma—a meta-analysis and review. J Urol. 2008;179:1227. doi: 10.1016/j.juro.2007.11.047. [DOI] [PubMed] [Google Scholar]
- 18.Huang WC, Levey AS, Serio AM, Snyder M, Vickers AJ, Raj GV, et al. Chronic kidney disease after nephrectomy in patients with renal cortical tumors: a retrospective cohort study. Lancet Oncol. 2006;7:735. doi: 10.1016/S1470-2045(06)70803-8. [DOI] [PMC free article] [PubMed] [Google Scholar]


