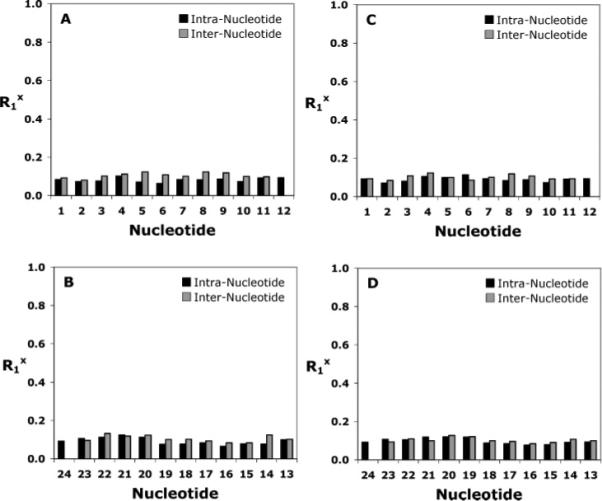
Figure 8.

Distribution of Rx1 values calculated using CORMA (72). (A) Nucleotides C1–C12 of the modified NarIIQ1 duplex. (B) Nucleotides G13–G24 of the modified NarIIQ1 duplex. (C) Nucleotides C1–C12 of the modified NarIIQ2 duplex. (D) Nucleotides G13–G24 of the modified NarIIQ2 duplex. The black bars represent intranucleotide values and the gray bars internucleotide values.
