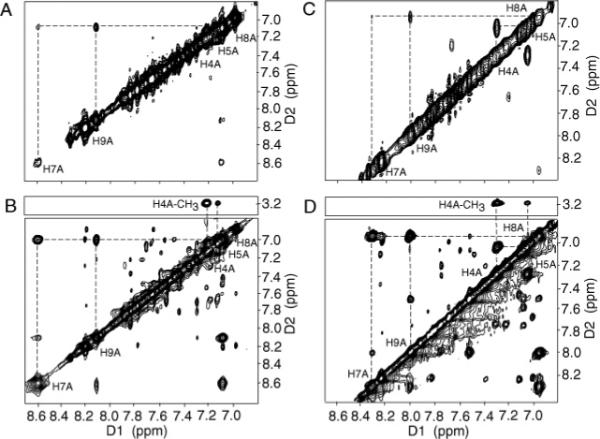
Figure 3.

Assignments of the IQ proton resonances. Expanded plots from (A) the COSY spectrum and (B) the aromatic–aromatic region of the NOESY spectrum at 15 °C for the IQ-adducted NarIIQ1 duplex. Expanded plots from (C) the COSY spectrum and (D) the aromatic–aromatic region of the NOESY spectrum at 15 °C for the IQ-adducted NarIIQ2 duplex.
