

Abstract
Relating three-dimensional fold to function is a central challenge in RNA structural biology. Toward this goal, X-ray crystallography has long been considered the “gold standard” for structure determinations at atomic resolution, although NMR spectroscopy has become a powerhouse in this arena as well. In the area of dynamics, NMR remains the dominant technique to probe the magnitude and timescales of molecular motion. Although the latter area remains largely unassailable by conventional crystallographic methods, inroads have been made on proteins using Laue radiation on timescales of ms to ns. Proposed ‘fourth generation’ radiation sources, such as free-electron X-ray lasers, promise ps- to fs-timescale resolution, and credible evidence is emerging that supports the feasibility of single molecule imaging. At present however, the preponderance of RNA structural information has been derived from timescale and motion insensitive crystallographic techniques. Importantly, developments in computing, automation and high-flux synchrotron sources have propelled the rapidity of ‘conventional’ RNA crystal structure determinations to timeframes of hours once a suitable set of phases is obtained. With a sufficient number of crystal structures, it is possible to create a structural ensemble that can provide insight into global and local molecular motion characteristics that are relevant to biological function. Here we describe techniques to explore conformational changes in the hairpin ribozyme, a representative non-protein-coding RNA catalyst. The approaches discussed include: (i) construct choice and design using prior knowledge to improve X-ray diffraction; (ii) recognition of long-range conformational changes; and (iii) use of single-base or single-atom changes to create ensembles. The methods are broadly applicable to other RNA systems.
Keywords: RNA crystallography, ribozyme, crystallization, RNA structure, crystallographic ensembles, alternate conformation, long-range motion, fold and function, difference Fourier, non-protein-coding RNA
1. Introduction: Non-Coding RNA, Ribozymes and X-ray Crystallography
Non-protein coding (nc)RNAs have garnered significant attention for their ability to mediate diverse cellular processes [1]. A central challenge for scientists is to discern the principles by which ncRNAs achieve functional diversity. To this end we turn to the words of the architect Sullivan who stated, “form ever follows function” [2]. Similarly, the structural biologist seeks to address the question of function by elucidating form at the molecular level [3]. Although the latter corollary has been proffered in the context of proteins, it most certainly describes RNA as well. Indeed, since the discovery that the classic cloverleaf of tRNA is actually L-shaped in three-dimensional space, it has been widely accepted that many ncRNAs can adopt complex tertiary structures that are biologically essential for interactions with their cognate binding partners (i.e. proteins, DNA, RNA or small molecules). Moreover, RNAs are more likely to exhibit multiple conformations due to the absence of a true hydrophobically packed core typical of proteins [4]. Because ribozymes are ncRNAs of established function including peptidyl-transfer, tRNA maturation, pre-mRNA splicing and gene regulation [5], they serve as ideal systems to investigate the principles of RNA-mediated catalysis [6], as well as the general relationship between form and function for ncRNAs.
In this review, we describe techniques developed in our lab to investigate the hairpin ribozyme. This work has yielded a wealth of information on the conformational flexibility of this small RNA both nearby, and distal to the active site. The hairpin ribozyme is a naturally occurring, small RNA enzyme [7, 8] whose family members perform a reversible, site-specific SN2 transesterification reaction [9]. Cleavage of the hairpin ribozyme RNA substrate occurs when the A-1 2´-hydroxyl is deprotonated by an active site base [10] and attacks the phosphodiester linkage between residues A-1 and G+1 (Fig. 1A) [11]. The reaction proceeds through a trigonal bipyramidal phosphorane transition state whose products are a 5´-hydroxyl and a 2´,3´-cyclic-phosphate [12]. The hairpin ribozyme does not require a metal-hydroxide for rate enhancement, which implicates local nucleobases in reaction chemistry [13–15]. This all-RNA basis for catalysis makes the hairpin ribozyme an ideal model to understand the principles by which RNA achieves rate acceleration, which is highly dependent on maintenance of a specific tertiary fold [16, 17].
Figure 1.

Chemical reaction of the hairpin ribozyme and junction designations for constructs. (A) Chemical schematic of the hairpin ribozyme reaction coordinate. The scissile bond is located between residues A-1 and G+1. Group B represents a localized base; AH represents a localized acid; “+” is a localized positive charge. The pre-ligation state is formally equivalent to post-cleavage. (B) Cartoon schematic of various hairpin ribozymes and junction/hinge relationships utilized for structural and biochemical analyses (reviewed in [57, 121]).
The hairpin ribozyme is one of the most well studied small RNA enzymes. Biochemical work has pinpointed specific bases that affect the fold and function by mechanisms that alter long-distance contacts to destabilize the catalytic core, and by identification of active site variants that directly alter the chemical steps of catalysis [18–20]. Although numerous experimental methods have been employed to investigate the fold and dynamics of ribozymes, these approaches are faced with a daunting task when it comes to revealing the global, high-resolution conformation of all-atoms in states representative of the reaction coordinate. To address this challenge, our lab has taken a structural approach that uses X-ray crystallography.
Our basic strategy is to investigate how respective nucleobase variants influence the hairpin ribozyme fold in order to correlate structural information with functional results. To understand these modifications in the context of catalysis, it is ideal to capture them in conformational states representative of the reaction coordinate (Fig. 1A). Precedents for this approach exist for a variety of protein enzymes [21–24], as well as more recent applications to the 50S ribosome [25]. In these studies, substrates, products, or analogs representative of high-energy-intermediate states along the reaction coordinate are co-crystallized with the enzyme to induce functionally relevant conformational changes that could not be visualized otherwise. A major difference in our approach is that we have designed our hairpin ribozyme constructs so that any atomic position can be modified, provided a suitable synthetic organic pathway exists to produce the variant or the desired modification is commercially available. This approach is necessary because substitution of nucleotide bases with one of the other three, natural variants does not always produce the isosteric and/or isoelectronic differences of interest. In contrast, the twenty common amino acids of proteins offer a varied choice of chemical substituents to probe function [26]. The desired outcome of such modifications is the same however. Namely, production of a series of structures (x,y,z Cartesian coordinates in PDB format) that can reveal the location and magnitude of atomic changes that elucidate functional and dynamic properties.
To be useful, our approach requires numerous structures to build an ensemble, and its members must account for biochemical data, as well as be artifact free (e.g. crystal packing, differences in ionic strength, radiation damage, etc). In those instances where insufficient structures are available, dynamic information can be provided by sophisticated molecular dynamics approaches [27–31], or quantum-mechanical molecular mechanics [32, 33]. Such techniques can report on molecular motion including bond-breaking and making steps. Importantly, crystallographic coordinates such as those reviewed here often serve as starting points for the latter approaches. In this account we will focus mainly on crystallographic techniques since complementary methods are discussed elsewhere in this series.
2. The Hairpin Ribozyme: Constructs for Crystallography
Crystallography provides a cogent platform to relate structure and function. In this section, we will consider the prerequisites of RNA crystallography, which entails the choice of an appropriate construct for crystallization trials. It has been our experience that small RNA molecules with unusual structural features or tertiary folds can have a high proclivity to form crystals due to the strong, favorable propensity for pseudocontinuous helical packing [34–38]. Moreover, the ability of these molecules to extrude bases or sugars from internal loops, bulges and complex stem loops can lead to stabilizing intermolecular interactions perpendicular to the propagation of coaxially stacked helices. Nonetheless, the dynamic nature of RNA and its associated conformational heterogeneity can poison the lattice with packing defects that result in diffuse scattering [39] or poor Bragg diffraction [40]. For these reasons, it is the standard in the field to pursue changes to crystallization constructs, rather than examining numerous crystallization conditions [41, 42]. Before an RNA molecule is introduced into crystallization trials, many steps are undertaken to assure quality control in its production and characterization.
2.1. RNA Production: In Vitro Transcription versus Solid Phase Synthesis
The classic method to produce large quantities of RNA for crystallographic analysis is in vitro (run-off) transcription using T7 RNA polymerase [43]. Several excellent improvements of the fundamental approach have been reported in the literature. Heuristics have been established to guide the appropriate choice of the 5´-end complement within the template to favor polymerase initiation and product uniformity [44, 45]. The application of tandem 2´-OMe template modifications has been described to reduce non-templated addition of bases at the 3´-end of transcripts [46]. Significantly, protocols and materials have been developed for native (electrophoresis-free) purification and end homogenization by use of transcripts embedded with ribozyme and aptamer sequences [47, 48]. Each of these approaches is well suited for transcripts >35 nucleotides due to the decline in full-length products generated by conventional solid-phase chemical synthesis, which becomes limiting in longer strands due to incomplete coupling (95–96%) at each step.
Innovative methods for solid-support RNA synthesis have been developed that improve coupling efficiency to the level of 98–99%, which enables production of strands as long as 40-nt [49]. Our lab recently employed such methods for the experimental structure determination of a class I, 33-mer preQ1 riboswitch [38]. However, the most important consideration in the choice of in vitro transcription versus solid phase synthesis is the flexibility of the method for a given application. Use of solid phase synthesis can be empowering because it enables selection and incorporation of a diverse repertoire of site-specific base and backbone modifications suited for structural and functional analyses. Glen Research, Inc. (Sterling VA), Berry & Associates, Inc. (Dexter, MI) and ChemGenes Corp. (Wilmington, MA) offer a wide range of novel phosphoramidites. Such molecules can be incorporated into synthetic oligonucleotides from a variety of vendors such as Fidelity Systems Inc. (Gaithersburg, MD), Integrated DNA Technologies Inc. (Coralville, IA) or the W.M. Keck Foundation Biotechnology Resource Lab (New Haven, CT). Thermo Scientific (Chicago, IL) offers an array of phosphoramidites and synthesis options as well.
The oligonucleotide product of most conventional solid phase synthesis procedures leaves three functional groups that must be removed by subsequent workup. For a one µmol scale synthesis, the 5´-dimethoxytrityl (DMT) group can be detached by inclusion of 0.5 ml of concentrated glacial acetic acid with the dry, resin-bound RNA. After 30 min incubation at 20 °C, the solution should be light orange or pink, signifying hydrolysis of the DMT moiety. The reaction is terminated by flash freezing in N2 (I). The volatile reaction mixture is then lyophilized to a lightly pink solid. The sample can be stored at −20 °C.
Nucleobase protecting groups are then removed by addition of 0.5 ml of a 3:1 mixture of ethanolic ammonia hydroxide. The reaction is transferred to a water bath or heating block at 55 °C for 12 to 24 hours, depending on the protecting group; refer to the manufacturer’s instructions if in doubt. The reaction mixture is then flash frozen and lyophilized to produce a white fluffy powder. This process also removes the RNA from the resin beads. The sample can be stored at −20 °C.
The final substituent to remove is the 2´-tert-butyl-dimethylsilyl protecting group. This step can be accomplished by the addition of 0.25 ml of dry 1.0 M tetrabutylammonium fluoride (TBAF) in tetrahydrofuran (THF) (Sigma-Aldrich Corp., St. Louis). Caution should be observed before the addition of the TBAF solution. If the reagent appears to have a pink color, or is turbid, hydrolytic decomposition of the material has occurred and it should not be used; dry TBAF solutions are clear and colorless. The reaction is allowed to proceed at 20 °C for 12 to 16 hr, and is quenched with an equal volume of 1.0 M triethyl-ammonium acetate buffer (TEAA) pH 7.0. [Note: due to the sensitivity of deprotected RNA to protein ribonucleases, it is imperative that this step and subsequent ones take precautions to avoid sample degradation. As such, all stock solutions should be prepared from a NANOpure™ (Barnstead, IA) water system or equivalent equipped with a UV lamp and ultrafiltration capabilities. Glassware, tubing, columns and other items, such as plastic tubes and pipette tips, should be autoclaved if not already sterilized by the manufacturer. Non-volatile stock solutions should be autoclaved; all solutions should be 0.2 or 0.45 µm filtered. Although the use of diethylpyrocarbonate (DEPC) is employed by some researchers to deactivate ribonucleases, it has been found to leave reactive species that can modify RNA in undesirable side reactions. In practice, we have found that DEPC is unnecessary, provided one follows the precautions listed above].
The quenched RNA solution is desalted immediately by application to an 80 ml bed of Sephadex® contained in a 15 mm × 450 mm column prepared with autoclaved NANOpure™ water as the solvent phase. Care must be exercised in choosing the correct resin, which depends on the length of the oligonucleotide. Short strands from 5- to 18-mers can be subjected to DNA grade G-25 fine resin (Sigma-Aldrich, St. Louis). For ≥19-mers DNA-grade fine G-50 is employed (Sigma-Aldrich, St. Louis). The RNA is loaded in a quantity no greater than 5% of the void volume (or one-third the column volume) and can be eluted by gravity. One ml fractions are collected in plastic 1.8 ml microcentrifuge tubes. To monitor the eluting RNA, 20-fold dilutions are made of each fraction and the absorption is measured from a quartz cuvette at 260 nm with a spectrophotometer; water is used as a blank. The RNA fractions devoid of TBAF/THF are pooled, measured spectrophotometrically for yield and lyophilized to a white powder. The sample can be stored at −20 °C.
Upon desalting, the dry RNA is purified by HPLC. The oligonucleotide is suspended in ‘buffer A’ comprising 0.10 M TEAA pH 7.0 spiked with 0.25% (v/v) HPLC-grade acetonitrile as an antimicrobial. An analytical analysis of the sample begins by loading ≤125 µl into a 250 µl PEEK™ loop (Upchurch Scientific, WA) purged with buffer A. The sample is injected into a 19 mm × 300 mm μBondapack reverse phase C18 column (Waters Corp., MA) fitted with a C18 guard column (Water Corp., MA). The elution buffer ‘B’ comprises buffer A with 50% (v/v) acetonitrile. Samples are run with a linear gradient from 15% to 35% buffer B over 70 min at a flow rate of 6.0 ml min−1. Samples typically elute between 35 to 55 min with the void peak appearing at 12 min. After determining the optimal time and gradient for sample purification, preparative-scale injections are run (0.25 ml to 1.0 ml) with a larger loop that is at least 2× the injection volume. Elution is monitored by a UV/VIS spectrometer at 260 nm and the sample is collected in batch. In general, strands of length 20-nt exhibit a clear peak corresponding to the desired product. Major contaminants correspond to failure sequences that escaped complete coupling. The theoretical yield of product can be estimated as the coupling efficiency raised to the power of couplings, which is usually the strand-length minus one; the reader is referred to a ref. [50] for gradients and helpful optimization steps. The purified RNA is collected, flash frozen in N2(l) and lyophilized to a volume of approximately 0.5 to 1.0 mL to avoid irreversible loss due to over concentrating. The sample can be stored as a viscous liquid at −20 °C.
Following HPLC purification, the RNA samples are desalted to remove the concentrated TEAA remaining after lyophilization. Large RNAs can be desalted chromatographically as described above, but a faster alternative approach using Sep-Pak™ Vac C18 cartridges (Waters Corp.) can be used for <19-mers. A 20 ml volume of HPLC-grade acetonitrile (Sigma-Aldrich, St. Louis, MO) is used to activate the column. Next, the column is washed with an equal volume of autoclaved water. The RNA sample is loaded in a volume no greater than 2 ml. An additional 40 ml of autoclaved water is passed over the RNA-bound column to remove the salt. The sample is eluted with 40% (v/v) acetonitrile in water, and the eluate is collected in batch as volume of 12 ml. The quantity of sample is assessed spectrophotometrically and is lyophilized to a white fluffy powder. The solid sample can be stored at −20 °C and should be kept dry.
2.2. Single-Turnover Kinetic Analysis
Kinetic characterization of hairpin ribozyme constructs was crucial as a preface to structural studies. Cleavage reactions are conducted at 25 °C under excess ribozyme conditions. Activity is monitored by 5´-labeling of the substrate with 32P, which is accomplished enzymatically. The unlabeled substrate is added to a 13.6 µl reaction mixture comprising γ−32P ATP (7000 Ci mmol−1, 150 mCi ml−1), 10× kinase buffer (0.50 M Tris pH 7.5, 0.10 M MgCl2, 0.05 M DTT), and 1.4 µl of T4 polynucleotide kinase (10 U µl−1). The mixture is then incubated at 37 °C for one hour. The reaction is diluted with water to a volume of 450 µL and quenched by adding 1.5 µl of a 0.5 M EDTA stock with heating to 85 °C for 2 min. The RNA is isolated by ethanol precipitation with 450 µl of cold neat ethanol introduced by vortexing and storage at −20 °C overnight. The sample is then pelleted by spinning at 14000x g in a microcentrifuge at 4 °C for 15 min. The supernatant is carefully withdrawn and discarded. The pellet is resuspended for activity analysis.
For single-turnover kinetics, the ribozyme strands are combined in a buffer mixture of 0.10 M Tris-HCl pH 7.5. The starting concentrations for the ribozyme strands are 200 µM, and the 32P-labeled substrate is 2 µM. The RNA strands are annealed at 90 °C for three min and then cooled to 25 °C in 15 min. The reaction is initiated by the addition of 0.050 M MgCl2. Aliquots of 10 µl are collected at several time points and each is quenched with nucleic acid electrophoresis sample buffer containing 7 M urea. Reaction aliquots are then heated to 98 °C for 4 min and loaded onto 15% polyacrylamide gels containing 8 M urea. Substrate (13-mer) and product (5-mer) are visualized by exposure to an image plate scanned by a Storm 860 Plate Reader (GE Healthcare). Cleaved and uncleaved RNA bands are integrated using ImageQuant software (Molecular Dynamics). Integrated time points are fit to a double exponential equation to derive rate, fraction of substrate cleaved and amplitude values [51].
2.3. Interstrand Linkers to Create Stable Structures: Advantages of Solid Phase Synthesis and a Case for Screening Multiple Crystallization Constructs
The natural hairpin ribozyme consists of a four-way helical junction (4WJ) that joins two helix-loop-helix domains designated A and B [52] (Fig. 1B). These domains dock via tertiary contacts to form a catalytically competent complex [53, 54]. A variety of biophysical analyses have been reported that describe the process of domain association, which depends on multiple variables including ionic strength, as well as specific multivalent ions [52, 55–60]. These investigations were crucial to establish the conditions necessary for RNA folding prior to crystallization trials. The first global structure of the hairpin ribozyme was unveiled as a 4WJ construct, and indicated a compact, extended fold [61]. Elegant follow-up studies were also described in which synthetic substrates were produced to reveal modes of electrostatic stabilization and product binding [62]. However, the 4WJ structure was generated as a run-off transcription product that bound the U1A splicing protein as a crystallization module [42]. This paradigm produced a relatively sizable asymmetric unit that contributed to the reduced diffraction resolution of crystals including the inability to observe active site waters. From a structure-function standpoint, this approach was also limited in terms of the ability to explore the structural effects of numerous non-natural nucleotide analogs employed by the biochemical community [63]. To circumvent these shortcomings we approached this problem from a minimalist perspective with the goal of developing an all-synthetic construct amenable to high-throughput crystallographic analysis of point variations.
Prior biochemical investigations revealed that a minimal, junctionless hairpin ribozyme could be produced comprising the loop A and B domains separated at position 14 (Fig. 1B). Kinetic analysis of the junctionless construct revealed an ∼104 increase in KM compared to constructs harboring a ‘hinge’ at residue A14. In contrast, kcat was virtually unaffected. It was presumed that the decreased association was attributable to the energetic penalty associated with docking and rates of diffusion [64]. Our initial efforts to design and determine the crystal structure of a minimal, four-stranded synthetic hairpin ribozyme were met with success (Figs. 2A and 2B) (reviewed in [36, 65, 66]). However, the unfavorable energetic penalty created by loss of a junction generated problems with subsequent structural studies aimed at crystallizing analogs that destabilized the fold, such as abasic variants or product analogs devoid of the covalent linkage between A-1 and G+1. As a stopgap measure, we turned to non-nucleotide linkers that were introduced first in the work of Walter and colleagues. In this investigation an interdomain C3-propyl linker (i.e. the length of one nucleobase backbone) was introduced in addition to the existing A14 linker to promote interdomain docking (Fig. 1B), and to reduce unfavorable co-axial helical stacking of H2 and H3 observed in solution for the minimal, hinged constructs joined only by A14 [67]. Overall, this increased linker length enhanced docking rates by 35-fold [20]. In light of these observations, we chose to pursue crystal constructs harboring a C3-propyl linker (C3L) or a 9-atom poly(ethylene) glycol “spacer” (S9L) that spans the length of approximately two nucleotides.
Figure 2.
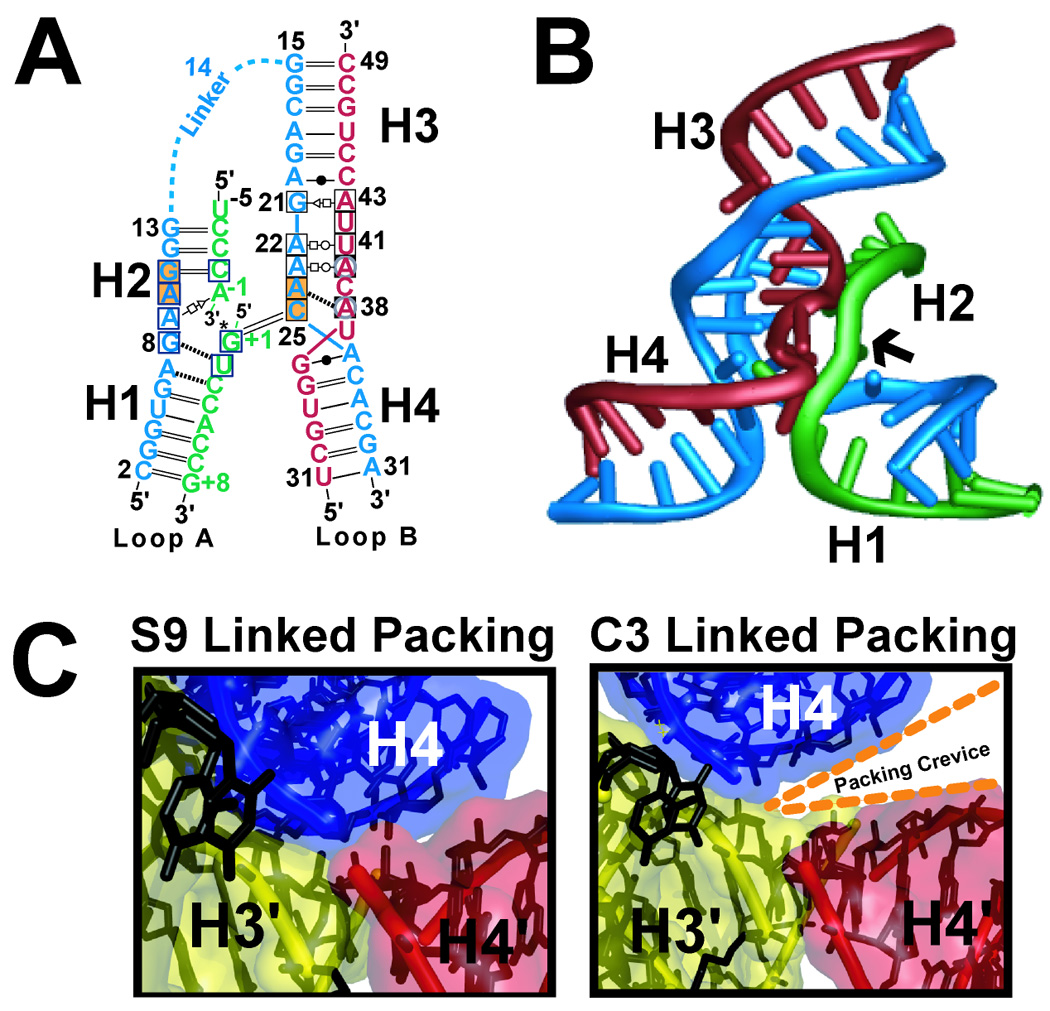
Representations of minimal hairpin ribozyme constructs. (A) Secondary structure of the minimal hinged hairpin ribozyme adapted from MacElrevey et al. [68]. The substrate strand is depicted in green, the S-turn strand is in red and the 29-mer strand is blue. Conserved residues with blue or black borders are boxed; orange backgrounds indicate residues of the ribose zipper; white boxes with black borders indicate E-loop residues and circled gray residues belong to the S-turn. Hydrogen-bond pairings: open-square, Hoogsteen; open triangle, trans-sugar, open circle, Watson–Crick face; closed circle, wobble pair. Double and single lines indicate Watson–Crick pairs; black dashed lines indicate single hydrogen bonds. (B) Structure of the minimal, junctionless hairpin ribozyme from ref. [66]. An arrow indicates the scissile bond. (C) Cartoon diagram of the minimal, hinged hairpin ribozyme structure described in ref. [68].
The linked constructs employed were produced by solid-phase synthesis from commercially available phosphoramidites. The three strands utilized were: a 13-mer substrate strand, a 19-mer ribozyme strand, and a 29-mer linked ribozyme strand (Fig. 2A). The latter strand was created by placing either the C3L or S9L linker in place of residue A14 to hinge the 17-mer and 12-mer strands used for junctionless constructs [68]. We assessed the single-turnover cleavage activity of each hinged construct, as well as the junctionless variant, and fit the experimental data to a double exponential equation [51]. All three constructs displayed similar rate profiles, but the hinged constructs produced greater total amplitudes (81% for S9L and 78% for C3L) relative to the junctionless construct (54%), suggesting a larger population of productively docked species forms in the hinged state. These observations also suggested that the nature of the linkage was immaterial.
Crystallization trials of the respective C3L and S9L constructs yielded similar crystals with a hexagonal habit [68]. However, there were noticeable differences in crystal quality. The S9L crystals diffracted to 2.65 Å whereas the X-ray diffraction limit of C3L crystals was 3.35 Å. Due to similarities in activity, we felt it was important to elucidate the structural basis for the observed diffraction differences. In doing so we sought to arrive at an ideal construct for additional, challenging structural and biochemical analysis. Below we describe the resulting differences in local packing environments of S9L and C3L constructs, which would not have been predicted based on the equivalent solution activity data. These observations demonstrate the importance of interrogating multiple macromolecular constructs by crystallography.
X-ray diffraction data collection and structure determinations for the two hinged constructs were described previously [68] and is reviewed in Section 3. Superpositions comprising all atoms from the respective linked structures were performed using the program LSQKAB as implemented in the CCP4 suite [69]. The results revealed root-mean-square displacement (rmsd) values of 0.77 Å with the global fold and active sites overlaying well. However, there were noticeable deviations between the two structures with respect to the packing interactions along the 61-screw axis (Fig. 2C). The average atomic displacement parameters (B-factors) were markedly different as well. For a description of the B-factor, the reader is referred to ref. [70].
The average RNA B-factor (thermal motion) for the C3L structure was 95.6 Å2, which is significantly higher than that of the S9L structure whose average was 78.5 Å2. In general, an individual atomic B-factor can be considered an indicator about the certainty of an atomic position. High B-factors indicate less confidence in atom placement and usually obey a trend that reflects solvent accessibility in the structure. Solvent exposed positions tend to exhibit higher B-factors than nucleobases packed in a core interface. In crystals of our linked structures, packing interactions between helix H4 and its symmetry mates H3´ and H4´ governed 61 -screw axis formation. Such interactions are markedly different for the respective structures (Fig. 2C). Importantly, the displacement of the terminal base pair of H3 by the shorter (more strained) C3L variant increased its helical twist by 60o in comparison to the S9L structure. Contraction of the H3 helix in the C3L structure forced the terminal end of H4´ to shift, leading to a packing cleft (Fig. 2C). This cleft was hypothesized to promote structural disorder that propagated throughout the crystal, decreasing the relative diffraction quality. A take home message is that the packing effect was governed directly by the interdomain linkers and was not present in the junctionless construct, which packed similarly to the S9L variant. Importantly, the mode of intermolecular coaxial helical stacking that dominates each of the minimal hairpin ribozyme crystal forms is highly reminiscent of the intramolecular mode of packing by the natural 4WJ crystal structure [71]. In fact, the overall fold of the minimal ribozymes is extremely similar to the 4WJ, which provides strong evidence that the minimal crystal structures are representative of conformational states accessed by the 4WJ, which adopts a significantly more stable native fold in solution.
Overall the stark differences between the C3L and S9L linked minimal hairpin ribozyme constructs illustrate how subtle differences in macromolecules with the same global fold can bring about differences in crystal packing and X-ray diffraction. This is especially important given the striking similarities in the solution activity. Thus, although interdomain linkers should be considered when weighing the options for the production of a minimal RNA crystallographic construct, efforts must be circumspect by use of biochemical and crystallographic screening techniques.
2.4. Case Study of Engineered Crystal Contacts Employing a Dangling 5´-Uracil
In the prior section we demonstrated how the use of linkers at strained domain junctions could promote differences in structure that enhance or diminish crystal packing. Additional, knowledge-based changes can be employed to improve crystal order. In this section, we cover the use of overhanging ends on helices to promote pseudocontinuous helical packing. A previous structural investigation from our lab focused on an in vitro selected, small ribozyme known as the leadzyme [34]. To promote intermolecular helix stacking, we tested constructs with 5´-G and 5´-C base overhangs [72]. This strategy also considers that an ideal A-form helix possesses 111 rotational symmetry [73]. Thus, simply employing complementary base pairs does not assure the RNA will achieve an integral number of turns in the context of the unit cell. As such, base-pairs in the helical stem must be added or deleted [72]. The circumstances become considerably more complicated when the helix under consideration possesses internal loops or bulges that can alter the ideal 111-symmetry as was the case for the leadzyme, which utilized paired 11-mer and 13-mer strands. Difficulty in predicting the helical contact points for the hairpin ribozyme – and the absence of a known hairpin ribozyme structure at the outset of this work – prompted use to employ blunt ended G–C rich helices in our original crystallization constructs [36]. Blunt-ended packing has considerable advantages in terms of the rotational freedom required for two helices to engage in an intermolecular co-axial stack. As such, blunt ended helices should be a first choice when 111-symmetry cannot be surmised. However, the inclusion of sticky ends should be considered to improve diffraction, once initial structural information is available to guide design, as observed for the hairpin ribozyme [36].
The minimal, junctionless hairpin ribozyme construct first crystallized in our lab was a 64-mer with an adenosine (A14) at the end of helix H2 [36, 65]. In the 4WJ variant, this adenosine engages in a Watson-Crick pair with residue U-5 [61]. Upon determining its structure, the junctionless 64-mer was observed to unstack A14 from the end of helix H2 into the crystal-packing environment about the 61-symmetry axis, thus precluding a Watson-Crick base pairing interaction with U-5 (Fig. 3A). Displacement of A14 was caused in part by crystal contact with a symmetry related U-5´. We surmised that expulsion of A14 from the H2 helix and the absence of a co-axial helical stack by symmetry-related H2 and H2´ partners was a major source of structural disorder. Indeed, the original diffraction resolution of the junctionless 64-mer was 3.17 Å [65]. Remarkably, diffraction was improved to 2.05 Å resolution when A14 from helix H2 was deleted from junctionless constructs. Inspection of the new crystal-packing environment revealed two important features that appeared to favor crystal order and stability. First the dangling H2 U-5 base formed a hydrogen bond interaction with a symmetry related base (Fig. 3B). This interaction relieved the unfavorable strain caused by A14. More importantly, the coplanar packing of the U–U pair promoted pseudocontinuous helical packing in the unit cell. Work by Turner and colleagues demonstrated that a 5´-dangling U adds only 0.4 kJ mol−1 to duplex stability [74]. However, base stacking at a “sticky” coaxial helix interface confers ∼4 kJ mol−1 [75, 76]. A substantial gain in stability is also realized by a U–U mismatch flanked by 5´-G and 3´-C base pairs (Fig. 2A) [77]. These observations suggest the utility of consulting ‘nearest neighbor’ parameters [78] in the design of interactions to improve crystal packing.
Figure 3.

Representations of the dangling U-5 mismatch. (A) Ball-and-stick representation of the coordinates resulting from a steric clash between U-5´ and A14 in the junctionless 64-mer construct [65]. Blue spheres are nitrogen atoms, and pink spheres are oxygens. (B) Ball-and-stick representation of the U-5:U-5´ anti-anti ‘Calcutta’ conformation in the re-engineered 61-mer construct; the orientation is similar to (A). Alternate conformations (red and orange) were modeled across the two-fold axis with equal occupancy. (C) Cartoon representation of the observed pseudocontinuous helical packing. The intermolecular helical junction is located between two H2 helices related by proper crystallographic symmetry. The molecules are paired through a U-5:U-5 base pair (CPK models) indicated at the intersection of the broken boxes surrounding the respective hairpin ribozyme molecules. The blue and green helices represent H3 and H4 of different, symmetry-related molecules.
It is instructive to consider the details of the U–U pair in the re-designed crystal structure. To proceed with structural modeling, we consulted a survey of non-canonical base pairs [79], and biologically relevant crystal structures that harbored a U–U mismatch – most notably the 30S T. thermophilus ribosomal subunit [80]. Furthermore, because the U–U interaction was restrained by proper two-fold symmetry, and exhibited two prominent conformations for each nucleotide, the chosen model needed to fit both possible spatial conformations (Fig. 3B). To start, one base-pairing configuration was examined in which opposing uracil bases adopted an equal mixture of anti and syn conformations about the N-glycosidic linkage [68]. Although this configuration optimized the hydrogen-bond interactions between the Watson-Crick faces, a syn conformation is not favorable for a pyrimidine [73]. A second conformation was modeled to fit the electron density in which opposing Watson-Crick faces formed a single hydrogen bond between N3 and O4. All base conformations were restricted to be anti for U-5. Ultimately, the latter configuration produced a lower Rfree value and conformed to comparable anti-anti U–U pairs reported (reviewed in ref. [68]).
Overall the results suggest the power of manipulating blunt and sticky ends to promote pseudocontinuous helical packing, which is a dominant crystal packing force. The results herein also represent a special case since efforts were made to improve crystal contacts based on prior structural knowledge (i.e. the original 64-mer) to generate high-resolution X-ray diffraction to facilitate structure-function investigations. Factors to consider include: (i) placement of interdomain linkers versus the use of isolated domains, (ii) base deletion and (iii) promotion of intermolecular base pairs by application of dangling helical ends. These factors helped to improve the diffraction of the minimal hairpin ribozyme from 3.17 Å to 2.05 Å resolution. However, it must also be considered that well-diffracting crystals from the re-designed construct were achieved only after a new round of crystallization trials using a broad range of conditions [72]. The resulting low salt 61-mer crystal form was nearly identical to that of the initial high salt 64-mer in terms of unit cell constants and preserved the space group [65]. Rescreening of crystallization conditions for redesigned constructs should be a routine practice in the RNA crystallographer’s toolbox. For more comprehensive methods used in RNA crystallization the reader is referred to refs. [40, 72, 81, 82].
3. Detecting and Interpreting Multiple Conformations in Electron Density Maps
A central challenge in understanding the mechanism of action of ncRNAs is to elucidate how changes to the natural sequence alter form and function. Although crystallography cannot report directly on function, it is a valuable tool for its ability to provide local, as well as global information about conformational states at the molecular level. As stated in Section 1, too much molecular motion blinds conventional crystallography by smearing the electron density distribution. However, there are circumstances in which two or more static structures can be resolved discretely, lending insight into the location and magnitude of molecular movements. A common example is the existence of two or more molecules in the crystallographic asymmetric unit that adopt different conformations [34, 35]. Frequently, this phenomenon is the result of variations in the crystal-packing environment of the respective molecules. However, rather than dubbing these as ‘packing artifacts’, it is more probable that each structure represents a solution conformation that has been stabilized by molecular contacts in the crystal lattice. Like proteins, the crystals of RNAs often comprise relatively high solvent contents of ∼65% [83] with only sparse intermolecular contacts that are unlikely to alter the global structure, but can shift the conformational equilibrium.
A second scenario in which multiple conformations can be observed is the nucleobase or backbone itself within a single molecule [84]. The latter instances are rare, and it is often technically challenging to deconvolute the conformational variations being detected. Atomic resolution diffraction data on the order of 1.0 Å can greatly facilitate this process. In addition, the additional reflections at high-resolution greatly improve the observation-to-parameter ratio in refinement (i.e. over determination), which enables anisotropic modeling of the individual atomic B-factors as thermal ellipsoids. Although such modeling is atypical for large RNA molecules, anisotropic refinement of moderately-sized structures (<30 nt) has been achieved [84] revealing the magnitude and direction of atomic displacement, which can provide dynamic information.
In this section, we discuss dual RNA conformations in the context of intermediate resolution (∼2.0 Å to 2.7 Å) electron density maps. Confidence in the ability to model such conformations is proportional to the resolution of X-ray diffraction, the number of ordered conformations present, as well as the agreement of the resulting model with the experimental data. As such, it is appropriate to first discuss some practical aspects of crystallography, such as the generation of electron density maps. Although these methods are specific for the cases discussed herein, the basic principles can be applied to other investigations.
3.1 RNA Refinement Tips
Many excellent reviews describe the process of obtaining initial phases from experimental or other means [72, 85–87]. For instances in which all or a portion of the RNA strands can be produced by chemical synthesis, it is worth noting that 5´-iodo or 5´-bromo uracil can be readily incorporated for phasing purposes [88, 89]. In our case, the minimal hairpin ribozyme construct was solved by molecular replacement using a portion of the 4WJ structure as a search model [65]. As such, it has been possible to use difference Fourier methods to phase subsequent structures since the changes introduced did not significantly alter the global structure. Most commonly, the c-axis of the unit cell changes, and has varied by as much as 130 Å ± 15 Å from structure to structure [e.g. see ref. [68]]. Nonetheless, such structures could still be solved using difference Fourier approaches. Like other strategies for structure determination, difference Fourier synthesis relies on the collection of complete data of high redundancy, good internal agreement (Rsym) and a suitable starting model. The steps involve: (i) conversion of intensities to amplitudes; (ii) rigid-body minimization of domains; (iii) individual atomic position refinement; (iv) individual atomic B-factor refinement; and (v) manual rebuilding with an interactive graphics program. Various restraints and quality control indicators must be checked along the way. It is assumed below that the reader has a fundamental understanding of crystallography.
Several excellent software suites are available for crystallographic refinement of RNA models such as PHENIX [90], REFMAC [91] or CNS [92, 93]. These programs employ maximum likelihood targets and cross-validation [94–96]. Maximum likelihood requires a Wilson distribution of intensities, which uses the full resolution range (e.g. 100 to 1.0 Å) with no artificial sigma cutoff [97]. One rule of thumb has been an intensity cutoff of I/σ(I) ≥ −3 during scaling, although a sufficient signal-to-noise is required (of course) to gauge the effective resolution range of data suitable for refinement. Several discussions have been written about collection and scaling of intensity data, as well as the application of signal-to-noise restrictions [98–100]. Choice of the cross-validation data (test set) for the Rfree calculation requires careful consideration because RNA structures can have small unit cells or poor resolution, thereby reducing the number of observations. In practice 5–10% of the data are removed at random and excluded from refinement [96]; the remaining data comprise the Rwork. We find that the minimal number of test reflections is ∼600 for a moderate resolution hairpin ribozyme data set (see ref. [96]). For example, at 2.65 Å resolution the hairpin ribozyme (P6122 with a = 93.0 Å and c = 133.0 Å) there are ∼10900 unique reflections. Therefore a suitable test size is 5.5%. However, the same crystal form at 3.2 Å resolution would exhibit only ∼6000 unique reflections, which requires 10% of the data for the test set. An essential practice is that the test set from the original structure determination be reused for each subsequent difference Fourier-based refinement to avoid propagation of statistical bias [101]. In cases where the number of unique observations-to-refinement parameters is low, the Rfree should be used to guide the choice of applied restraints or constraints to avoid overfitting [101]. Due to its small asymmetric unit of 1300 non-hydrogen atoms and medium to excellent diffraction, (2.85 to 2.05 Å) the hairpin ribozyme avoids many of the latter pitfalls.
The difference Fourier solution for a given hairpin ribozyme variant begins with our highest resolution junctionless coordinates, PDB entry 2OUE [68]. These starting coordinates are fit against the new amplitudes using rigid-body refinement, which makes gross translation and rotation changes to the global structure. Because the hairpin ribozyme comprises two internal loop domains (Fig. 2B), these are separated subsequently and refined independently as loop A (comprising H1, the internal loop and H2), and loop B (comprising H3, the internal loop and H4). Following rigid body refinement, the crystallographic Rwork is ∼35% to 38%, with Rfree between ∼37% to 41%. It is important to note that all data must be corrected for the contribution of bulk solvent since the full resolution range is used in maximum-likelihood refinement. We have noted that the bulk solvent correction of CNS may require manual intervention if the Rwork and Rfree values do not decrease during rigid-body refinement. Guidelines for adjusting the bulk solvent correction are described in refs. [93, 102].
Positional minimization of the individual atomic coordinates is then employed to the rigid-body-refined output to improve the fit of the model |Fcalc| and the experimental data |Fobs|. This procedure normally reduces the Rwork and Rfree values by ∼2% to 5% during the first round. The weighting of the X-ray term and stereochemical terms can be modulated if suitable target values are not obtained. In CNS, this value is known as the wA term [92]. We suggest that suitable target values for rms bonds and angles are 0.009 Å and <1.5°, although target values will vary based on the available resolution and quality of data. In general, poorer resolution structures should be more tightly restrained to obey ideal geometry.
The B-factor is an indicator of the temperature-dependent vibration of an atom, but also reflects the positional differences of an atom averaged over all unit cells in the crystal. Following positional refinement the individual atomic B-factors are adjusted to improve the fit of the model |Fcalc| and the experimental data |Fobs|. It is assumed that the B-factors of the initial phasing model were reset to the value obtained from the slope of a Wilson plot, which is a reasonable first approximation. In our studies of the hairpin ribozyme, Rwork and Rfree may decrease by as much as 5% to 8% during the initial round of B-factor refinement. As in protein crystallography, the refined B-factors should be sensible in terms of their location and solvent accessibility in the structure. For example, atoms in the folded core should exhibit lower B-factors than those on the surface of the molecule. B-factors should vary smoothly between bonded atoms and should not change precipitously. These effects can be controlled during refinement by adjusting the weighting if necessary. Like the wA term for stereochemistry, CNS possesses the rWEIGHT [92], which influences the deviation of B-factors from target values for defined atomic groups. Unlike proteins, which are divided into main-chain and side-chain groups, there are no such definitions for RNA. Therefore, the user may choose to assign these groups and decide upon a suitable target deviation. There are no hard and fast rules for RNA, but our lab defines bases in one group, and backbone atoms as another. The target rmsd values are set comparably to proteins with the assumption that bases will have lower B-factor deviations due to base stacking and burial in the core (which is not always true). Monitoring of B-factor trends throughout refinement is highly recommended. B-factors that are too high or too low can be indicators of an incorrect model. In cases where the B-factors are much higher than average, the model may be disordered (i.e. no reasonable electron density exists). However, it is also possible that this portion of the model has been moved out of maps due to a conformational change or inadvertent application of restraints. Higher than average B-factors can also be caused when two or more alternate conformations exist. In these instances each conformation is built and the atomic occupancy of each is adjusted to produce B-factors comparable to the surrounding single-conformer atoms; more on this topic is described in Section 3.2. When B-factors are too low, there is not enough scattering power in the model to account for experimental observations. This scenario may arise when a water molecule is assigned in place of an ion. When convergence in the Rwork and Rfree has been achieved through iterative rounds of positional and B-factor refinement, reduced bias 2Fobs-Fcalc and Fobs-Fcalc electron density maps [103] should be calculated to assure the success of the refinement process and to conduct interactive model building.
Visual inspection of electron density maps is an essential aspect of RNA structural refinement and the quality control process. The RNA model can be displayed in the context of multiple maps and contour levels with interactive graphics programs such as O [104] or COOT [105]. During this process, a variety of model manipulation commands and routines are available to improve the fit of atoms to the electron density. A 2Fobs-Fcalc map contoured at the 1.0σ level (one standard deviation of map above noise) should completely envelope the model, but can also reveal regions that are absent from the model that must be built. Additional contour levels at the 3.0 and 6.0σ levels can reveal electron-dense atoms, which help to determine the centroid position of phosphorus atoms or metal ions. Phosphorus electron density should be observed at levels ≥3σ for ordered positions. It is recommended that symmetry-related molecules be displayed during the building process to assure reasonable contacts between neighboring molecules. Difference electron density maps with coefficients Fobs-Fcalc should be displayed as well. Features present in the experimental data, but not in the model, will exhibit positive peaks; a level of +3.0σ is a good starting point to set contours. In contrast, negative features at the −3.0σ level represent features in the model that are not present in the experimental data. Such portions of the model must be removed or altered to ‘flatten’ the map. Repetitive rounds of minimization and manual model building are routine, and ensure that the molecular model agrees with the experimental data and exhibits stereochemically correct information. It has been suggested for proteins that Rwork values be below 25.0% [106]. Rfree values are highly sensitive to global model errors and mistraced proteins have exhibited Rfree values 13% higher than Rwork [96]. With good model-building practice and the use of maximum likelihood targets Rfree values should be no more than ∼8% higher than Rwork [95]; Rfree values above 40% have been noted to be beyond a threshold of model correctness [96]. Following completion of refinement, the test set is restored to the work set and the overall Rfactor is calculated using a residual (least-squares) target. This value should be nearly identical to Rwork. It is recommended that refined coordinates be subjected to a structural validation program, such as MOLPROBITY [107], prior to PDB deposition.
3.2 Recognizing and Modeling a Large-Scale Alternate Conformations
We will now examine a case study representing a large-scale conformational change indicative of dynamics in the hairpin ribozyme S-turn. Previously, the Burke lab described the U39C gain-of-function variant, which was identified in several selection experiments aimed at elucidating the minimal hairpin ribozyme catalytic core [108, 109]. The U39C variant served as a stimulator of enzymatic activity by increasing kcat by nearly 4-fold under Mg2+ depleted conditions [110]. To elucidate the basis of this change in function, we undertook an investigation of the minimal hairpin ribozyme in both native (U39) and gain-of-function (U39C) states [65].
The results revealed that the two variants were nearly isomorphous with an overall rmsd of 0.4 Å for all matched atoms, which is at the level of the estimated coordinate error of 0.5 Å [65]. Continuous electron density was observed for the entire backbone of both structures although some differences in conformation were noted in the electron density at position U37 (Fig. 4A). Initially, the U37 base was modeled in a conformation in which its base projects into bulk solvent and points away from the active site. This conformation is similar to that observed in the 4WJ hairpin ribozyme variants [61, 62], but left a considerable amount of unoccupied electron density (Fig. 4B). As such, it was hypothesized that U37 was conformationally flexible and may be occupying two states.
Figure 4.

Representations of dual conformations for residue U37. (A) Simulated-annealing-omit electron-density map for residue U37 of the wild-type (U39) minimal (JL), all-RNA hairpin ribozyme. Maps are contoured at the 3σ (purple) and 8σ (green) levels and have reduced-bias σA coefficients (mFobs - DFcalc). (B) Ball-and-stick representation of the U37 residue modeled in Conf-1, as observed in the 4WJ structure. Red atoms are oxygen, orange atoms are phosphorus and blue atoms are nitrogen. (C) Ball-and-stick representation of the U37 residue modeled in dual conformations. (D) The U39C gain-of-function variant in the context of the S-turn. Putative hydrogen bonds are depicted as dashed lines. (E) The wild-type (U39) S-turn organization.
Dual conformations were then modeled for residue U37 (Fig. 4C). Each conformation was modeled with 50% atomic occupancy to optimize the atomic B-factor agreement of each conformer with neighboring atoms. To check the veracity of the refined model, we also calculated simulated-annealing-omit electron-density maps in which both alternate conformations were removed from the phase calculation [111]. In this procedure, the remaining model is used as the source of phases, but it is subjected first to simulated annealing to reduce model bias introduced by prior steps. A new “unbiased” map is calculated to assess the fit of the prior model – adjustments are made accordingly. Additional rounds of refinement and manual building are necessary to arrive at a final model, which ultimately should lower both the Rwork and the Rfree values. In our example, statistics improved by ∼0.4%. Following refinement, the molecular characteristics of both U39 and U39C structures were compared in this region. Least-squares superpositions revealed a maximum difference of 13 Å in the U37 base position (Figs. 4D & 4E). In the more sequestered Conf-2 U39 wild-type structure, the 2´-OH of U39 makes an extra hydrogen bond to the pro-Rp oxygen of A38. Additionally, the 2´-OH of U37 is likely held near the active site by a water-mediated interaction to O4´ of G+1 (see below), which is an integral part of the active site. The solvent exposed Conf-1 orientation of the U39 (wild-type) structure does not display either of these hydrogen-bonding characteristics. The paucity of interactions to either conformation accounts for the observed equilibrium, which is free of crystal contacts in this region unlike its 4WJ counterpart [65].
The U39C variant did not display conformational heterogeneity at position U37. Instead the U39C substitution favors placement of the U37 nucleobase into the sequestered (Conf-2) state (Fig. 4D). Substitution of the wild-type U39 O4 oxygen with an exocyclic amine creates a new hydrogen bond interaction with the pro-Rp phosphate oxygen of U37. This interaction is absent in the wild-type structure due to lack of a suitable hydrogen-bond donor, and appears to be the main factor in promoting the Conf-2 state at U37. Like the Conf-2 state of the wild-type sequence, the U39C variant forms a water-mediated hydrogen bond between its 2´-OH and a nearby water molecule that interacts with the O4 atom of G+1. Because the U39C variant favors catalysis under reduced Mg2+ conditions, it seems likely that the observed contact between U37 and G+1 is productive for catalysis, and that the placement of a stabilizing hydrogen-bond donor in the S-turn arising from U39C reduces the dependence of this motif on Mg2+ for folding. As we will see, key nucleobase A38 resides between U37 and U39 in the S-turn. Therefore, stabilization of this structural element directly influences active site form and function.
The take home message of this section is that electron density maps can provide evidence for dynamics. However, this work does not provide a timescale or pathway for molecular motion. Importantly, the results for the U39C gain-of-function variant suggested that adoption of a more compact, sequestered core could improve catalysis, possibly by conferring additional productive binding energy to the transition state. From an energetic vantage point the ∼5-fold relative change in kcat/KM is modest and accounts for only a few new hydrogen bonds, as observed [65]. Nonetheless, the results are consistent with solution observations, and are illustrative of how dynamic motions in RNA can influence the active site from a distance.
4. Structural Ensembles to Interrogate the Effects of Single-Base Variations on Function
Crystallography by its nature produces static images of molecules that have reached an energy minimum during the course of crystal formation. However, the introduction of subtle changes at key positions identified by biochemical methods can be used to perturb the conformational equilibrium of the molecule, and thus provide the basis for a comparative structural analysis provided that differences exceed the coordinate error of the refinement procedure. In this manner, crystallographic ensembles can be assembled that report on the dynamics of the local environment. Importantly, since enzymes access multiple conformations on the reaction coordinate, it is necessary to consider how such states can be trapped, and whether the results account for biochemical observations. In this manner, crystallographic techniques can be employed to report on how key chemical interactions influence structure and activity. In this section, we describe efforts to relate various pre-catalytic and reaction-intermediate (transition-state) conformations to losses of function resulting from site-specific base variations shown to alter solution activity by 10- to 104-fold. In general, changes in scissile bond geometry appear correlated with solution data, but surprising local conformational changes are observed that could not be predicted by other means, thus demonstrating the power of this approach.
4.1. Notes on Generating Crystallographic Ensembles by Least-Squares Superpositions
The superposition process relies upon designation of a reference molecule that remains stationary. In the process of least-squares minimization a working molecule is rotated and translated to optimize the rmsd agreement with the reference structure. A robust program to superimpose coordinates is LSQKAB by Kabsch [112]. There are two popular ‘incarnations’ of this program, LSQMAN [113] and CCP4 [69]. Due to the special atom-naming requirements in the former, we prefer CCP4 for RNA alignments. In a typical scenario, a high-quality reference molecule is chosen, such as PDB entry 2OUE – a pre-catalytic junctionless hairpin ribozyme refined to 2.05 Å resolution. The new working molecule is derived from a functionally interesting point-variation of the hairpin ribozyme whose structure is determined by difference Fourier methods (Section 3). Average rmsd values for isomorphous structures of the hairpin ribozyme, solved by difference Fourier are ∼0.4 Å. However, the least-squares output also reveals maximum distance differences, which indicate areas of large change that contribute little to the average rmsd. For example, the maximum rmsd for the Conf-1 and Conf-2 states of U37 of the hairpin ribozyme (Section 3.2) was 12.6 Å. Similarly, least squares was also used to compare the minimal hairpin ribozyme with the core 4WJ crystal structure, which superimposed with an rmsd of 1.3 Å over 61 nucleotides comprising 54% identity [65]. This observation indicates the excellent agreement of these independently determined structures.
Overall, the use of least-squares superpositions can be informative in terms of detecting and generating conformational ensembles comprising several structures oriented on a reference molecule. To be valid, the magnitude of any changes must be gauged by comparison to the mean coordinate error of the respective input structures. Estimation of coordinate area by cross-validation methods is described in ref. [101]. Trends in the ensemble differences should account for solution activity observations, which will be discussed in the next section.
4.2. Case Study of G8-Base Variants on Pre-Catalytic Scissile-Bond Geometry
Phosphoryl transfer SN2 reactions require ‘in-line’ atom configurations for the attacking and leaving groups with respective to the reactive phosphorus (Fig. 1A). However, in-line geometry accounts for only ∼100-fold in rate acceleration [114]. To investigate the role of active-site-base G8 in predisposing the scissile bond to catalytic attack, we determined pre-catalytic structures in which a variety of base variants were substituted at position 8. We then attempted to correlate the structural observations with the functional results of a prior solution study. Previously, Burke and colleagues examined a series of base variants at position 8 that produced a 10- to 300-fold loss in catalytic activity [115]. From these experiments, there was an observed correlation between the catalytic proficiency and the protonation state of the free nucleobase in solution with the preference: G > DAP > I > AP > A > U. Moreover, each of these variants displayed an effect after interdomain docking, supporting a role in catalysis rather then folding.
We proceeded by determining crystal structures of each variant in the context of a 2´-O-Me group placed on the nucleophile of residue A-1 to prevent cleavage. Due to the near in-line geometry of the resulting inert structure, this variant of the 4WJ hairpin ribozyme was dubbed a ‘pre-catalytic’ conformation [61, 62]. In addition to determining the “wild type” 2´-O-Me A-1/G8 structure in the context of the minimal, junctionless hairpin ribozyme construct at 2.05 Å resolution, we applied difference Fourier methods to determine structures of the variants. Crystal structures were refined in a resolution range of 2.3 Å to 2.7 Å [66]. Careful model building for each base variant, as well as the neighboring scissile phosphate, was conducted using reduced-bias (σA-weighted) electron density maps and simulated-annealing-omit maps as described in Section 3.
Refinement of these structures created a nexus for understanding the effects of nucleobase substitutions on pre-catalytic geometry and local structural organization. A series of all-atom superpositions was conducted using the wild-type, 2´-O-Me A-1/G8 structure as a reference model. The results revealed the largest rmsd values occur at the scissile bond between residues A-1 and G+1 (Figs. 5A & 5B). The electron density in this region was well defined among structures [66]. The close agreement of all other core atoms, such as A38 and G+1, suggests the change in geometry results only from variations at position 8 that do not propagate throughout the structure. The ensemble calculation also suggested that the in-line phosphoryl-transfer angle has the ability to rotate by as much as 65o [66]. Importantly, the trend toward in-line geometry closely followed solution activity: G > I > DAP > AP > A > U. As expected, changes in scissile bond orientation are influenced by the ability of various position 8 functional groups to donate or accept hydrogen bonds. Structures for A8 and U8 displayed apparently non-productive interactions with A38. These variants were least in-line (Fig. 5A) and most inactive in solution studies.
Figure 5.

Structural ensemble of G8 variants in a pre-catalytic context. (A) Superposition of position 8 variants colored as depicted in the inset. A dashed arrow indicates conformational variations of the scissile bond. Key: colored representations of position 8 variants colored in order of their in-line geometry about the O2´-P-O5´ scissile bond between A-1 and G+1. (B) View from (A) rotated by 90° about the x-axis.
The ensemble approach demonstrates how optimal, pre-catalytic active-site geometry can be altered when local functional groups change subtly. This work also reveals the importance of specific G8 functional groups, such as the N2 exocyclic amine, which prevents formation of non-productive ground states. Likewise a role for the N1-imine group of G8 is important to orient the 2´-OH nucleophile at A-1. Variants such as A8 and AP8 that cannot donate a comparable hydrogen bond produce altered sugar puckers at A-1 [66]. In contrast, I8 and DAP8 maintain the N1-to-2´-OH interaction, which improves pre-catalytic in-line geometry, thus avoiding non-productive conformational states. One perceived weakness of this investigation was that the position 8 variants were not examined in the context of a transition-state analog. An approach to examine base variants in conformational states representative of discrete points along the reaction coordinate will be discussed next.
4.3. Case Study of Single-Base Variants in the Context of Transition-State Analogs
Enzymes accelerate reaction rates by lowering the activation energies of chemical reactions (EA or ΔG‡) (reviewed in ref. [116]). This lowered ΔG‡ is governed by active-site interactions with the substrate that distort it into the transition state. However, observing the structure of a transition state is an intractable prospect with conventional crystallography due to its transient nature. To overcome this obstacle, it is necessary to trap the enzyme in an activated conformation by use of a transition-state mimic. Often these molecules induce structural changes through stereochemical or electrostatic mimicry of the genuine transition state without chemical turnover. Our lab and others previously employed the phosphorane mimic vanadate to elucidate how specific functional groups bind to the hairpin ribozyme substrate during the transition state [62, 116]. However, the ∼50% atomic occupancy of vanadium in our electron density maps led to structural heterogeneity of key active site residues such as G8. In addition, the use of vanadate necessitated the use of a two-stranded substrate mimic severed between A-1 and G+1 (i.e. a 5-mer and an 8-mer). Such a substrate was not amenable to folding by junctionless constructs, which necessitated the use of a linker at position 14 (Section 2.3). As an alternative to vanadate, we hypothesized a 2´,5´-phosphodiester linkage between position A-1 and G+1 would restrain the non-bridging pro-Rp and pro-Sp oxygens of the scissile bond to adopt a conformation analogous to the known vanadium oxide complex, and hence mimic the transition state (Fig. 6A). A 5´-DMT, 3´-deoxy adenosine, 2´-cyanoethyl-diisopropyl phosphoramidite (Glen Research Corp.) was incorporated by the W.M. Keck Foundation Biotechnology Resource Lab between A-1 and G+1 leading to a 3′-deoxy, 2′,5′-linked 13-mer substrate analog (Fig. 6A). Similarly, 2′-OH-3′-t-butyldimethylsilyl-5′-O-DMT N6-benzoyl adenosine was obtained from Chemgenes Corp. (Wilmington, MA) and activated as described in ref. [117]. The latter 3′-OH, 2′,5′-linked 13-mer (Fig. 6A) was synthesized by Fidelity Systems Inc. (Gaithersburg, MD). Both strands were purified as described in Section 2.1. Activity assays (Section 2.2) indicated that both of these analogs were inert to cleavage. Crystals were grown under standard conditions [65].
Figure 6.
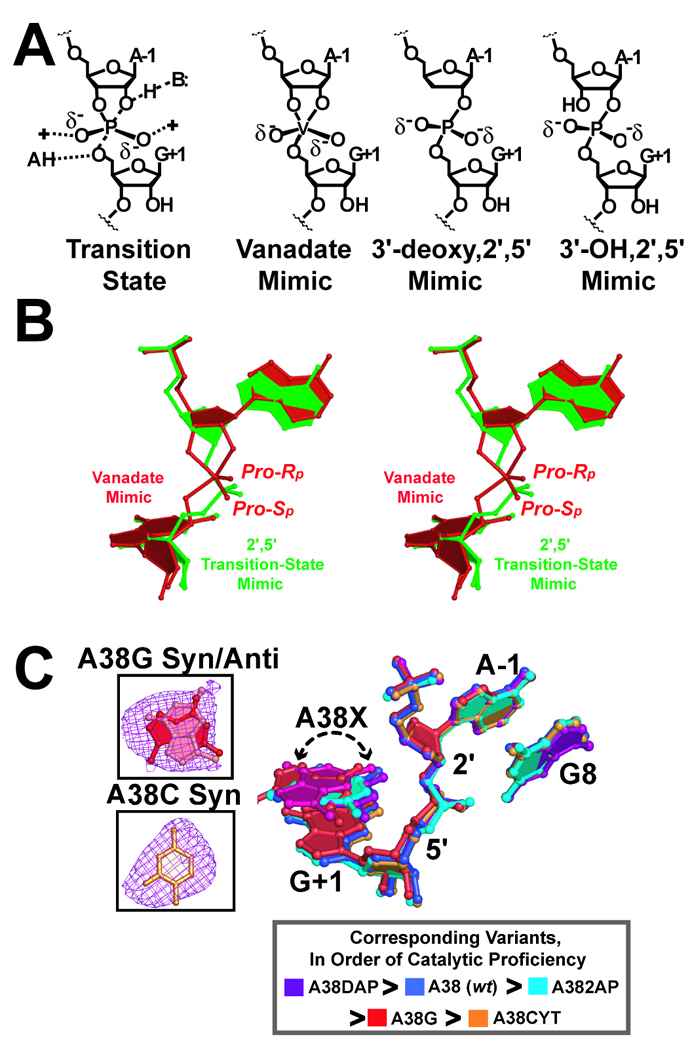
Transition-state analogs and structural ensembles from A38 variants. (A) Schematic diagram of transition-state geometry and structural mimics thereof. (B) Stereoview ball-and-stick superposition of the 2´,5´-linked substrate and the vanadate transition-state mimic. (C) Superposition of position 38 variants determined in the context of the 2´,5´-linked transition-state analog. A dashed arrow indicates structural variations of position 38 variants. Key: colored representations of position 38 variants colored in order of catalytic proficiency in solution [119]. Inset: Representative simulated-annealing-omit electron-density maps for residues A38G and A38C. Maps are contoured at the 3σ level (purple) and have coefficients (mFobs - DFcalc). Syn and anti conformations for A38G are represented as ball-and-stick models (red and pink, respectively).
Both structures of 2´,5´-linked minimal hairpin ribozymes were solved by difference Fourier methods and revealed well-defined electron density at the scissile bond [116, 117]. Whereas the 3´-deoxy, 2´,5´-linked structure diffracted to 2.35 Å resolution, the 3´-OH, 2´,5´-linked structure diffracted to 2.8 Å resolution. To refine the unusual 2´,5´-linkage, default CNS parameter and topology files were “patched” to specify the new dihedral angles, bond distances, geometries and connectivities [118]. As anticipated, the 2´,5´-linkage exhibited similar structural organization to the vanadate complex [116, 117], which supported a role for these linkages as mimics of the transition state (Fig. 6B). The 3´-OH group did not alter the respective 2´,5´-linked structures and appeared to make no significant contacts with the ribozyme. The facility of preparation of the 3´-deoxy, 2´,5´-linkage and its superior diffraction in crystals prompted us to use this analog in subsequent fold-and-function investigations.
Prior functional analysis of the hairpin ribozyme by the Fedor lab suggested a critical role for A38 in the active site. In particular, a series of base variants were substituted at position 38 and revealed losses of cleavage activity ranging from 50- to 13,000-fold [119]. To improve our understanding of the effects of such single-base variants on the reaction coordinate, we determined crystal structures of position 38 variants in the presence of pre-catalytic (i.e. 2´-O-Me A-1) and transition-state (3´-deoxy, 2´,5´-linked) constructs [71]. Position 38 variants were produced as 19-mer strands by Thermo Scientific (Chicago, IL) and purified as described (Section 2.1). Crystals were grown under standard conditions [71]. The variants chosen for investigation spanned a broad range of catalytic activity with the trend: DAP > A > AP > C > G. Here DAP represents a gain-of-function variant whose activity is 3-fold greater than wild type A38 [119].
Crystallographic structures were determined by difference Fourier methods (Section 3) in a resolution range between 2.25 Å to 2.75 Å. Each refined structure exhibited relatively reasonable statistics (Rwork ≤ 23.6% and Rfree ≤ 26.2%) for a structure in this resolution range. Ensembles were constructed using the wild type 2´-O-Me A-1 (Section 4.2), or the 3´-deoxy, 2´,5´-linked A38 structure, PDB entry 2P7F [116], as a reference model. The results of position 38 variants in the context of the pre-catalytic, 2´-O-Me A-1 construct were similar to the position 8 variants (Section 4.2). Specifically, the ‘fitness’ of in-line geometry for phosphoryl transfer was correlated with catalytic proficiency (i.e. poorly reactive variants had unsuitable scissile bond geometries) [71]. In contrast, position 38 variants in the context of the transition-state mimic exhibited scissile bonds that were virtually unchanged by comparison to the wild type (Fig. 6C). Closer inspection revealed structural differences localized to the position 38 bases themselves. The severity of a change was dependent upon the functional groups of the substituted base. For example, the O6 keto group of G38 directly clashed with the pro-Rp oxygen equivalent of the scissile bond; this position of A38 is normally an N6 amine. The unfavorable electrostatic clash necessitated a change of the G38 base from the normal syn rotamer to anti, which was modeled best as a mixture of conformational states (Fig. 6C). When A38 was replaced with a cytidine, the Watson-Crick face of the pyrimidine pointed away from the active site in an anti conformation. Thus, although the C38 exocylic amine was still capable of donating a hydrogen bond to the pro-Rp oxygen equivalent of the scissile bond, the pyrimidine base adopted the preferred anti conformation [73] to avoid internal steric clashes. The results suggested that restraining the active site of the hairpin ribozyme into a transition-state like conformation can provide insight into how key chemical groups, essential for chemistry, can be deprived from the reaction. Here we emphasized the G38 and C38 structures because these exhibited the lowest solution activity [119]. In the 3´-deoxy, 2´,5´ structures, the position of the base imino (N1-equivalent) group is altered severely in these structures indicating the essentiality of this functional group.
A follow-up investigation from our lab revealed that replacement of the A38 N1 moiety with a methine group (CH) retains the global fold, but causes 1.7 to 2.6 Å recoil of the N1-deazaA38 base from the active site in both pre-catalytic and transition-state-like conformations [120]. The activity profile of the N1-deazaA38 variant in solution indicated complete loss of detectable activity for this single-atom change that we ascribed to unfavorable methine interactions with electronegative groups originating from, or surrounding the scissile bond. The results appear consistent with shifting of the A38 imino pKa toward neutrality in the pre-catalytic and transition-states leading to a positive charge at N1 that would support phosphorane formation and/or general acid catalysis in cleavage [120]. Overall, this work provides insight into the range of motion present in the active site, and conveys the degree of structural plasticity accessible to RNA when functional groups fail to complement.
5. Concluding Remarks
The recent surge in the discovery of diverse RNA activities supports the need for investigations poised to relate form to function. Crystallography has the ability to provide high-resolution information about key RNA interactions that can complement biochemical, genetic and cell biological approaches by providing a molecular platform from which to launch experiments. Although crystallography generally provides static information, the methods described herein demonstrate the feasibility of generating three-dimensional structural ensembles capable of locating and quantifying molecular motions. At a minimum, crystallography can reveal the endpoint conformations of dynamic processes whose details can be fleshed out by molecular dynamics or other advanced computational approaches. These results are most relevant when corroborated by other biophysical methods, preferably conducted in solution. We believe that the modest exploration of small ribozyme dynamics provided here is generally applicable to more complex biological machines including any number of ncRNAs essential for life.
Acknowledgments
We are grateful to members of the Wedekind lab who provided the basis for this work including: Celeste MacElrevey, Andrew Torelli, Jason Salter, Geoffrey Lippa, Alena Janda, Moriah Heller, Michael Mungillo and the invaluable hands of Jolanta Krucinska. The superb contributions of Drs. Valerie Grum-Tokars and Shabnam Alam are recognized as well. The technical comments and support of Drs. Clara Kielkopf, Doug Turner and Harold Smith are greatly appreciated. We acknowledge the tireless staff of the Macromolecular Crystallography Group at the Cornell High Energy Synchrotron Source (MacCHESS), especially Richard Gillilan, Bill Miller, Ulrich Englich and Marian Szebenyi. CHESS is supported by the NSF & NIH/NIGMS via NSF award DMR-0225180, and the MacCHESS resource is supported by NIH/NCRR award RR-01646. Portions of this research were conducted at the Stanford Synchrotron Radiation Source (SSRL), a national user facility operated by Stanford University on behalf of the U.S. DOE, Office of Basic Energy Sciences. The SSRL Structural Molecular Biology Program is supported by the DOE, Office of Biological and Environmental Research, and by the NIH/NCRR, Biomedical Technology Program, and the NIGMS. R.C.S was supported by an Elon Huntington Hooker graduate fellowship. Additional funding was provided by grants from the NIH (GM63162) and the donors of the Petroleum Research Fund (45534-AC) to J.E.W.
Footnotes
Publisher's Disclaimer: This is a PDF file of an unedited manuscript that has been accepted for publication. As a service to our customers we are providing this early version of the manuscript. The manuscript will undergo copyediting, typesetting, and review of the resulting proof before it is published in its final citable form. Please note that during the production process errors may be discovered which could affect the content, and all legal disclaimers that apply to the journal pertain.
References
- 1.Amaral PP, Dinger ME, Mercer TR, Mattick JS. Science. 2008;319:1787–1789. doi: 10.1126/science.1155472. [DOI] [PubMed] [Google Scholar]
- 2.Sullivan LH. The Tall Office Building Artistically Considered. Vol. Marchof. 1896 [Google Scholar]
- 3.Burley SK. Nat Struct Biol. 2000;7 Suppl:932–934. doi: 10.1038/80697. [DOI] [PubMed] [Google Scholar]
- 4.Peracchi A, Beigelman L, Usman N, Herschlag D. Proc Natl Acad Sci U S A. 1996;93:11522–11527. doi: 10.1073/pnas.93.21.11522. [DOI] [PMC free article] [PubMed] [Google Scholar]
- 5.Holbrook SR. Annu Rev Biophys. 2008;37:445–464. doi: 10.1146/annurev.biophys.36.040306.132755. [DOI] [PubMed] [Google Scholar]
- 6.Cech TR. Biochem Soc Trans. 2002;30:1162–1166. doi: 10.1042/bst0301162. [DOI] [PubMed] [Google Scholar]
- 7.McKay DB, Wedekind JE. The RNA World. In: Cech T, editor. Cold Spring Harbor: Cold Spring Harbor Laboratory Press; 1999. pp. 265–286. [Google Scholar]
- 8.Butcher SE. Curr Opin Struct Biol. 2001;11:315–320. doi: 10.1016/s0959-440x(00)00207-4. [DOI] [PubMed] [Google Scholar]
- 9.Bevilacqua PC, Yajima R. Curr Opin Chem Biol. 2006;10:455–464. doi: 10.1016/j.cbpa.2006.08.014. [DOI] [PubMed] [Google Scholar]
- 10.Fedor MJ. Biochem Soc Trans. 2002;30:1109–1115. doi: 10.1042/bst0301109. [DOI] [PubMed] [Google Scholar]
- 11.Chowrira BM, Burke JM. Biochemistry. 1991;30:8518–8522. doi: 10.1021/bi00099a003. [DOI] [PubMed] [Google Scholar]
- 12.Hampel A, Tritz R. Biochemistry. 1989;28:4929–4933. doi: 10.1021/bi00438a002. [DOI] [PubMed] [Google Scholar]
- 13.Hampel A, Cowan JA. Chemistry & Biology. 1997;4:513–517. doi: 10.1016/s1074-5521(97)90323-9. [DOI] [PubMed] [Google Scholar]
- 14.Nesbitt S, Hegg LA, Fedor MJ. Chem Biol. 1997;4:619–630. doi: 10.1016/s1074-5521(97)90247-7. [DOI] [PubMed] [Google Scholar]
- 15.Young KJ, Gill F, Grasby JA. Nucleic Acids Res. 1997;25:3760–3766. doi: 10.1093/nar/25.19.3760. [DOI] [PMC free article] [PubMed] [Google Scholar]
- 16.Strobel SA, Cochrane JC. Curr Opin Chem Biol. 2007;11:636–643. doi: 10.1016/j.cbpa.2007.09.010. [DOI] [PMC free article] [PubMed] [Google Scholar]
- 17.Cochrane JC, Strobel SA. Acc Chem Res. 2008;41:1027–1035. doi: 10.1021/ar800050c. [DOI] [PubMed] [Google Scholar]
- 18.Kuzmin YI, Da Costa CP, Fedor MJ. J Mol Biol. 2004;340:233–251. doi: 10.1016/j.jmb.2004.04.067. [DOI] [PubMed] [Google Scholar]
- 19.Cottrell JW, Kuzmin YI, Fedor MJ. J Biol Chem. 2007;282:13498–13507. doi: 10.1074/jbc.M700451200. [DOI] [PubMed] [Google Scholar]
- 20.Rueda D, Bokinsky G, Rhodes MM, Rust MJ, Zhuang X, Walter NG. Proc Natl Acad Sci U S A. 2004;101:10066–10071. doi: 10.1073/pnas.0403575101. [DOI] [PMC free article] [PubMed] [Google Scholar]
- 21.Monzingo AF, Matthews BW. Biochemistry. 1984;23:5724–5729. doi: 10.1021/bi00319a010. [DOI] [PubMed] [Google Scholar]
- 22.Reed GH, Poyner RR, Larsen TM, Wedekind JE, Rayment I. Curr Opin Struct Biol. 1996;6:736–743. doi: 10.1016/s0959-440x(96)80002-9. [DOI] [PubMed] [Google Scholar]
- 23.Wedekind JE, Frey PA, Rayment I. Biochemistry. 1996;35:11560–11569. doi: 10.1021/bi9612677. [DOI] [PubMed] [Google Scholar]
- 24.Davies DR, Hol WG. FEBS Lett. 2004;577:315–321. doi: 10.1016/j.febslet.2004.10.022. [DOI] [PubMed] [Google Scholar]
- 25.Schmeing TM, Huang KS, Strobel SA, Steitz TA. Nature. 2005;438:520–524. doi: 10.1038/nature04152. [DOI] [PubMed] [Google Scholar]
- 26.Doudna JA, Cech TR. Nature. 2002;418:222–228. doi: 10.1038/418222a. [DOI] [PubMed] [Google Scholar]
- 27.Krasovska MV, Sefcikova J, Spackova N, Sponer J, Walter NG. J Mol Biol. 2005;351:731–748. doi: 10.1016/j.jmb.2005.06.016. [DOI] [PubMed] [Google Scholar]
- 28.McDowell SE, Spackova N, Sponer J, Walter NG. Biopolymers. 2006 doi: 10.1002/bip.20620. [DOI] [PMC free article] [PubMed] [Google Scholar]
- 29.Martick M, Lee TS, York DM, Scott WG. Chem Biol. 2008;15:332–342. doi: 10.1016/j.chembiol.2008.03.010. [DOI] [PMC free article] [PubMed] [Google Scholar]
- 30.Lee TS, York DM. J Am Chem Soc. 2008;130:7168–7169. doi: 10.1021/ja711242b. [DOI] [PMC free article] [PubMed] [Google Scholar]
- 31.Ditzler MA, Sponer J, Walter NG. RNA. 2009;15:560–575. doi: 10.1261/rna.1416709. [DOI] [PMC free article] [PubMed] [Google Scholar]
- 32.Nam K, Gao J, York DM. J Am Chem Soc. 2008;130:4680–4691. doi: 10.1021/ja0759141. [DOI] [PMC free article] [PubMed] [Google Scholar]
- 33.Nam K, Gao J, York DM. RNA. 2008;14:1501–1507. doi: 10.1261/rna.863108. [DOI] [PMC free article] [PubMed] [Google Scholar]
- 34.Wedekind JE, McKay DB. Nat Struct Biol. 1999;6:261–268. doi: 10.1038/6700. [DOI] [PubMed] [Google Scholar]
- 35.Wedekind JE, McKay DB. Biochemistry. 2003;42:9554–9563. doi: 10.1021/bi0300783. [DOI] [PubMed] [Google Scholar]
- 36.Grum-Tokars V, Milovanovic M, Wedekind JE. Acta Crystallogr D Biol Crystallogr. 2003;59:142–145. doi: 10.1107/s0907444902019066. [DOI] [PubMed] [Google Scholar]
- 37.MacElrevey C, Wedekind JE. Acta Cryst. 2005;F61:1049–1053. doi: 10.1107/S1744309105035888. [DOI] [PMC free article] [PubMed] [Google Scholar]
- 38.Spitale RC, Torelli AT, Krucinska J, Bandarian V, Wedekind JE. J Biol Chem. 2009;284:11012–11016. doi: 10.1074/jbc.C900024200. [DOI] [PMC free article] [PubMed] [Google Scholar]
- 39.Kolatkar AR, Clarage JB, Phillips GN., Jr Acta Crystallogr D Biol Crystallogr. 1994;50:210–218. doi: 10.1107/S0907444993011692. [DOI] [PubMed] [Google Scholar]
- 40.Ke A, Doudna JA. Methods. 2004;34:408–414. doi: 10.1016/j.ymeth.2004.03.027. [DOI] [PubMed] [Google Scholar]
- 41.Ferre-D’Amare AR, Doudna JA. J Mol Biol. 2000;295:541–556. doi: 10.1006/jmbi.1999.3398. [DOI] [PubMed] [Google Scholar]
- 42.Rupert PB, Ferre-D’Amare AR. Methods Mol. Biol. 2004;252:303–311. doi: 10.1385/1-59259-746-7:303. [DOI] [PubMed] [Google Scholar]
- 43.Milligan JF, Uhlenbeck OC. Methods Enzymol. 1989;180:51–62. doi: 10.1016/0076-6879(89)80091-6. [DOI] [PubMed] [Google Scholar]
- 44.Milligan JF, Groebe DR, Witherell GW, Uhlenbeck OC. Nucleic Acids Res. 1987;15:8783–8798. doi: 10.1093/nar/15.21.8783. [DOI] [PMC free article] [PubMed] [Google Scholar]
- 45.Pleiss JA, Derrick ML, Uhlenbeck OC. RNA. 1998;4:1313–1317. doi: 10.1017/s135583829800106x. [DOI] [PMC free article] [PubMed] [Google Scholar]
- 46.Sherlin LD, Bullock TL, Nissan TA, Perona JJ, Lariviere FJ, Uhlenbeck OC, Scaringe SA. RNA. 2001;7:1671–1678. [PMC free article] [PubMed] [Google Scholar]
- 47.Batey RT, Kieft JS. RNA. 2007;13:1384–1389. doi: 10.1261/rna.528007. [DOI] [PMC free article] [PubMed] [Google Scholar]
- 48.Kieft JS, Batey RT. RNA. 2004;10:988–995. doi: 10.1261/rna.7040604. [DOI] [PMC free article] [PubMed] [Google Scholar]
- 49.Wincott F, DiRenzo A, Shaffer C, Grimm S, Tracz D, Workman C, Sweedler D, Gonzalez C, Scaringe S, Usman N. Nucleic Acids Res. 1995;23:2677–2684. doi: 10.1093/nar/23.14.2677. [DOI] [PMC free article] [PubMed] [Google Scholar]
- 50.Zon G, Thompson JA. BioChromatog. 1986;1:22–32. [Google Scholar]
- 51.Esteban JA, Banerjee AR, Burke JM. J Biol Chem. 1997;272:13629–13639. doi: 10.1074/jbc.272.21.13629. [DOI] [PubMed] [Google Scholar]
- 52.Hohng S, Wilson TJ, Tan E, Clegg RM, Lilley DM, Ha T. J Mol Biol. 2004;336:69–79. doi: 10.1016/j.jmb.2003.12.014. [DOI] [PubMed] [Google Scholar]
- 53.Walter NG, Burke JM, Millar DP. Nat Struct Biol. 1999;6:544–549. doi: 10.1038/9316. [DOI] [PubMed] [Google Scholar]
- 54.Fedor MJ. Biochemistry. 1999;38:11040–11050. doi: 10.1021/bi991069q. [DOI] [PubMed] [Google Scholar]
- 55.Murchie AI, Thomson JB, Walter F, Lilley DM. Mol Cell. 1998;1:873–881. doi: 10.1016/s1097-2765(00)80086-6. [DOI] [PubMed] [Google Scholar]
- 56.Walter F, Murchie AI, Lilley DM. Biochemistry. 1998;37:17629–17636. doi: 10.1021/bi9821115. [DOI] [PubMed] [Google Scholar]
- 57.Walter F, Murchie AI, Thomson JB, Lilley DM. Biochemistry. 1998;37:14195–14203. doi: 10.1021/bi981513+. [DOI] [PubMed] [Google Scholar]
- 58.Zhuang X, Kim H, Pereira MJ, Babcock HP, Walter NG, Chu S. Science. 2002;296:1473–1476. doi: 10.1126/science.1069013. [DOI] [PubMed] [Google Scholar]
- 59.Bokinsky G, Rueda D, Misra VK, Rhodes MM, Gordus A, Babcock HP, Walter NG, Zhuang X. Proc Natl Acad Sci U S A. 2003;100:9302–9307. doi: 10.1073/pnas.1133280100. [DOI] [PMC free article] [PubMed] [Google Scholar]
- 60.Nahas MK, Wilson TJ, Hohng S, Jarvie K, Lilley DM, Ha T. Nat Struct Mol Biol. 2004;11:1107–1113. doi: 10.1038/nsmb842. [DOI] [PubMed] [Google Scholar]
- 61.Rupert PB, Ferre-D’Amare AR. Nature. 2001;410:780–786. doi: 10.1038/35071009. [DOI] [PubMed] [Google Scholar]
- 62.Rupert PB, Massey AP, Sigurdsson ST, Ferre-D’Amare AR. Science. 2002;298:1421–1424. doi: 10.1126/science.1076093. [DOI] [PubMed] [Google Scholar]
- 63.Fedor MJ. J. Mol. Biol. 2000;297:269–291. doi: 10.1006/jmbi.2000.3560. [DOI] [PubMed] [Google Scholar]
- 64.Butcher SE, Heckman JE, Burke JM. J Biol Chem. 1995;270:29648–52651. doi: 10.1074/jbc.270.50.29648. [DOI] [PubMed] [Google Scholar]
- 65.Alam S, Grum-Tokars V, Krucinska J, Kundracik ML, Wedekind JE. Biochemistry. 2005;44:14396–14408. doi: 10.1021/bi051550i. [DOI] [PubMed] [Google Scholar]
- 66.Salter J, Krucinska J, Alam S, Grum-Tokars V, Wedekind JE. Biochemistry. 2006;45:686–700. doi: 10.1021/bi051887k. [DOI] [PMC free article] [PubMed] [Google Scholar]
- 67.Esteban JA, Walter NG, Kotzorek G, Heckman JE, Burke JM. Proc Natl Acad Sci U S A. 1998;95:6091–6096. doi: 10.1073/pnas.95.11.6091. [DOI] [PMC free article] [PubMed] [Google Scholar]
- 68.MacElrevey C, Spitale RC, Krucinska J, Wedekind JE. Acta Crystallogr D Biol Crystallogr. 2007;63:812–825. doi: 10.1107/S090744490702464X. [DOI] [PMC free article] [PubMed] [Google Scholar]
- 69.Collaborative Computational Project, N. Acta Crystallogr. 1994;D50:760–763. [Google Scholar]
- 70.Blundell T, Johnson L. Protein Crystallography. San Diego, CA USA: Academic Press INC; 1976. [Google Scholar]
- 71.MacElrevey C, Salter JD, Krucinska J, Wedekind JE. RNA. 2008;14:1600–1616. doi: 10.1261/rna.1055308. [DOI] [PMC free article] [PubMed] [Google Scholar]
- 72.Wedekind JE, McKay DB. Methods Enzymol. 2000;317:149–168. doi: 10.1016/s0076-6879(00)17013-2. [DOI] [PubMed] [Google Scholar]
- 73.Saenger W. New York: Springer-Verlag; 1984. Principles of Nucleic Acid Structure. [Google Scholar]
- 74.Sugimoto N, Kierzek R, Turner DH. Biochemistry. 1987;26:4554–4558. doi: 10.1021/bi00388a058. [DOI] [PubMed] [Google Scholar]
- 75.Walter AE, Turner DH, Kim J, Lyttle MH, Muller P, Mathews DH, Zuker M. Proc Natl Acad Sci U S A. 1994;91:9218–9222. doi: 10.1073/pnas.91.20.9218. [DOI] [PMC free article] [PubMed] [Google Scholar]
- 76.Walter AE, Wu M, Turner DH. Biochemistry. 1994;33:11349–11354. doi: 10.1021/bi00203a033. [DOI] [PubMed] [Google Scholar]
- 77.Kierzek R, Burkard ME, Turner DH. Biochemistry. 1999;38:14214–14223. doi: 10.1021/bi991186l. [DOI] [PubMed] [Google Scholar]
- 78.Lu ZJ, Turner DH, Mathews DH. Nucleic Acids Res. 2006;34:4912–4924. doi: 10.1093/nar/gkl472. [DOI] [PMC free article] [PubMed] [Google Scholar]
- 79.Nagaswamy U, Larios-Sanz M, Hury J, Collins S, Zhang Z, Zhao Q, Fox GE. Nucleic Acids Res. 2002;30:395–397. doi: 10.1093/nar/30.1.395. [DOI] [PMC free article] [PubMed] [Google Scholar]
- 80.Selmer M, Dunham CM, Murphy FVt, Weixlbaumer A, Petry S, Kelley AC, Weir JR, Ramakrishnan V. Science. 2006;313:1935–1942. doi: 10.1126/science.1131127. [DOI] [PubMed] [Google Scholar]
- 81.Golden BL, Kundrot CE. J Struct Biol. 2003;142:98–107. doi: 10.1016/s1047-8477(03)00042-x. [DOI] [PubMed] [Google Scholar]
- 82.Golden BL. Methods Mol Biol. 2007;363:239–257. doi: 10.1007/978-1-59745-209-0_12. [DOI] [PubMed] [Google Scholar]
- 83.Kantardjieff KA, Rupp B. Protein Sci. 2003;12:1865–1871. doi: 10.1110/ps.0350503. [DOI] [PMC free article] [PubMed] [Google Scholar]
- 84.Correll CC, Wool IG, Munishkin A. J Mol Biol. 1999;292:275–287. doi: 10.1006/jmbi.1999.3072. [DOI] [PubMed] [Google Scholar]
- 85.Cate JH, Doudna JA. Methods Enzymol. 2000;317:169–180. doi: 10.1016/s0076-6879(00)17014-4. [DOI] [PubMed] [Google Scholar]
- 86.Keel AY, Rambo RP, Batey RT, Kieft JS. Structure. 2007;15:761–772. doi: 10.1016/j.str.2007.06.003. [DOI] [PMC free article] [PubMed] [Google Scholar]
- 87.Robertson MP, Scott WG. Acta Crystallogr D Biol Crystallogr. 2008;D64:738–744. doi: 10.1107/S0907444908011578. [DOI] [PMC free article] [PubMed] [Google Scholar]
- 88.Golden BL. Methods Enzymol. 2000;317:124–132. doi: 10.1016/s0076-6879(00)17010-7. [DOI] [PubMed] [Google Scholar]
- 89.Golden BL, Gooding AR, Podell ER, Cech TR. RNA. 1996;2:1295–1305. [PMC free article] [PubMed] [Google Scholar]
- 90.Adams PD, Gopal K, Grosse-Kunstleve RW, Hung LW, Ioerger TR, McCoy AJ, Moriarty NW, Pai RK, Read RJ, Romo TD, Sacchettin JC, Sauter NK, Storoni LC, Terwilliger TC. J. Sync. Rad. 2004;11:53–55. doi: 10.1107/s0909049503024130. [DOI] [PubMed] [Google Scholar]
- 91.Murshudov GN, Vagin AA, Lebedev A, Wilson KS, Dodson EJ. Acta Crystallogr D Biol Crystallogr. 1999;55:247–255. doi: 10.1107/S090744499801405X. [DOI] [PubMed] [Google Scholar]
- 92.Brünger AT, Adams PD, Clore GM, DeLano WL, Gros P, Grosse-Kunstleve RW, Jiang JS, Kuszewski J, Nilges M, Pannu NS, Read RJ, Rice LM, Simonson T, Warren GL. Acta Crystallogr. 1998;D54:905–921. doi: 10.1107/s0907444998003254. [DOI] [PubMed] [Google Scholar]
- 93.Brunger AT. Nat Protoc. 2007;2:2728–2733. doi: 10.1038/nprot.2007.406. [DOI] [PubMed] [Google Scholar]
- 94.Brunger AT. Nature. 1992;355:472–475. doi: 10.1038/355472a0. [DOI] [PubMed] [Google Scholar]
- 95.Adams PD, Pannu NS, Read RJ, Brunger AT. Proc Natl Acad Sci U S A. 1997;94:5018–5023. doi: 10.1073/pnas.94.10.5018. [DOI] [PMC free article] [PubMed] [Google Scholar]
- 96.Brunger AT. Methods Enzymol. 1997;277:366–396. doi: 10.1016/s0076-6879(97)77021-6. [DOI] [PubMed] [Google Scholar]
- 97.Pannu NS, Read RJ. Acta Crystallogr. A. 1996;52:659–668. [Google Scholar]
- 98.Otwinowski Z, Borek D, Majewski W, Minor W. Acta Crystallogr A. 2003;59:228–234. doi: 10.1107/s0108767303005488. [DOI] [PubMed] [Google Scholar]
- 99.Otwinowski Z, Minor W. Methods in Enzymology. 1997;276:307–326. doi: 10.1016/S0076-6879(97)76066-X. [DOI] [PubMed] [Google Scholar]
- 100.Pflugrath JW. Acta Crystallogr D Biol Crystallogr. 1999;55:1718–1725. doi: 10.1107/s090744499900935x. [DOI] [PubMed] [Google Scholar]
- 101.Kleywegt GJ, Brunger AT. Structure. 1996;4:897–904. doi: 10.1016/s0969-2126(96)00097-4. [DOI] [PubMed] [Google Scholar]
- 102.Jiang JS, Brunger AT. J Mol Biol. 1994;243:100–115. doi: 10.1006/jmbi.1994.1633. [DOI] [PubMed] [Google Scholar]
- 103.Read RJ. Acta Crystallogr. Sect. 1986;A42:140–149. [Google Scholar]
- 104.Jones TA, Zou JY, Cowan SW, Kjeldgaard M. Acta Crystallogr. 1991;A47(Pt 2):110–119. doi: 10.1107/s0108767390010224. [DOI] [PubMed] [Google Scholar]
- 105.Emsley P, Cowtan K. Acta Crystallogr D Biol Crystallogr. 2004;60:2126–2132. doi: 10.1107/S0907444904019158. [DOI] [PubMed] [Google Scholar]
- 106.Branden CI, Jones TA. Nature. 1990;343:687. [Google Scholar]
- 107.Davis IW, Leaver-Fay A, Chen VB, Block JN, Kapral GJ, Wang X, Murray LW, Arendall WB, 3rd, Snoeyink J, Richardson JS, Richardson DC. Nucleic Acids Res. 2007;35:W375–W383. doi: 10.1093/nar/gkm216. [DOI] [PMC free article] [PubMed] [Google Scholar]
- 108.Berzal-Herranz A, Joseph S, Burke JM. Genes Dev. 1992;6:129–134. doi: 10.1101/gad.6.1.129. [DOI] [PubMed] [Google Scholar]
- 109.Berzal-Herranz A, Joseph S, Chowrira BM, Butcher SE, Burke JM. Embo J. 1993;12:2567–2573. doi: 10.1002/j.1460-2075.1993.tb05912.x. [DOI] [PMC free article] [PubMed] [Google Scholar]
- 110.Joseph S, Burke JM. J. Biol. Chem. 1993;268:24515–24518. [PubMed] [Google Scholar]
- 111.Adams PD, Pannu NS, Read RJ, Brunger AT. Acta Crystallogr D Biol Crystallogr. 1999;55(Pt 1):181–190. doi: 10.1107/S0907444998006635. [DOI] [PubMed] [Google Scholar]
- 112.Kabsch W. Acta Crystallographica Section A. 1978;34:827–828. [Google Scholar]
- 113.Kleywegt GJ, Jones TA. Methods Enzymol. 1997;277:525–545. doi: 10.1016/s0076-6879(97)77029-0. [DOI] [PubMed] [Google Scholar]
- 114.Soukup GA, Breaker RR. RNA. 1999;5:1308–1325. doi: 10.1017/s1355838299990891. [DOI] [PMC free article] [PubMed] [Google Scholar]
- 115.Pinard R, Hampel KJ, Heckman JE, Lambert D, Chan PA, Major F, Burke JM. Embo J. 2001;20:6434–6442. doi: 10.1093/emboj/20.22.6434. [DOI] [PMC free article] [PubMed] [Google Scholar]
- 116.Torelli AT, Krucinska J, Wedekind JE. RNA. 2007;13:1052–1070. doi: 10.1261/rna.510807. [DOI] [PMC free article] [PubMed] [Google Scholar]
- 117.Torelli AT, Spitale RC, Krucinska J, Wedekind JE. Biochem Biophys Res Commun. 2008;371:154–158. doi: 10.1016/j.bbrc.2008.04.036. [DOI] [PMC free article] [PubMed] [Google Scholar]
- 118.Torelli AT. Structural Studies of Transition-State Stabilization by a Small Catalytic RNA, Metabolite Binding by a Regulatory RNA Sequence and the Mechanism of Action of Activation Induced Deaminase, Doctoral Dissertation in Biophysics. Rochester, New York: University of Rochester School of Medicine & Dentistry; 2008. p. 262. [Google Scholar]
- 119.Kuzmin YI, Da Costa CP, Cottrell JW, Fedor MJ. J Mol Biol. 2005;349:989–1010. doi: 10.1016/j.jmb.2005.04.005. [DOI] [PubMed] [Google Scholar]
- 120.Spitale RC, Volpini R, Heller MG, Krucinska J, Cristalli G, Wedekind JE. J Am Chem Soc. 2009;131:6093–6095. doi: 10.1021/ja900450h. [DOI] [PMC free article] [PubMed] [Google Scholar]
- 121.Zhao ZY, Wilson TJ, Maxwell K, Lilley DM. RNA. 2000;6:1833–1846. doi: 10.1017/s1355838200001230. [DOI] [PMC free article] [PubMed] [Google Scholar]