

Abstract
Understanding the signalling function of Ras GTPases has been the focus of much research for over 20 years. Both the catalytic domain and the membrane anchoring C terminal hypervariable region (HVR) of Ras are necessary for its cellular function. However, while the highly conserved catalytic domain has been characterized in atomic detail, the structure of the full-length membrane-bound Ras has remained elusive. Lack of structural knowledge on the full-length protein limited our understanding of Ras signalling. For example, structures of the Ras catalytic domain solved in complex with effectors do not provide a basis for the functional specificity of different Ras isoforms. Recent molecular dynamics simulations in combination with biophysical and cell biological experiments have shown that the HVR and parts of the G domain cofunction with the lipid tails to anchor H-ras to the plasma membrane. In the GTP-bound state, H-ras adopts an orientation that allows read out by Ras effectors and translation into corresponding MAPK signalling. Here we discuss details of an analysis that suggests a novel balance model for Ras functioning. The balance model rationalizes Ras membrane orientation and may help explain isoform specific interactions of Ras with its effectors and modulators.
Keywords: FRET, microdomain, nanocluster, plasma membrane, Ras, structure
Introduction
The small G protein Ras cycles between a GTP-bound on-state and a GDP-bound off-state. Activation by exchange of GDP for GTP is catalysed by guanine nucleotide exchange factors (GEFs), while deactivation by hydrolysis of GTP to GDP is accelerated by GTPase activating proteins (GAPs). Attachment of Ras to cellular membranes is indispensable for its biological function.18 In a sequence of enzymatic steps the C-terminal hypervariable region (HVR) is lipid modified and processed, leading to the anchorage of the G domain to the inner leaflet of the membrane.19 Oncogenic mutations lock Ras in the GTP-bound on-state, in part because they prevent formation of a functional transition state between the catalytic GAP residues and Ras.20 The resulting permanent stimulation of the MAPK-pathway is an essential driver of tumour formation.21 In the on-state, Ras proteins activate a range of effectors rather promiscuously, yet with signalling strengths that vary in an isoform specific manner.22-24
The structures of the conserved G domain of Ras in complex with effector domains have been studied in great detail.25 However, these structures do not provide a mechanistic explanation for the isoform specificity of effector activation.26 This has led to the notion that the highly divergent C-terminal HVR drives isoform specificity. Therefore, more recent efforts in structural biology have focused on determining the structure of lipid modified peptides derived from the Ras HVR (reviewed in ref. 11). An attractive cell biological concept that connects the HVR with isoform specificity is that different HVRs direct the isoforms into different nanoclusters on the plasma membrane.27 Nanoclustering of Ras is critical for signal transmission, as it allows the cell to respond to low signal input with a fixed output. This analogue-digital circuit allows high fidelity signal transmission across the plasma membrane.28
Biochemical and electron microscopy data have provided ample evidence that H-, N-and K-ras4B are laterally segregated in the plasma membrane into distinct nanodomains (Excursus 2).29-31 FRET data have confirmed that the HVR is sufficient to drive nanoclustering, and that it is the primary determinant for the isoform specific lateral segregation.4,5 GTP-and GDP-bound H-ras appear to be differently organized in the plasma membrane.32 This suggests that both the lipid modified HVR and the G domain play a role in lateral segregation.30 Exactly how the interplay of HVR and G domain works has been a subject of recent studies.5,33 Here we discuss how combining computational simulations with a novel FRET approach has shed more light onto the structure function relationship of Ras signalling.
Excursus 1—FRET on a 2D Membrane and in Nanoclusters
Förster or Fluorescence Resonance Energy Transfer (FRET) depends on certain conditions:
The emission spectrum of the donor fluorophore has to overlap with the excitation spectrum of the acceptor fluorophore.
The relative orientation of the transition dipole moments of donor and acceptor must not be orthogonal.
The efficiency of this dipole-dipole interaction depends on the sixth power of the distance. Therefore, FRET occurs only if a donor and an acceptor are ‘molecularly’ close (≤10 nm).
On a 2D surface, such as a biological membrane, the average distance between donor and acceptor depends on their exact distribution. Randomly distributed donors and acceptors can lead to appreciable FRET levels, if the acceptor concentration is sufficiently high.1,2 In several experimental systems the increase in FRET is higher than expected from randomly distributed donors and acceptors.3-5 One plausible reason, which is consistent with ultrastructural data, is nanoscale clustering of donors and acceptors.4,6 Even if only a minor fraction of proteins is present in dynamic nanoclusters, FRET can be observed.3,4
FRET from nanoclusters modelled as discs depends on the number and ratio of donors and acceptors in the nanodomain, as well as their absolute dimensions.7 However, such simple models cannot fully describe experimental observations, especially if distance changes normal to the membrane plane have to be considered, in addition to distance changes within the plane of the membrane.5
Excursus 2—Clues to Mechanisms of Nanoclustering from a FRET Vector Approach
Rafts, lipid shells, and nanoclusters have been proposed to explain functional membrane heterogeneities.8-10 The general consensus of these models is that proteins strongly associate with a physico-bio-chemically distinct proteo-lipid ensemble, termed here a nanodomain. Two proteins in different nanodomains of a membrane are therefore laterally segregated.
The lateral segregation FRET vector offers a new way to qualify and quantify the lateral segregation of two proteins. Its concept is borrowed from a Cartesian coordinate system. Nanodomain markers are used analogously to landmarks or the coordinate axes, and define a nanodomain marker space. However, the nanodomain marker axes differ from the Cartesian coordinate axes, as they may not be completely independent. In addition to nanodomain markers that are laterally segregated, the inclusion of markers of different lengths allow analysis of distance changes normal to the membrane plane.5 Thus two proteins can be considered laterally segregated in a given nanodomain marker space, if they have different FRET vectors5,11 (Fig. 1).
Figure 1.
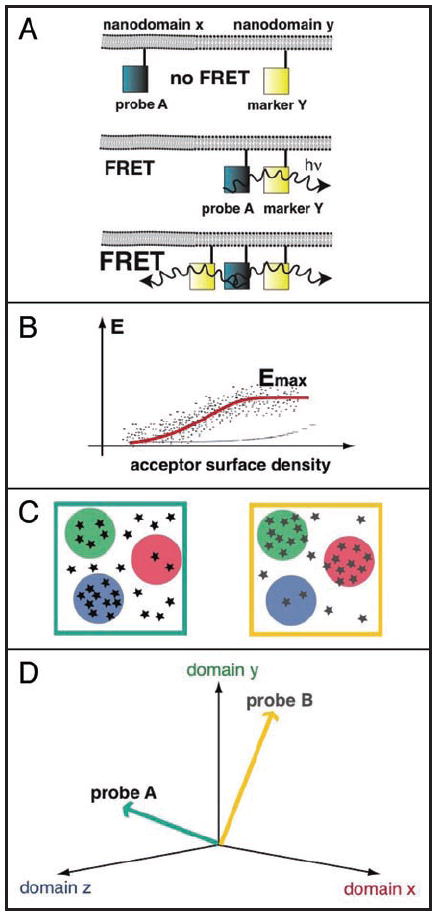
The FRET vector approach. (A, top) If a donor labelled probe A is in a different nanodomain from an acceptor labelled nanodomain marker Y, no FRET is observed. If donor and acceptor are randomly distributed, FRET levels remain below 10% (thin blue line in B), even with overexpression at high levels (ca. 2000 eGFP-like acceptors/μm2). (A, middle and bottom) If donor and acceptor are in the same nanodomain FRET is observed, but the FRET level also depends on the density of the acceptor in the nanodomain. Higher acceptor surface density and higher acceptor mole fractions lead to more FRET. (B) The scheme shows the typical dependence of FRET of fluorescently labelled nanoclustered proteins on the acceptor surface density at constant acceptor mole fraction (dots). The maximal FRET value, Emax is determined by curve fitting (red line).4,5 (C) Schematic distribution of probes (stars) over three types of different nanodomains (red, green and blue). Two different distributions for a probe A (left) and a probe B (right) are shown. If these distributions were sequentially interrogated by FRET experiments, as shown in (A and B), the FRET vectors in (D) would be obtained, as probes and nanodomain markers form mixed nanoclusters. (D) Representation of the lateral segregation FRET vectors of probes (A and B) in a nanodomain marker space, as they would follow from their schematical distribution in (C).
Various levels of FRET can be expected when a fluorescently labelled probe and a FRET-complementarily labelled nanodomain marker form a mixed nanocluster. Because neither the spatio-temporal properties nor the mechanisms of formation of nanoclusters are completely understood, it is difficult to analytically derive or predict the FRET by modelling (Excursus 1). However, experimentally derived maximal FRET-efficiencies at high acceptor concentrations, Emax, are characteristic for different H-ras mutant/nanodomain marker FRET pairs5 (Fig. 1). As the Emax values are determined at high acceptor concentrations, it can be assumed that the nanoclusters are largely composed of the H-ras probe and the nanodomain marker. The characteristic Emax can therefore be explained by considering that nanoclusters may on the spatial and temporal average have a characteristic structure of proteins and lipids with specific stoichiometry,12,13 average orientations, and distances of donors and acceptors.
It is possible to obtain some insight into the mechanisms of nanoclustering from experimental data. For example, the magnitude of Emax depends on specific basic residues that mediate contact of H-ras or the nanodomain marker with membrane lipids.5 So how could these specific basic residues modulate formation of nanoclusters? In membranes containing acidic lipids, the polybasic peptide from MARCKS induces an electrostatic sink that attracts polyvalent phosphoinositides.14,15 Similar but weaker activities may be associated with smaller arrays of basic residues near a membrane. The altered lipid composition, in turn, may impact on protein recruitment,16 thus leading to formation of protein nanoclusters. This interplay of proteins and lipids could be propagated or even amplified in nanoclusters. Thus subtle differences in the array of basic residues may translate into characteristic nanoclusters of H-ras mutants and nanodomain markers.
An additional mechanism, which may lead to specific nanoclustering of different H-ras mutant/marker pairs, are their different sterical requirements for packing that may translate into differences in curvature induction.11,17 Similarly, a FRET-pair specific change in the relative conformational flexibility may allow for a more favourable orientation of the fluorophores, facilitating FRET to various degrees.
The Balance Model: Reorientation probability of GTP-Ras determines effector interaction
Molecular dynamics (MD) simulations of the insertion process of GTP-or GDP-bound full length lipid modified H-ras into a model membrane recently provided a novel perspective on how the HVR and the G domain function together.33 The most populated conformational ensemble of GTP-H-ras shows interactions of basic residues R128 and R135 on helix α4 with membrane lipids. On the other hand, GDP-H-ras is stabilized by basic residues R169 and K170 of the HVR (Fig. 2A). As these regions, α4 and the HVR, stabilize the reoriented H-ras after nucleotide switching, they have been named the ‘switched elements’.5
Figure 2.
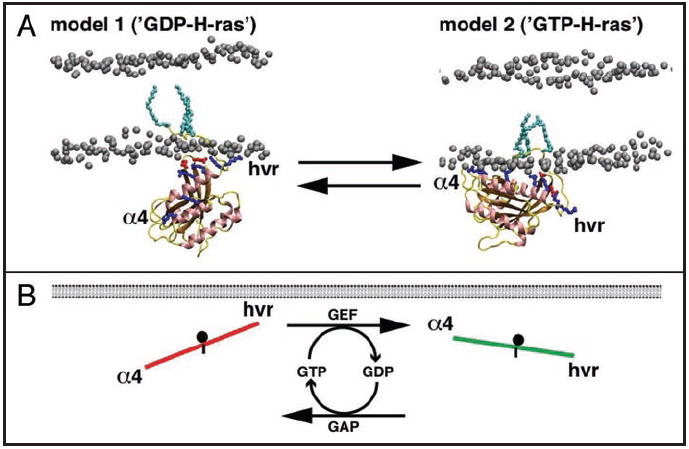
Nucleotide dependent reorientation of H-ras. (A) The figure shows the two structural models of H-ras bound to a simple membrane. Model 1 is the conformation preferred by GDP-bound H-ras, while model 2 is preferred by GTP-bound H-ras. The models imply that H-ras exists in a dynamic equilibrium between these two conformations and that the equilibrium can be shifted by the bound nucleotide. The switched elements (α4 and HVR) stabilize the orientations by contacts of specific basic residues (blue sidechains) with the membrane lipids. In model 1, stabilization by the HVR predominates, while in model 2 helix α4 takes over, thus reorienting the whole G domain with respect to the membrane plane. The network of acidic (red sidechains) and basic residues that comprise the novel switch III can be recognized near the membrane (the phosphorus head groups of lipids are shown in grey). (B) The nucleotide dependent orientation of membrane bound H-ras was translated into a simple model, the balance model, which may apply to many Ras isoforms.5 The sides of the balance represent the switched elements, α4 and the HVR, and the fulcrum (black dot) the switch III. The steepness is a measure of the probability that Ras will interact with its effector. In GDP-H-ras contacts of the HVR prevail, so the HVR side of the balance is ‘up’. On the other hand, helix α4 is ‘up’ in the on-state.
Alanine mutation of the basic residues on the switched elements perturbs a complex FRET-readout parameter, the FRET vector (Excursus 2), in a way that correlates with the structural predictions of the MD simulations. These important results strongly suggest that the two different orientations of H-ras exist also in living cells.
A novel switch III region, which comprises the β2-β3-loop and helix α5, was identified with the same FRET vector approach.5 The GTP-binding induced structural rearrangements in switch III lead to a different engagement of helix α4. The two basic residues on helix α4 then contact membrane lipids, thus reorienting the whole G domain, while at the same time contacts of the basic residues in the HVR are lost. GTP-binding therefore leads to a number of conformational changes in the G domain.
Importantly, two of the residues of switch III, R161 and D47, are highly conserved among 13 Ras subfamily isoforms, while R164 is moderately conserved (9 out of 13 isoforms).5 These data suggest that parts of switch III may operate in these other Ras isoforms. However, there may also be differences in the way different G domains operate.34
The extent of reorientation of H-ras is of fundamental biological importance. The probability that H-ras interacts with the Ras binding domain of its effector C-Raf depends on the orientation of GTP-H-ras with respect to the membrane plane.5 This probability is directly translated into a corresponding ppERK output5 and subsequent transcriptional changes that lead to PC12 cell differentiation.33 To visualize this probability, consider a simple balance model, where the steepness of the balance represents the probability of a H-ras—effector interaction, that can be adjusted by the interplay of helix α4, the HVR and switch III5 (Fig. 2B).
Perspectives
The balance model—postulates for Ras interacting proteins
Currently, we can only speculate about what structural correlates of the balance model account for the increased probability of GTP H-ras—effector interaction. It is conceivable that G domain reorientation exposes the effector interacting regions (mainly switch I and β2, and part of switch II for some effectors) more favourably towards the cytoplasm, whence the effectors are recruited (Fig. 3). In this regard it will be interesting to test whether other RBD-and RA-domain containing effectors, or even other GTP-H-ras interacting proteins such as the scaffolding and chaperone protein Galectin-1,35 also recognize the GTP-driven reorientation of H-ras.
Figure 3.
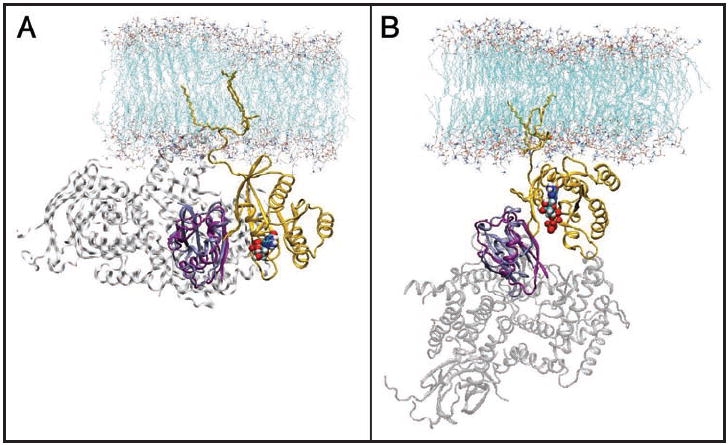
Docking of C-Raf-RBD and PI3Kγ crystal structures onto MD models of H-ras. The Ras catalytic domains co-crystallized with C-Raf (pdb code 1GUA) and PI3Kγ (pdb code 1HE8) were aligned onto the catalytic domain structure from the full-length membrane-bound Ras (orange): (A), model 1 and (B), model 2. The Ras chains of 1GUA and 1HE8 are not shown for clarity. The RBD of C-Raf is in ice blue and that of PI3Kγ in purple. The rest of PI3Kγ structure is shown in grey transparent cartoon. The nucleotide is shown in a space filling model. During the structural alignment, parts of the flexible effector loop (residues 31 to 37 in (A) and 35 to 38 in (B)) clashed with the RBDs (not shown). Binding of the effector would structure most of these residues to become part of an elongated β2, creating a β-sheet that encompasses Ras and the RBD. Note, the sterically more favourable orientation of the complex in (B).
Does the balance model also explain interactions of inactive H-ras? It is plausible that the GDP-H-ras conformation may be recognized by proteins or protein modules that interact specifically with the inactive state, such as GEF domains. If so, such interactions may be enhanced by mutations that block the membrane contact of helix α4 and decreased by mutations that block the membrane contacts of the HVR (Fig. 4).
Figure 4.
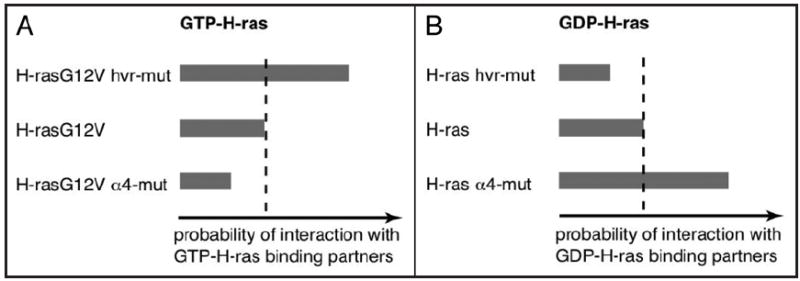
Interaction profiles of H-ras mutants. (A) Mutating specific basic residues in the HVR of H-rasG12V (GTP-H-ras) increases its interaction with the C-Raf-RBD (top). By contrast, mutating specific basic residues on helix α4 decreases the interaction of H-rasG12V with the C-Raf-RBD. These relations may be generalized for all GTP-H-ras interacting proteins (e.g., effectors, scaffolds etc.,). (B) Similarly, it can be expected that GDP-H-ras recognizing protein domains, such as the Cdc25/GEF-domain, interact conversely with the corresponding mutants, i.e., stronger interaction with the helix α4 mutant (α4-mut) and weaker with the hvr-mutant (hvr-mut).
The balance model—postulates for other Ras isoforms
Does the balance model also explain the functioning of other Ras isoforms? This is quite possible. On the one hand, switch III appears to be present in several isoforms, even if it may function slightly differently.34 On the other hand, Ras isoforms have different combinations of switched elements.5 In the context of the balance model, the exact biochemical nature of the switched elements effectively determine the ‘weights’ on each side of the balance. In the case of the HVR this weight will depend on the lipid modifications and precise amino acid composition. A mono palmitoylated mutant of Ras may reorient more easily, than a dually palmitoylated isoform. Similarly, the ‘weight’ of helix α4 may be modulated by the number of basic and hydrophobic residues, or more generally the amphipathicity (Fig. 5). Replacement of helix α4 of H-ras with the membrane anchoring polybasic sequence from the MARCKS protein, reorients the G domain more completely than the native sequence.5 This example illustrates how the relative ‘weights’ of HVRs and α4 helices derived from various Ras isoforms could impact on the ‘steepness of the balance’ (Fig. 5). In addition, variations in switch III may affect the ‘threshold’ at which the balance flips over. Thus, the same switched element may appear ‘heavier’ or ‘lighter’ depending on which isoform the G domain is taken from (Fig. 5).
Figure 5.
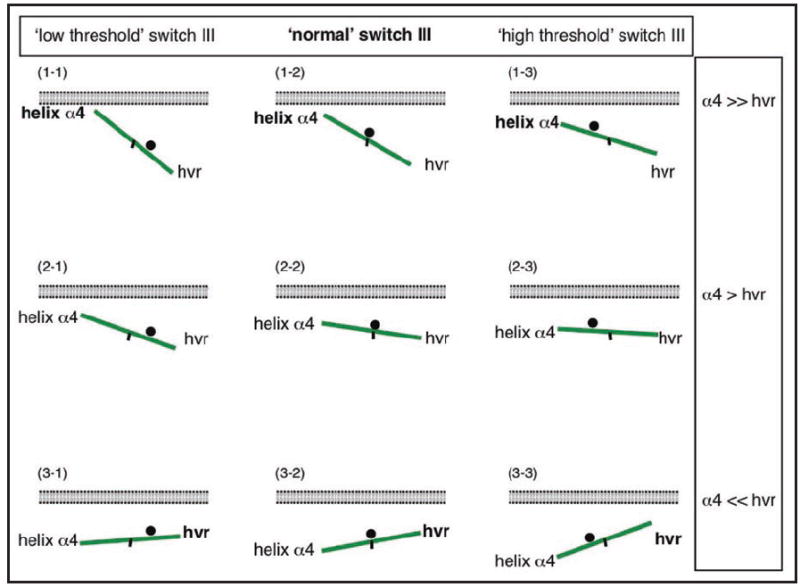
The balance model can be generalized to explain the interactions of GTP-Ras. In the balance model, the steepness of the balance correlates with the probability of a Ras-isoform to interact with e.g., a Ras binding domain of an effector. The same rule may also apply for other GTP-Ras-interacting domains or proteins. The balance can be modulated by different residues in the switched elements, the HVR and helix α4. For example, in (1-1) and (3-1), helix α4 is comparatively ‘heavier’ or ‘lighter’, than in (2-1), respectively. Another way of modulating the balance are isoform specific differences in the remainder of the G domain, which may lead to a shift of the switch III (indicated by the position of the black dot, the fulcrum of the balance). For example, in (2-1) switch III has a lower threshold, so that the same weight of helix α4 leads to a steeper balance (higher probability to reorient), as compared to (2-2). Depending on the exact combination of switch III and the switched elements the balance can be fine tuned. Note, that the balance is working upside down. The black mark at the center of the balances is to provide orientation on the position of the fulcrum (black spot).
Impact of orientation and lateral segregation on isoform specific signaling
The final signalling and biological output of a Ras isoform is a complex integration of many interactions and modifications over space and time. The strict correlation of H-ras and C-Raf-RBD interaction data and signal output (ppERK and PC12 cell differentiation),5,33 suggests that perturbations introduced into the MAPK-signalling module at the ‘balance-level’ are accurately transduced. Therefore, the orientation of a Ras protein with respect to the plasma membrane may be a general level at which isoform specific signalling is regulated. If so, how can these ideas be integrated with concepts of signalling from different nanodomains?
The difference in Ras G domain orientation may account for differences in the recruitment of effectors by membrane anchored Ras (Fig. 6). Subsequently, structural rearrangements within the effector may anchor it to the membrane via intrinsic membrane association domains, as shown for C-Raf 36. The membrane anchored effector will have a preference for a specific nanodomain. An isoform that can recruit an effector directly into the effector preferred nanodomain, will form signalling clusters with higher signalling output.37 This model would explain the isoform specific generation of a signalling complex by two Ras intrinsic determinants (Fig. 6). It would furthermore imply that downstream interaction partners and/or modifiers of the effector are also laterally segregated.
Figure 6.
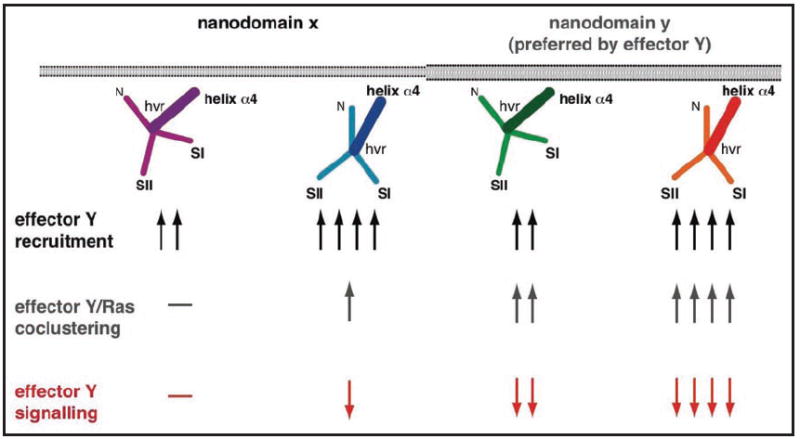
Isoform ‘flavours’ can be explained by integrating the balance model and lateral segregation. Experimentally different Ras isoforms show different signalling outputs with a given effector. Lateral segregation of Ras isoforms may account for some of these differences. The scheme shows cartoons of four different GTP-bound Ras isoforms with two different orientations in two different nanodomains. Better access of an effector to switches I and II determines recruitment of the effector from the cytosol (Fig. 3), as indicated by the increasing number of arrows (black arrows). The effector has a preference for nanodomain Y in which it may be preferentially retained and/or activated (grey arrows). Thus combining orientation and lateral segregation of Ras isoforms leads to different, graded signalling output (red arrows).
Note that these explanations are currently speculative as a direct consequence of the fact that we know little about membrane-related determinants of signalling. It is furthermore possible that e.g., lifetime and frequency of the Ras nanoclusters are altered by the different extents of reorientation. Such alterations may also impact on isoform specific signalling.
Conclusions
Considering that the first structure of Ras was solved approximately 20 years ago, it is intriguing that there is still more to be learned about Ras structure-function relationships. The orientation dependent effector interaction, which is translated into corresponding changes in signalling adds another level at which Ras function is modulated. The amino acid variation of the switched elements (HVR and helix α4) and the apparent conservation of the novel switch III among various Ras isoforms, suggests that these elements may functionally distinguish one isoform from the other. In addition to serving as a switched element, the HVR plays another critical role as a major determinant of lateral segregation. A deeper understanding of the structural basis of the orientation sensitive effector interactions and the mechanisms of local membrane lipid remodelling will provide new insights into the functioning of Ras.
The G domain of oncogenic Ras has to date been unsuccessfully targeted.38 It will be interesting to see, whether the newly identified switch III or the reorientation mechanism represent novel targets to neutralize Ras signalling in tumours.
Acknowledgments
DA is a fellow of the Swiss National Science Foundation (PA00A-111446). This work was supported by grants from the NHMRC (Australia) and NIH. The IMB is a Special Research Centre of the ARC. Confocal microscopy was performed at the Australian Cancer Research Foundation (ACRF)/Institute for Molecular Bioscience Dynamic Imaging Facility for Cancer Biology, which was established with the support of the ACRF. AAG gratefully acknowledges Prof. J. Andrew McCammon and his lab where the computational work has been carried out. Additional support has been provided by the National Science Foundation, National Institutes of Health, Howard Hughes Medical Institute, National Biomedical Computation Resource, and Accelrys Inc.
Abbreviations
- GEF
guanine nucleotide exchange factor
- GAP
GTPase activating protein
- HVR
hypervariable region
- GTP
guanosine-5’-triphosphate
- GDP
guanosine-5’-diphosphate
- MD
molecular dynamics
- EM
electron microscopy
- RBD
ras binding domain
- RA
ras association (domain)
Footnotes
Previously published online as a Cell Cycle E-publication:
References
- 1.Berney C, Danuser G. FRET or no FRET: a quantitative comparison. Biophys J. 2003;84:3992–4010. doi: 10.1016/S0006-3495(03)75126-1. [DOI] [PMC free article] [PubMed] [Google Scholar]
- 2.Wolber PK, Hudson BS. An analytic solution to the Forster energy transfer problem in two dimensions. Biophys J. 1979;28:197–210. doi: 10.1016/S0006-3495(79)85171-1. [DOI] [PMC free article] [PubMed] [Google Scholar]
- 3.Meyer BH, Segura JM, Martinez KL, Hovius R, George N, Johnsson K, Vogel H. FRET imaging reveals that functional neurokinin-1 receptors are monomeric and reside in membrane microdomains of live cells. Proc Natl Acad Sci USA. 2006;103:2138–43. doi: 10.1073/pnas.0507686103. [DOI] [PMC free article] [PubMed] [Google Scholar]
- 4.Abankwa D, Vogel H. A FRET map of membrane anchors suggests distinct microdomains of heterotrimeric G proteins. J Cell Sci. 2007;120:2953–62. doi: 10.1242/jcs.001404. [DOI] [PubMed] [Google Scholar]
- 5.Abankwa D, Hanzal-Bayer M, Ariotti N, Plowman SJ, Gorfe AA, Parton RG, McCammon JA, Hancock JF. A novel switch region regulates H-ras membrane orientation and signal output. Embo J. 2008;27:727–35. doi: 10.1038/emboj.2008.10. [DOI] [PMC free article] [PubMed] [Google Scholar]
- 6.Prior IA, Muncke C, Parton RG, Hancock JF. Direct visualization of Ras proteins in spatially distinct cell surface microdomains. J Cell Biol. 2003;160:165–70. doi: 10.1083/jcb.200209091. [DOI] [PMC free article] [PubMed] [Google Scholar]
- 7.Kiskowski MA, Kenworthy AK. In silico characterization of resonance energy transfer for disk-shaped membrane domains. Biophys J. 2007;92:3040–51. doi: 10.1529/biophysj.106.093245. [DOI] [PMC free article] [PubMed] [Google Scholar]
- 8.Simons K, Ikonen E. Functional rafts in cell membranes. Nature. 1997;387:569–72. doi: 10.1038/42408. [DOI] [PubMed] [Google Scholar]
- 9.Anderson RG, Jacobson K. A role for lipid shells in targeting proteins to caveolae, rafts, and other lipid domains. Science. 2002;296:1821–5. doi: 10.1126/science.1068886. [DOI] [PubMed] [Google Scholar]
- 10.Hancock JF. Lipid rafts: contentious only from simplistic standpoints. Nat Rev Mol Cell Biol. 2006;7:456–62. doi: 10.1038/nrm1925. [DOI] [PMC free article] [PubMed] [Google Scholar]
- 11.Abankwa D, Gorfe AA, Hancock JF. Ras nanoclusters: molecular structure and assembly. Seminars in cell & developmental biology. 2007;18:599–607. doi: 10.1016/j.semcdb.2007.08.003. [DOI] [PMC free article] [PubMed] [Google Scholar]
- 12.Parton RG, Hancock JF. Lipid rafts and plasma membrane microorganization: insights from Ras. Trends Cell Biol. 2004;14:141–7. doi: 10.1016/j.tcb.2004.02.001. [DOI] [PubMed] [Google Scholar]
- 13.Plowman SJ, Muncke C, Parton RG, Hancock JF. H-ras, K-ras and inner plasma membrane raft proteins operate in nanoclusters with differential dependence on the actin cytoskeleton. Proc Natl Acad Sci USA. 2005;102:15500–5. doi: 10.1073/pnas.0504114102. [DOI] [PMC free article] [PubMed] [Google Scholar]
- 14.Gambhir A, Hangyas-Mihalyne G, Zaitseva I, Cafiso DS, Wang J, Murray D, Pentyala SN, Smith SO, McLaughlin S. Electrostatic sequestration of PIP2 on phospholipid membranes by basic/aromatic regions of proteins. Biophys J. 2004;86:2188–207. doi: 10.1016/S0006-3495(04)74278-2. [DOI] [PMC free article] [PubMed] [Google Scholar]
- 15.McLaughlin S, Murray D. Plasma membrane phosphoinositide organization by protein electrostatics. Nature. 2005;438:605–11. doi: 10.1038/nature04398. [DOI] [PubMed] [Google Scholar]
- 16.Fratti RA, Jun Y, Merz AJ, Margolis N, Wickner W. Interdependent assembly of specific regulatory lipids and membrane fusion proteins into the vertex ring domain of docked vacuoles. J Cell Biol. 2004;167:1087–98. doi: 10.1083/jcb.200409068. [DOI] [PMC free article] [PubMed] [Google Scholar]
- 17.Reynwar BJ, Illya G, Harmandaris VA, Muller MM, Kremer K, Deserno M. Aggregation and vesiculation of membrane proteins by curvature-mediated interactions. Nature. 2007;447:461–4. doi: 10.1038/nature05840. [DOI] [PubMed] [Google Scholar]
- 18.Willumsen BM, Christensen A, Hubbert NL, Papageorge AG, Lowy DR. The p21 ras C-terminus is required for transformation and membrane association. Nature. 1984;310:583–6. doi: 10.1038/310583a0. [DOI] [PubMed] [Google Scholar]
- 19.Hancock JF. Ras proteins: different signals from different locations. Nat Rev Mol Cell Biol. 2003;4:373–84. doi: 10.1038/nrm1105. [DOI] [PubMed] [Google Scholar]
- 20.Scheffzek K, Ahmadian MR, Kabsch W, Wiesmuller L, Lautwein A, Schmitz F, Wittinghofer A. The Ras-RasGAP complex: structural basis for GTPase activation and its loss in oncogenic Ras mutants. Science. 1997;277:333–8. doi: 10.1126/science.277.5324.333. [DOI] [PubMed] [Google Scholar]
- 21.Repasky GA, Chenette EJ, Der CJ. Renewing the conspiracy theory debate: does Raf function alone to mediate Ras oncogenesis? Trends Cell Biol. 2004;14:639–47. doi: 10.1016/j.tcb.2004.09.014. [DOI] [PubMed] [Google Scholar]
- 22.Yan J, Roy S, Apolloni A, Lane A, Hancock JF. Ras isoforms vary in their ability to activate Raf-1 and phosphoinositide 3-kinase. J Biol Chem. 1998;273:24052–6. doi: 10.1074/jbc.273.37.24052. [DOI] [PubMed] [Google Scholar]
- 23.Voice JK, Klemke RL, Le A, Jackson JH. Four human ras homologs differ in their abilities to activate Raf-1, induce transformation, and stimulate cell motility. J Biol Chem. 1999;274:17164–70. doi: 10.1074/jbc.274.24.17164. [DOI] [PubMed] [Google Scholar]
- 24.Rodriguez-Viciana P, Sabatier C, McCormick F. Signaling specificity by Ras family GTPases is determined by the full spectrum of effectors they regulate. Mol Cell Biol. 2004;24:4943–54. doi: 10.1128/MCB.24.11.4943-4954.2004. [DOI] [PMC free article] [PubMed] [Google Scholar]
- 25.Wittinghofer A. Signal transduction via Ras. Biological chemistry. 1998;379:933–7. [PubMed] [Google Scholar]
- 26.Herrmann C. Ras-effector interactions: after one decade. Curr Opin Struct Biol. 2003;13:122–9. doi: 10.1016/s0959-440x(02)00007-6. [DOI] [PubMed] [Google Scholar]
- 27.Prior IA, Hancock JF. Compartmentalization of Ras proteins. J Cell Sci. 2001;114:1603–8. doi: 10.1242/jcs.114.9.1603. [DOI] [PubMed] [Google Scholar]
- 28.Tian T, Harding A, Inder K, Plowman S, Parton RG, Hancock JF. Plasma membrane nano-switches generate high-fidelity Ras signal transduction. Nat Cell Biol. 2007;9:905–14. doi: 10.1038/ncb1615. [DOI] [PubMed] [Google Scholar]
- 29.Prior IA, Parton RG, Hancock JF. Observing cell surface signaling domains using electron microscopy. Sci STKE. 2003;2003:9. doi: 10.1126/stke.2003.177.pl9. [DOI] [PubMed] [Google Scholar]
- 30.Rotblat B, Prior IA, Muncke C, Parton RG, Kloog Y, Henis YI, Hancock JF. Three separable domains regulate GTP-dependent association of H-ras with the plasma membrane. Mol Cell Biol. 2004;24:6799–810. doi: 10.1128/MCB.24.15.6799-6810.2004. [DOI] [PMC free article] [PubMed] [Google Scholar]
- 31.Plowman SJ, Hancock JF. Ras signaling from plasma membrane and endomembrane microdomains. Biochim Biophys Acta. 2005;1746:274–83. doi: 10.1016/j.bbamcr.2005.06.004. [DOI] [PubMed] [Google Scholar]
- 32.Prior IA, Harding A, Yan J, Sluimer J, Parton RG, Hancock JF. GTP-dependent segregation of H-ras from lipid rafts is required for biological activity. Nat Cell Biol. 2001;3:368–75. doi: 10.1038/35070050. [DOI] [PubMed] [Google Scholar]
- 33.Gorfe AA, Bayer MH, Abankwa D, Hancock JF, McCammon JA. Structure and dynamics of the full-length lipid-modified H-Ras protein in a 1,2-dimyristoylglycero-3-phosphocho-line bilayer. J Med Chem. 2007;50:674–84. doi: 10.1021/jm061053f. [DOI] [PubMed] [Google Scholar]
- 34.Gorfe AA, Grant BJ, McCammon JA. Mapping the nucleotide and isoform-dependent structural and dynamical features of ras proteins. Structure. 2008;16:885–96. doi: 10.1016/j.str.2008.03.009. [DOI] [PMC free article] [PubMed] [Google Scholar]
- 35.Belanis L, Plowman SJ, Rotblat B, Hancock JF, Kloog Y. Galectin-1 is a novel structural component and a major regulator of h-ras nanoclusters. Mol Biol Cell. 2008;19:1404–14. doi: 10.1091/mbc.E07-10-1053. [DOI] [PMC free article] [PubMed] [Google Scholar]
- 36.Terai K, Matsuda M. Ras binding opens c-Raf to expose the docking site for mitogen-activated protein kinase kinase. EMBO Rep. 2005;6:251–5. doi: 10.1038/sj.embor.7400349. [DOI] [PMC free article] [PubMed] [Google Scholar]
- 37.Plowman SJ, Ariotti N, Goodall A, Parton RG, Hancock JF. Electrostatic interactions positively regulate K-Ras nanocluster formation and function. Mol Cell Biol. 2008 doi: 10.1128/MCB.00050-08. [DOI] [PMC free article] [PubMed] [Google Scholar]
- 38.Downward J. Targeting RAS signalling pathways in cancer therapy. Nature reviews. 2003;3:11–22. doi: 10.1038/nrc969. [DOI] [PubMed] [Google Scholar]